Hey guys,
to be honest, i'm really disappointed of the latest MT4 software.
I just can't belive that the mega bug with the trendline ( moving from timeframe to timeframe ) which had been discussed several times on almost every forum i know, is still there.
I just don't get it. It's such a pain to check and recheck and recheck my trendline in D1, H4 ,H1 ,M15 timeframe.
Knowing that the bug is still there, it never feels save after making a good technical analysis and i'm quite sure that so many MT4 users can feel my pain.
Hey mate,
thanks for dropping in.-
here we go.
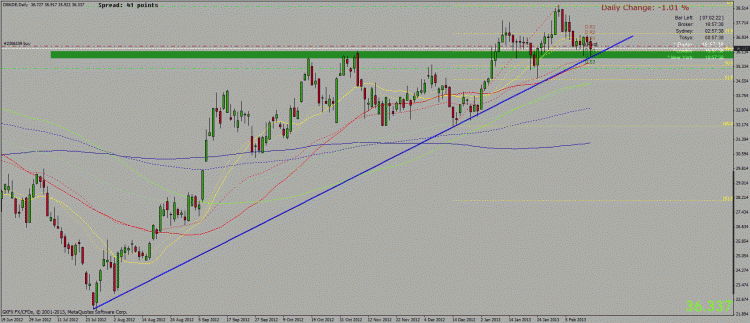
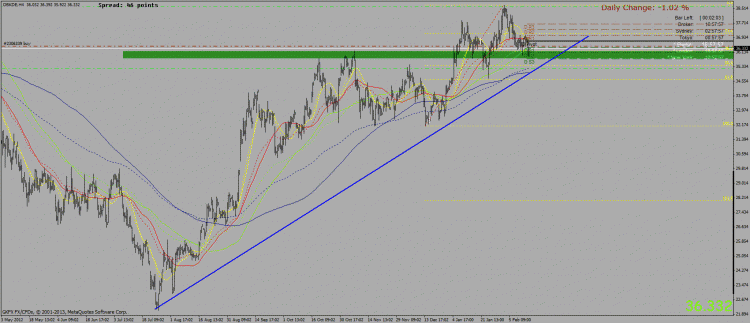
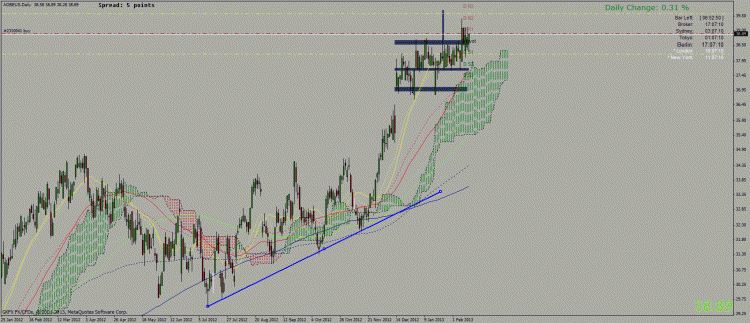
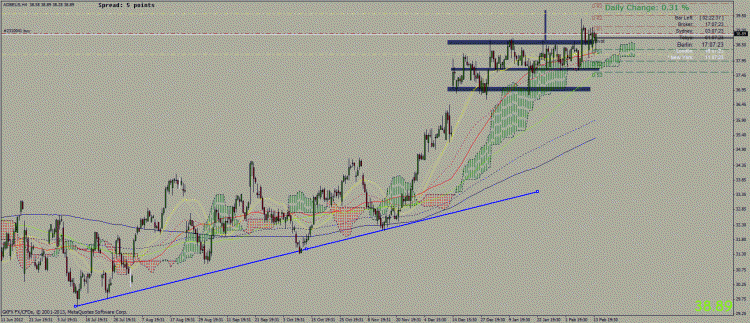
Two Charts on the Daimler Stock.
So by switch the timeframe from daily to H4, you can clearly see the big discrepancy on the the trendline.
When i switch to H1 and discrepancy is even bigger.
Relying on that bug when trying to do decent technical analysis is impossible.
regards
kslay
It seems , that it has something to do with the last anchor point of the trendline.
the more the end point is in the future the bigger the discrepancy get.
here more screens
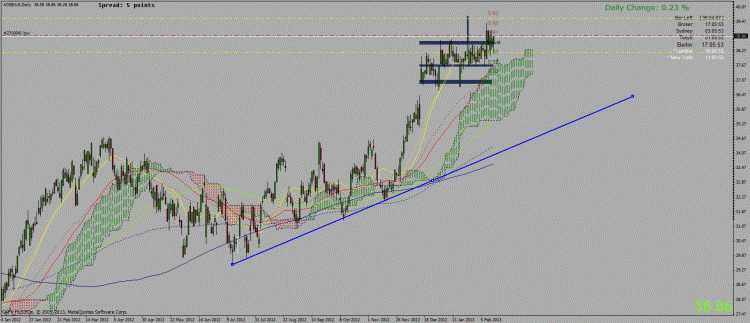
Adobe Stock Daily
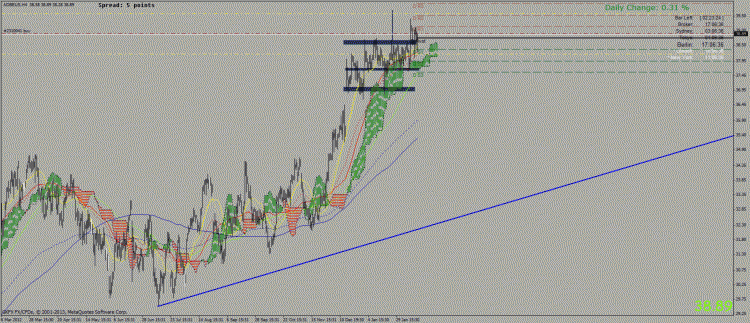
Adobe daily - shorter endpoint
Now, i have the experience that it is not always the same.
Sometimes i get this huge difference, and sometime the discrepancy is a bit smaller..
regards
kslay
It seems , that it has something to do with the last anchor point of the trendline.
the more the end point is in the future the bigger the discrepancy get.
Thanks for the information RaptorUK.
If i understand you right, that would mean that creating trendlines which has their anchor end point in the future ( several days or hours )
this will automatically lead to this "failure" when switching the timeframes?
Thanks for the information RaptorUK.
If i understand you right, that would mean that creating trendlines which has their anchor end point in the future ( several days or hours )
this will automatically lead to this "failure" when switching the timeframes?
- Free trading apps
- Over 8,000 signals for copying
- Economic news for exploring financial markets
You agree to website policy and terms of use
Hey guys,
to be honest, i'm really disappointed of the latest MT4 software.
I just can't belive that the mega bug with the trendline ( moving from timeframe to timeframe )
which had been discussed several times on almost every forum i know, is still there.
I just don't get it. It's such a pain to check and recheck and recheck my trendline in D1, H4 ,H1 ,M15 timeframe.
Knowing that the bug is still there, it never feels save after making a good technical analysis and i'm quite
sure that so many MT4 users can feel my pain.
Right now, i'm dealing with Stock CFDs (GKFX Broker ) and i have heard that there could be a solution
in order to change the history data and delete the sunday D1 Chart... Actually maybe this is just rumor but
i just want a clear answer from the developers why this bug is still there, and how we can override it
in order to fix this damn problem. It's really starting to get ridiculous.
P.,s please excuse my rant....
best regards
kslay