Help with this code please
void CheckTradeInfo()
{

   for (int cnt = OrdersTotal()-1; cnt >= 0; cnt--)
   {

      if(OrderSelect(cnt,SELECT_BY_POS,MODE_TRADES)== false) break;
In this bit the break should be a continue.
You shouldn't quit the whole loop just because one order failed to select.
(Not your overall problem but something to fix.)
void CheckTradeInfo()
{

   for (int cnt = OrdersTotal()-1; cnt >= 0; cnt--)
   {

      if(OrderSelect(cnt,SELECT_BY_POS,MODE_TRADES)== false) break;

      if (show_all_open_orders != false)
      {
      }
      else
      {
      if(OrderSymbol() != Symbol()) continue;
      }

      if (OrderCloseTime()==0)
      {
            if(OrderType()==OP_SELL)
In this bit there is no need to check for OrderCloseTime()==0
The order cannot be closed because you just selected it from the MODE_TRADES pool, that is orders which are open.
int start()
  {
   int counted_bars=IndicatorCounted();
   RefreshRates();
Here you do not ever use counted_bars so delete it.
You do not need or want to RefreshRates() immediately at the beginning of the start function. A new price quote (tick) occurs and that triggers the start function to be called. The only reason to use RefreshRates is when you have been busy calculating stuff for so long that the last quote price could be out of date. This is always needed, for example, when opening or closing multiple positions one immediately after the other. The opening or closing of a trade typically takes so long that the last quote is often out of date.
Thank you dabbler that was something I had added and didn't change back.
To create the select option I added this code along with Boolean code at the top
if (show_all_open_orders != false)
{
}
else
{
if(OrderSymbol() != Symbol()) continue;
}
This was swiped from another indicator and it works well besides the 2 order display limit that I have yet to figure out. I hope this code makes sense too though. Basically when it set to true I want all orders to be displayed regardless of what chart I have open and when it is set to false it will only display the active orders for whatever chart I have open. It does function perfectly at the moment, again it's just that 2 order limit that is the problem.
My hunch when looking through the code is that it is something in the following code that is causing my problem
 for (int cnt = OrdersTotal()-1; cnt >= 0; cnt--)
   {

      if(OrderSelect(cnt,SELECT_BY_POS,MODE_TRADES)== false) continue;
Thanks for your help so far dabbler I was writing this as you were posting your extra replies. I have made those changes.
In the init function you have 12 blocks of object creation which are very similar. It will be easier to do this as a loop, something like this ...
#define GAP 25
  // you can add more labels or change their names as you like
  string labels[]={"label1","label2","label3", "lable4","lable5"};
  int end = ArraySize(labels);


  for( int n=0; n< end; n++ ){
      ObjectCreate(labels[n], OBJ_LABEL, 0, 0, 0);
      ObjectSet(labels[n], OBJPROP_CORNER, 3);
      ObjectSet(labels[n], OBJPROP_XDISTANCE, (n+1)*GAP);
      ObjectSet(labels[n], OBJPROP_YDISTANCE, 5);
      ObjectSetText(labels[n],"",12,"Arial",White);
  }
Or, if any label name is ok then you can skip the array
#define GAP 25

  for( int n=0; n< 10; n++ ){
      ObjectCreate("label"+n, OBJ_LABEL, 0, 0, 0);
      ObjectSet("label"+n, OBJPROP_CORNER, 3);
      ObjectSet("label"+n, OBJPROP_XDISTANCE, (n+1)*GAP);
      ObjectSet("label"+n, OBJPROP_YDISTANCE, 5);
      ObjectSetText("label"+n,"",12,"Arial",White);
  }
That's interesting. The reason I had 12 different object's is because I thought I needed them for positioning purposes. For example to make sure buy orders appeared above sell orders when displayed etc?
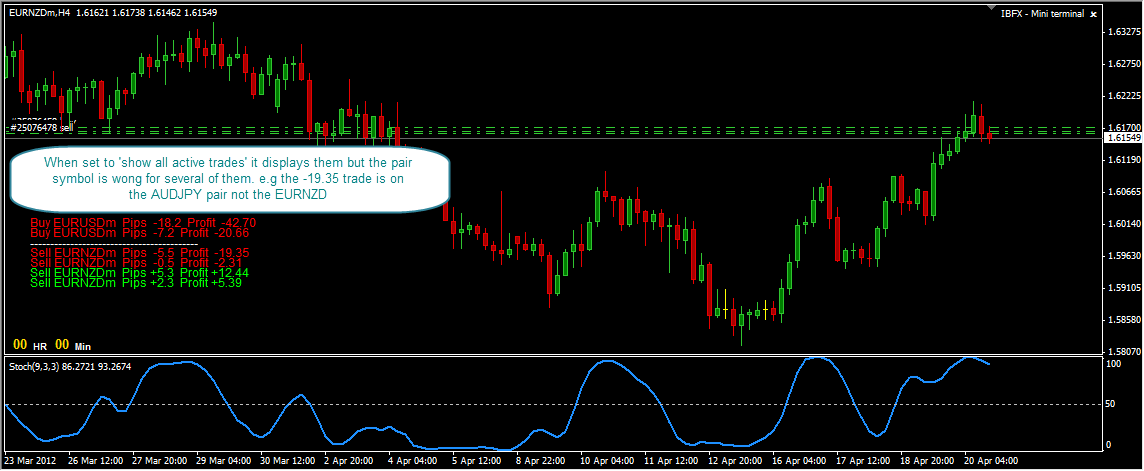
Can your example code result in a similar display to the screen shot above?
Edit: I have tried your array code and even though it does work to create all the labels it doesn't display them properly or in proper order. At first they were all on top of each other but as I adjusted the GAP value they spread out on one line but as I said out of order. Changing around the order of the labels in the code fixed that and then I got the idea to just make 2 arrays, one for the buy objects and another for the sell objects and use a different Y axis value on them so the buy and sell orders would sit on top of each other (like shown in the screen shot above). It helped but the GAP seems to be off somewhat and when I adjust it big enough to allow for several decimal places in the profit/pips labels it comes out too far from the bottom right corner.
Anyways it's good to know for the future now that I have tried it but really all I need to figure out at this point is get rid of whatever is creating the limit on how many open order are displayed on screen.
Thanks again
peteshr2st:
Edit: I have tried your array code and even though it does work to create all the labels it doesn't display them properly or in proper order. At first they were all on top of each other but as I adjusted the GAP value they spread out on one line but as I said out of order.
You see the thing is, if you want twice as many labels duplicating the code manually is VERY boring, whereas making the loop longer is easy.
So the reason they are all on the same line is because their YDISTANCE is the same. The original used 5 and 20. So you can use say 4 loops with YDISTANCE 5, 20, 35 and 50. Or you could put one loop inside another, depending on exactly how many labels you want.
It's obviously complicated using a separate label for each part of the line but eventually may look prettier. If you just put all the data into one long string it would be a hell of lot simpler (but not as colorful).
Two loops with one inside the other would look like this (this is called NESTED LOOPS)
#define XGAP 25
#define YGAP 15

   for( int m=0; m<4; m++ ){
      for( int n=0; n< 10; n++ ){
         ObjectCreate("label"+n+m, OBJ_LABEL, 0, 0, 0);
         ObjectSet("label"+n+m, OBJPROP_CORNER, 3);
         ObjectSet("label"+n+m, OBJPROP_XDISTANCE, (n+1)*XGAP);
         ObjectSet("label"+n+m, OBJPROP_YDISTANCE, 5+YGAP*m);
         ObjectSetText("label"+n+m,"",12,"Arial",White);
      }
   }
peteshr2st:
Anyways it's good to know for the future now that I have tried it but really all I need to figure out at this point is get rid of whatever is creating the limit on how many open order are displayed on screen.
The "problem" is the CheckTradeInfo function. you have only one variable sellprice for example. Therefore the function keeps overwriting that value with each new sell order it finds. You either have to create an array of them or get CheckTradeInfo to generate a string and add the strings together (concatenate). Now this is probably above your head at the moment. Think it through as you run through the loop in CheckTradeInfo and see how every time it gets to setting sellprice it writes to the same global variable. I think that is pretty easy. Now to fix it you could use an array of sellprices. Then you would need an index to see which one you were writing to. All very messy. But if it just creates a string, you can just add the strings (concatenate) and use the line break character "\n" so they print on separate lines in the comment field. It's not as pretty but it is a whole lots easier, especially for a beginner.
string str = "EURUSD sold at 1.2345 with profit of £23.34";

string str2 = "EURUSD bought at 1.3242 with loss of -£32425";

str = str + "\n" + str2;  // and you can have as many as will fit on the screen without much effort
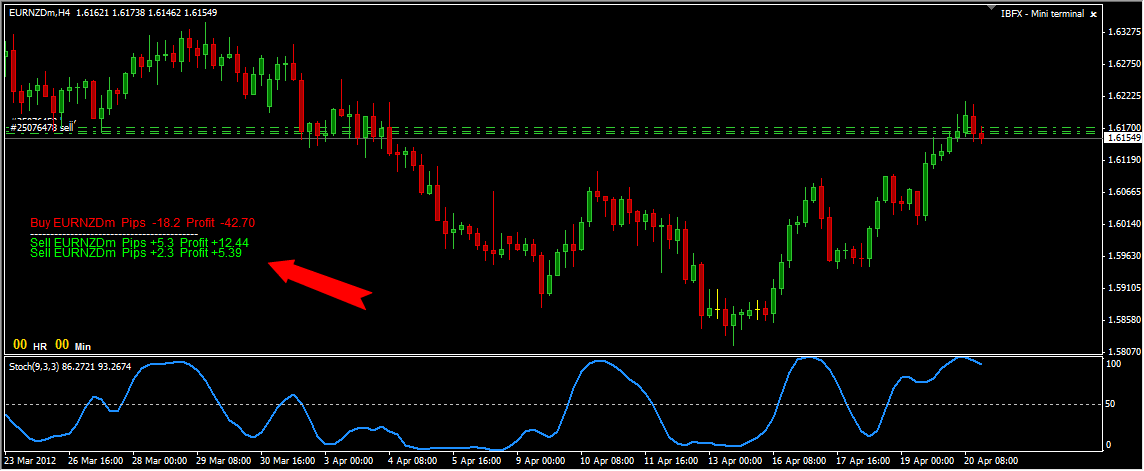
Hi dabbler after a lot of thinking I started to experiment with another piece of code that does something similar to my one. I went at it because it use's similar coding to the one you have described above (arrays etc). It basically displays all your active open orders per pair. So if you have 3 open pair for the eurusd and you go to that chart you will see your 3 active trades on screen. See screen shot 2 below.
Before I started customizing it it would only show your ticket number, lots and profit. Looked messy enough too. I now have it edited to display the symbol, current pips and current profit. I also added the option to select show all active trades or show just the active trades for the chart/pair you have open. This is exactly the same as I have described above using the Boolean true/false select.
Here is my problem. This now shows me all active trades I have on each chart as I go through them but when I set the boolean to show all trades it displays all of them but the symbols are off. Again it will only display a max of 2 currency symbols. As you said this is down to the variables buysymbol and sellsymbol only containing one at any one time but I don't know how to get around this. I tried using arrays but since the symbols are letters not numbers I am running into some problems it seems.
A screen shot should show all this better.
Here is another screenshot showing it working perfectly when set to display only active trades for the chart you are on. In this case it's the EURNZD showing 3 active trades.
One other small thing I can't figure out yet is creating some space between the trades on screen. There strings that are responsible for displaying the trades. Here is an example.
res = "Buy " +buysymbol+ " Pips +" + DoubleToStr(buys_list[i][2]/10, 1) + " Profit +" + DoubleToStr(buys_list[i][1], 2);
I thought I could add a new line between trades by adding the + "\n" as shown below but it didn't have any effect at all.
res = "Buy " +buysymbol+ " Pips +" + DoubleToStr(buys_list[i][2]/10, 1) + " Profit +" + DoubleToStr(buys_list[i][1], 2) + "\n";
The new indicator code is attached below anyways.
Thanks again for all your help dabbler. I really appreciate it.
This part is clumsy and not indented correctly ...
   if (show_all_open_orders != false)
      {
      }
      else
      {
      if(OrderSymbol() != Symbol()) continue;
      }
All you need is ...
   if( !show_all_open_orders ){
      if( OrderSymbol() != Symbol() )
           continue;
   }
- Free trading apps
- Over 8,000 signals for copying
- Economic news for exploring financial markets
You agree to website policy and terms of use
Hello everyone,
First off I have to tell you all I am not a programmer but I have put in every effort to figure this out before asking for your help. Basically I came across a cool MT4 indicator and started editing it. After a lot of trial and error I have actually made good progress and learned a lot about MT4 coding today but I am now stumped and could really do with a few pointers from some of you please.
Basically this indicator displays your active open orders and their pips and profit values. The original coding seems to have a restriction on the amount of trades it will display on screen at any one time though. For example if I have 4 trades active it will only display 1 buy and 1 sell trade from the 4. When I close one of the trades that is displaying on screen another active trade will then replace it. The problem is I need all active trades to display on screen.
I really have tried to the best of my ability to figure this out but I can't. I have even manged to add another select option to the indicator that makes it display only the open trades that are active per pair. So for example if I have 2 EURUSD trades open then they will only appear on the EURUSD chart and other active trades will appear only on their respective charts. The problem is again if I have more than 2 active trades for the same currency this option will only display 2 at any one time as well.
I really appreciate any help you can give me. Today is the first time I have touched MT4 code and I am delighted I managed to customize the indicator as much as I have already it's just this display limit of 2 that has really got me stuck. It's actually a very useful indicator I hope to share with other traders online when I can get this part sorted out.
Thanks for your time
Here is a screenshot. In the bottom right you will see it shows 2 open trades even if there are more than 2 trades open.
*Indicator is attached