Please check the code
The difference is a small number, it will be shown on your main chart window but right at the bottom, try changing . . .
#property indicator_chart_window
to . . .
#property indicator_separate_window
then you should see your line.
The difference is a small number, it will be shown on your main chart window but right at the bottom, try changing . . .
to . . .
then you should see your line.
Thanks for the reply,
Could you please tell than, what if that I instead of calculating the difference, it could show just a trend line connecting the two points on the present forming bar, is it possible?
Thanks a lot!
Jay
Thanks for the reply,
Could you please tell than, what if that I instead of calculating the difference, it could show just a trend line connecting the two points on the present forming bar, is it possible?
Thanks a lot!
Jay
RaptorUK:
What 2 points ? drawing a trend line is simple, just use an Object, ObjectCreate() OBJ_TREND
Between the two supports, support of first bar and support of second bar
I am not good at coding, could you please explain how it is to be done? thx!
Try changing this . . .
ExtMapBuffer1[pos]= dResult;
to this . . .
ExtMapBuffer1[pos+1]= dPivot1;
or . . .
ExtMapBuffer1[pos+1] = dSup1;
To be honest I don't understand what you are trying to show with this Indicator . . .
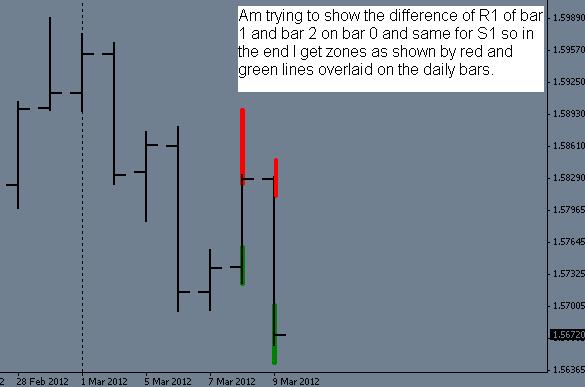
This is what I am trying to do, may now you can help plz thanks!
This is what I am trying to do, may now you can help plz thanks!
I'm happy to try and help but I'm not going to code this for you, if you need someone to code it you can pay here: MT4 & MT5 coding
What you need is 4 Buffers, 2 sets of 2, each set is used for a Histogram, one set for the Red histograms, one set for the Green histograms. The buffers in each set are the start and end prices of the red/green bars.
If your coding skills aren't very good then this is a great opportunity to learn.
What you need is 4 Buffers, 2 sets of 2, each set is used for a Histogram, one set for the Red histograms, one set for the Green histograms. The buffers in each set are the start and end prices of the red/green bars.
- Free trading apps
- Over 8,000 signals for copying
- Economic news for exploring financial markets
You agree to website policy and terms of use
Could anybody please check the code
I want it to draw a moving average based on the difference between Support of 1st bar and Support of 2nd bar.
thanks,
Jay