How create bar or candle in subwindow ??
Hello ;
I would like to represent at the first time the Macd (with 2lines ) in Bar or like a candle just with body : so if line1 > line2 I draw it in Blue and of course in opposite in red :
so my problem is how to proceed ?
Hello;
do you think that I must use histogram cause here I make : // SetIndexStyle(0,DRAW_LINE); as a comment
int init()
  {
//---- indicators
  // SetIndexStyle(0,DRAW_LINE);
   SetIndexBuffer(0,ExtMapBuffer1);
  // SetIndexStyle(1,DRAW_LINE);
   SetIndexBuffer(1,ExtMapBuffer2);
//----
   return(0);
}
so do you think that we must use SetIndexStyle(0,DRAW_HISTOGRAM); even if we draw an object ?? with ObjectCreate(nomligne,OBJ_TREND,
I try to change the code as you preconize :
#property indicator_separate_window
//#property indicator_chart_window
#property indicator_buffers 2
#property indicator_color1 Blue
#property indicator_color2 DarkKhaki
//--- buffers
double ExtMapBuffer1[];
double ExtMapBuffer2[];
//+------------------------------------------------------------------+
//| Custom indicator initialization function                         |
//+------------------------------------------------------------------+
int init()
  {
//---- indicators
   SetIndexStyle(0,DRAW_HISTOGRAM);
   SetIndexBuffer(0,ExtMapBuffer1);
   SetIndexStyle(1,DRAW_HISTOGRAM);
   SetIndexBuffer(1,ExtMapBuffer2);
//----
   return(0);
  }
//+------------------------------------------------------------------+
//| Custom indicator deinitialization function                       |
//+------------------------------------------------------------------+
int deinit()
  {
//----

//----
   return(0);
  }
//+------------------------------------------------------------------+
//| Custom indicator iteration function                              |
//+------------------------------------------------------------------+
int start()
  {
   int    counted_bars=IndicatorCounted();
   int limit ;
   string nomligne;
   bool normal ;
//----

  if(counted_bars>0) counted_bars--;
      limit=Bars-counted_bars;

    //-- first moving average in the first buffer
       for(int i=0; i<limit; i++)
    {

           // iCustom(NULL,0,"Hausseforce2",65,13,0,i);

           if(iCustom(NULL,0,"MACD",12,26,9,0,i)>=iCustom(NULL,0,"MACD",12,26,9,1,i))
           {
              ExtMapBuffer1[i]= iCustom(NULL,0,"MACD",12,26,9,0,i)- iCustom(NULL,0,"MACD",12,26,9,1,i);
           }
           else{

              ExtMapBuffer2[i]=iCustom(NULL,0,"MACD",12,26,9,0,i)- iCustom(NULL,0,"MACD",12,26,9,1,i);

           }


  }

return 0;

}
but he draws it like in the zero line like an histogram Macd !!
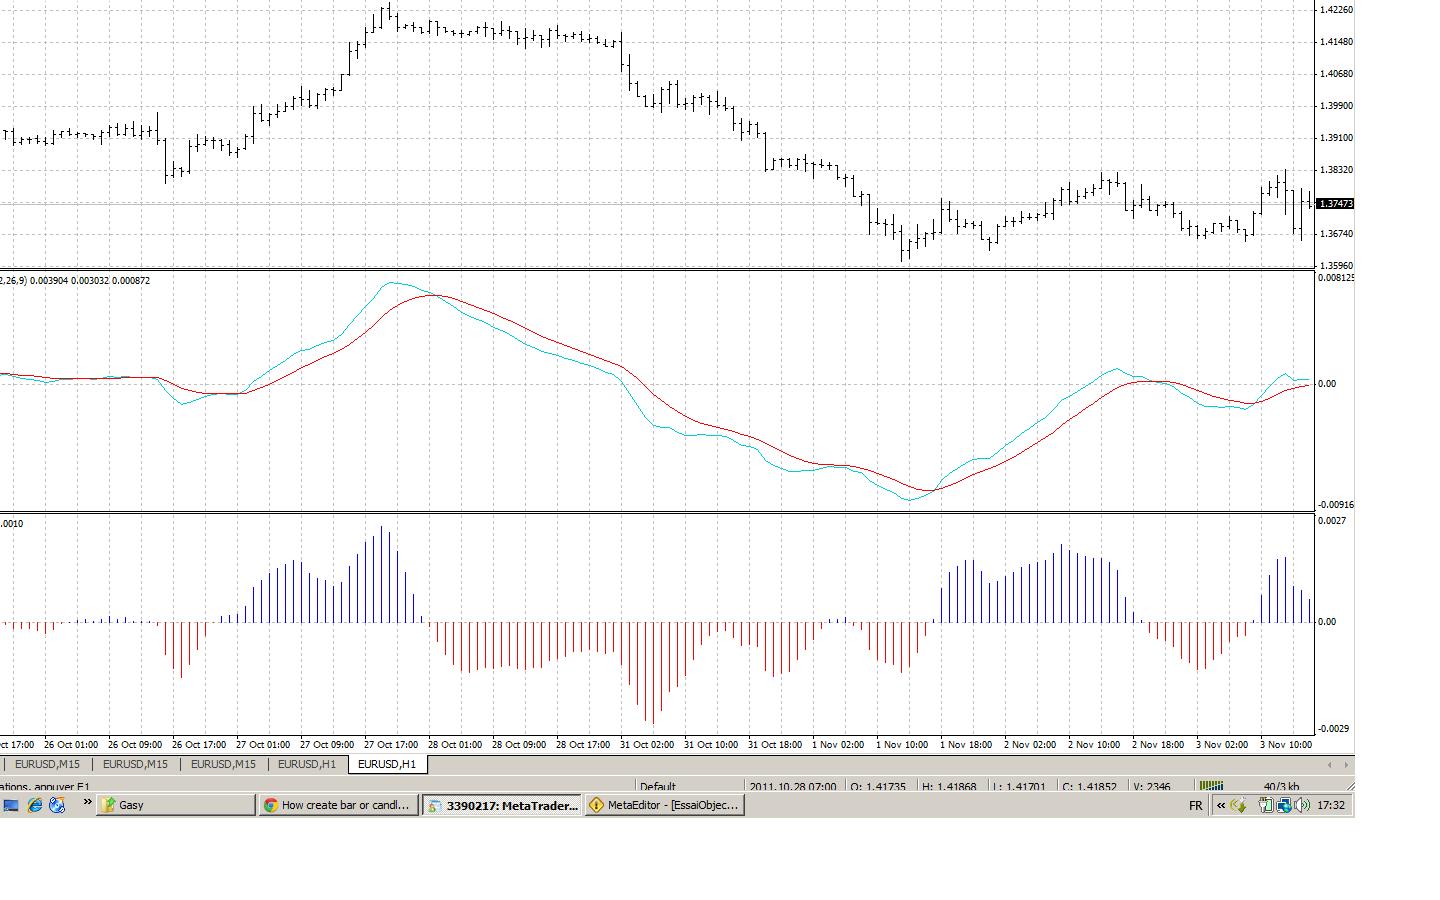
but me I would like to represent the MAcd like the first indicator (with 2 lines) but instead of 2 lines It shows me a bar or like a body candle !! and when if the 2 lines crosses over it's color is blue if not we draw it red
something like that : (the first image on the right where we present the indicator by candle
I try to change the code as you preconize :
but he draws it like in the zero line like an histogram Macd !!
but me I would like to represent the MAcd like the first indicator (with 2 lines) but instead of 2 lines It shows me a bar or like a body candle !! and when if the 2 lines crosses over it's color is blue if not we draw it red
something like that : (the first image on the right where we present the indicator by candle
I think the problem with Histogram is it 'is drawed on horizontal line (0)
I think the problem with Histogram is it 'is drawed on horizontal line (0)
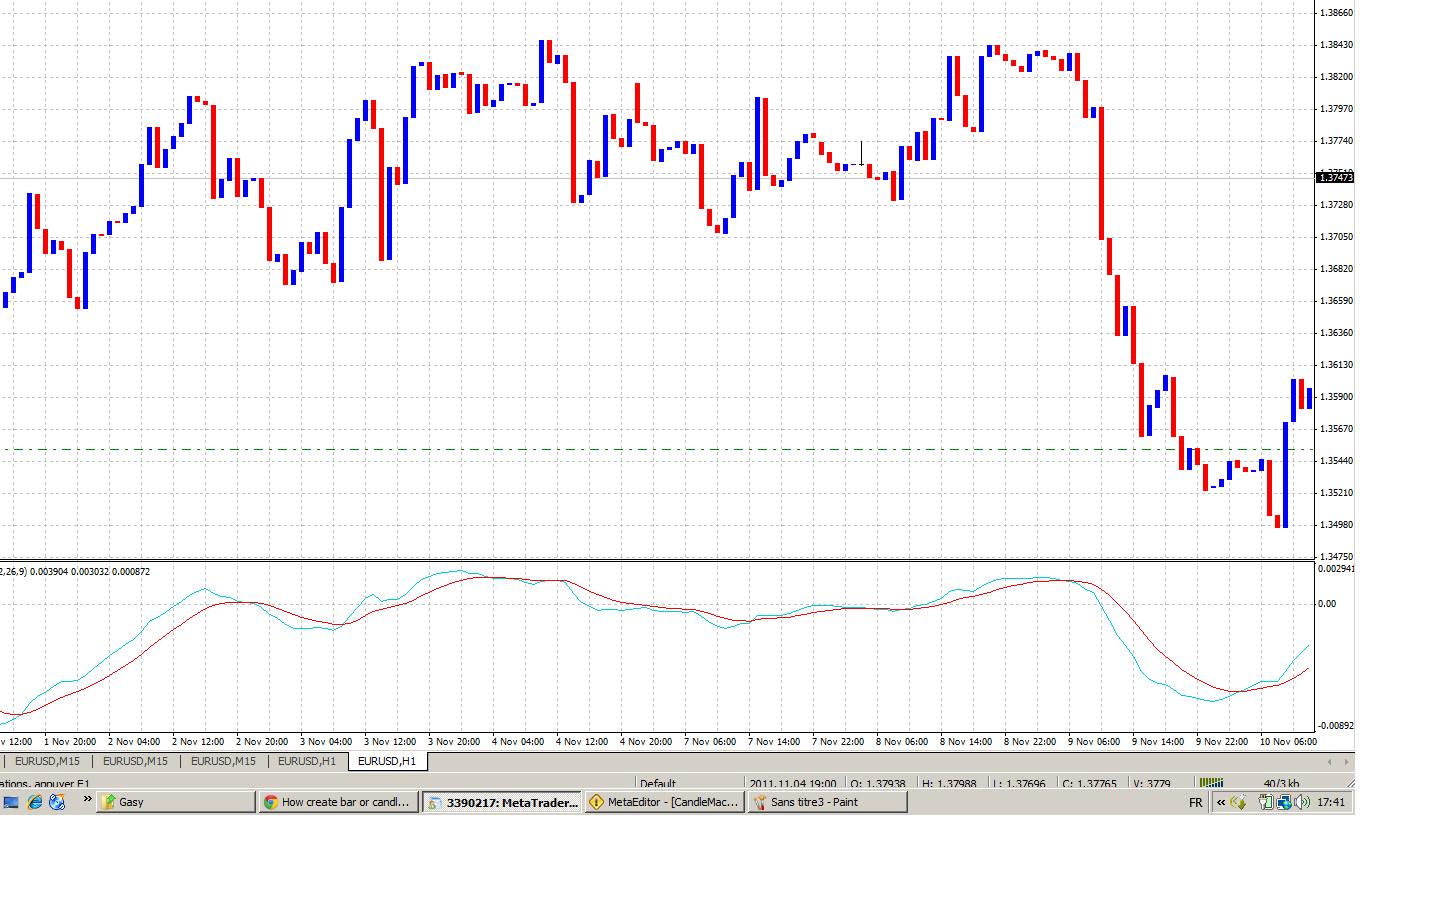
I would like to create something like that but here it is in the principal window and basing on Close and open (here is just : the body of candle ) .
and I would do the same for Macd where there are 2 lines
Your else in your code means you have a value for buffer1 OR buffer2 . . you have to have 2 values for each bar . . . START and STOP . . .
if(iCustom(NULL,0,"MACD",12,26,9,0,i)>=iCustom(NULL,0,"MACD",12,26,9,1,i))
           {
              ExtMapBuffer1[i]= iCustom(NULL,0,"MACD",12,26,9,0,i)- iCustom(NULL,0,"MACD",12,26,9,1,i);
           }
           else{

              ExtMapBuffer2[i]=iCustom(NULL,0,"MACD",12,26,9,0,i)- iCustom(NULL,0,"MACD",12,26,9,1,i);

           }
. . . otherwise the bar runs from 0 to buffer_value.
Get rid of the else and if
ExtMapBuffer1[i]= iCustom(NULL,0,"MACD",12,26,9,0,i)- iCustom(NULL,0,"MACD",12,26,9,1,i);

ExtMapBuffer2[i]=iCustom(NULL,0,"MACD",12,26,9,0,i)- iCustom(NULL,0,"MACD",12,26,9,1,i);
hi,
with code :
int start()
  {
   int    counted_bars=IndicatorCounted();
   int limit ;
   string nomligne;
   bool normal ;
//----

  if(counted_bars>0) counted_bars--;
      limit=Bars-counted_bars;

    //-- first moving average in the first buffer
       for(int i=0; i<limit; i++)
    {

    ExtMapBuffer1[i]= iCustom(NULL,0,"MACD",12,26,9,0,i)- iCustom(NULL,0,"MACD",12,26,9,1,i);

     ExtMapBuffer2[i]=iCustom(NULL,0,"MACD",12,26,9,0,i)- iCustom(NULL,0,"MACD",12,26,9,1,i);

  }


//----
   return(0);
  }
//+------------------------------------------------------------------+
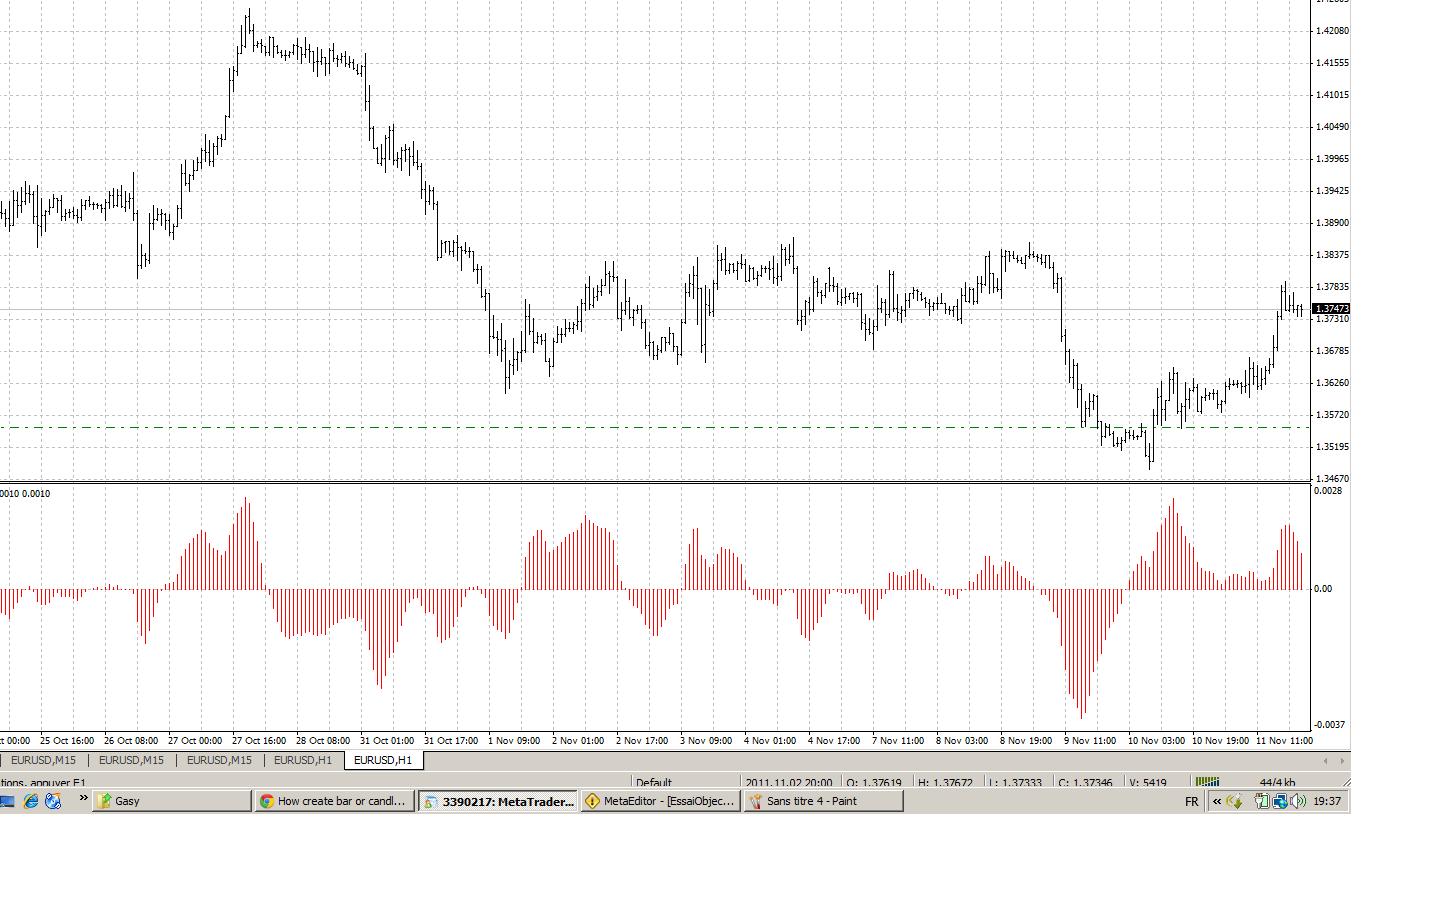
as you can see it represents just one buffer I suppose the blue is absent !! and hre the problem is the histogram draw under and above the horizontal line 0
These calculations are the same . . .
ExtMapBuffer1[i]=   iCustom(NULL,0,"MACD",12,26,9,0,i)- iCustom(NULL,0,"MACD",12,26,9,1,i);

ExtMapBuffer2[i]=   iCustom(NULL,0,"MACD",12,26,9,0,i)- iCustom(NULL,0,"MACD",12,26,9,1,i);
. . . doesn't seem correct to me.
something like this?
//---- indicator settings
#property  indicator_separate_window
#property  indicator_buffers 4
#property  indicator_color1  Black
#property  indicator_color2  LimeGreen
#property  indicator_color3  FireBrick
#property  indicator_color4  Yellow

extern int FastEMA   = 12,
           SlowEMA   = 26,
           SignalSMA = 9;
//---- indicator buffers
double     MACDBuffer[];
double     ExtBuffer1[];
double     ExtBuffer2[];
double     SignalBuffer[];

//+------------------------------------------------------------------+
//| Custom indicator initialization function                         |
//+------------------------------------------------------------------+
int init()
  {
   //---- drawing settings
   SetIndexStyle(0,DRAW_NONE);
   SetIndexStyle(1,DRAW_HISTOGRAM,EMPTY,3);
   SetIndexStyle(2,DRAW_HISTOGRAM,EMPTY,3);
   SetIndexStyle(3,DRAW_LINE);
   IndicatorDigits(Digits+1);
   SetIndexDrawBegin(0,34);
   SetIndexDrawBegin(1,34);
   SetIndexDrawBegin(2,34);
   SetIndexDrawBegin(3,34);
//---- 4 indicator buffers mapping
   SetIndexBuffer(0,MACDBuffer);
   SetIndexBuffer(1,ExtBuffer1);
   SetIndexBuffer(2,ExtBuffer2);
   SetIndexBuffer(3,SignalBuffer);
//---- name for DataWindow and indicator subwindow label
   IndicatorShortName("MACD("+FastEMA+","+SlowEMA+","+SignalSMA+")");
   SetIndexLabel(0,NULL);
   SetIndexLabel(1,"MACD");
   SetIndexLabel(2,"MACD");
   SetIndexLabel(3,"Signal");
//---- initialization done
   return(0);
  }
//+------------------------------------------------------------------+
//| MACD Oscillator                                               |
//+------------------------------------------------------------------+
int start()
  {
   int    limit;
   int    counted_bars=IndicatorCounted();
   double prev,current,signal;
//---- last counted bar will be recounted
   if(counted_bars>0) counted_bars--;
   limit=Bars-counted_bars;
//---- macd
   for(int i=0; i<limit; i++)
      MACDBuffer[i]=iMACD(NULL,0,FastEMA,SlowEMA,SignalSMA,PRICE_CLOSE,MODE_MAIN,i) ;
//----signal
   for(i=0; i<limit; i++)
      SignalBuffer[i]=iMACD(NULL,0,FastEMA,SlowEMA,SignalSMA,PRICE_CLOSE,MODE_SIGNAL,i) ;
//---- dispatch values between 2 buffers
   bool up=true;
   for(i=limit-1; i>=0; i--)
     {
      current=MACDBuffer[i];
      prev=MACDBuffer[i+1];
      signal=SignalBuffer[i];
      if(current>prev && current>signal) up=true;
      if(current<prev && current<signal) up=false;
      if(!up)
        {
         ExtBuffer2[i]=current;
         ExtBuffer1[i]=0.0;
        }
      else
        {
         ExtBuffer1[i]=current;
         ExtBuffer2[i]=0.0;
        }
     }
//---- done
   return(0);
  }
//+------------------------------------------------------------------+
- Free trading apps
- Over 8,000 signals for copying
- Economic news for exploring financial markets
You agree to website policy and terms of use
Hello ;
I would like to represent at the first time the Macd (with 2lines ) in Bar or like a candle just with body : so if line1 > line2 I draw it in Blue and of course in opposite in red :
so my problem is how to procede ?? the discussion about it is here where he would to draw Haikin Ashi in subwindow :
https://www.mql5.com/en/forum/120003
so I begin we simple code basing on MAcd (I suppose that I have Macd as an indicator and call it by the function iCustom
I don't know if it's necessary to declare the 2 buffers ( ExtMapBuffer1, ExtMapBuffer2) like that :
my other problem is the function Objectcreate . so I think i the objectcreate function the time of the 2 lines is the same but not their value !!
ObjectCreate(nomligne,OBJ_TREND,1,Time[i],ExtMapBuffer1[i],Time[i],ExtMapBuffer2[i]);
the macd is like this :
and the result of this code is :
so do you have an idea ?
thanks