Need Help On Optimization Result
Test the EA with the optimized parameters on another timepreriod (outside the period you have optimized).
Profit is not a good optimization paramter, profit factor and drawdown say more about a strategy..
my 2 cents.
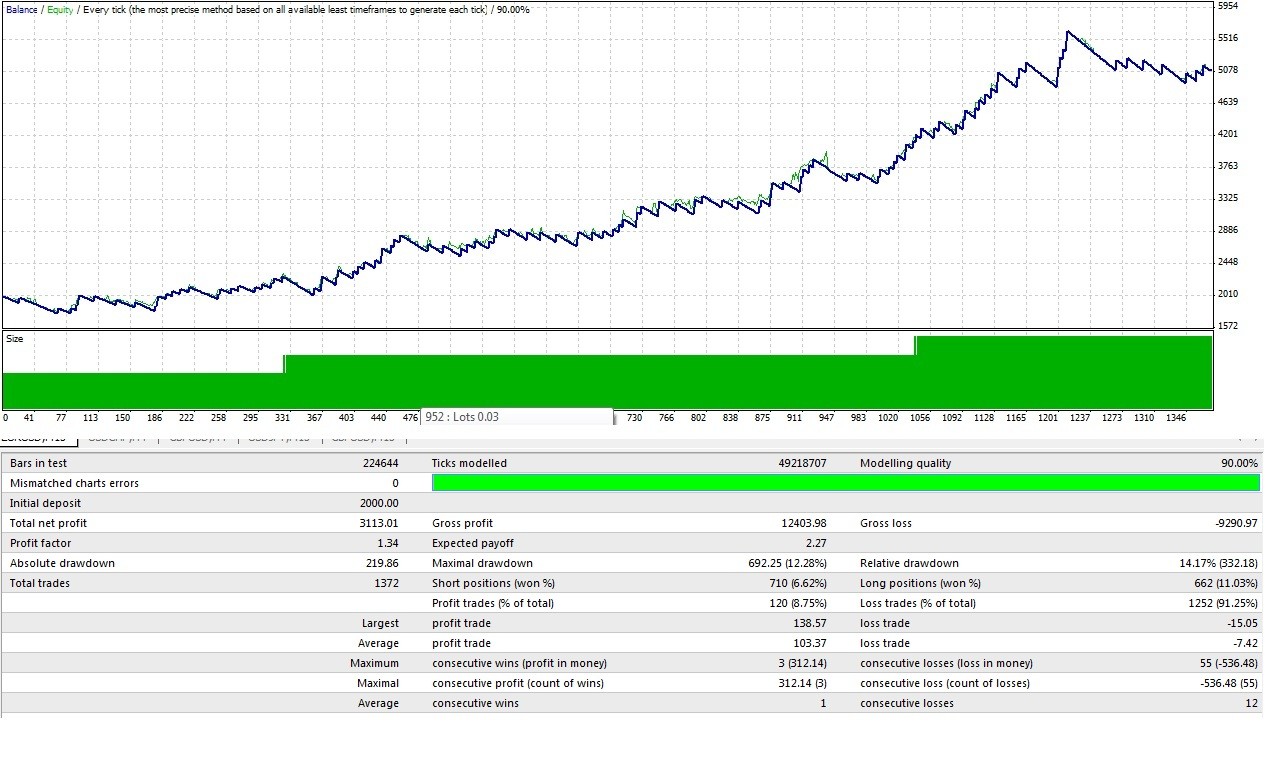
I find it hard to decide an optimal setting from the result of an optimization.
Could anyone please tell me which is the best to choose from an optimization result, the lowest drawdown, the profit factor or any other thing that I should consider?
Thanks!
The short answer is that NONE of those are any good. First, just think about "it"...it being the industry of investment, do you see ANY professional investment firm or fund manager that reports their track record in the terms you see in your optimization report? Some will report max drawdown, but no one talks profit factor or expected payoff or total profit. (I shouldn't say no one, mostly its just the scammers that do report these same types of numbers, the guys who want you to buy their book because "I turned $3000 into $30m in just 7 weeks!") So look around and then ask yourself "why don't the professionals use these?".
Second, there is a good reason none of these outputs are used, as reported they do not speak to the statistics involved (do you see any standard deviations?) and as such they cannot be used to generate any numbers that tell you anything about expected future performance.
For starters you need the standard deviation of the rates of return (be it daily, per trade, per week, etc) so you can computer your Sharpe Ratio and your Risk of Ruin. With those numbers you can begin to rank sort the performance of the test parameters in a manner that is more in lne with the rest of the industry as well as having an actual statistical footing when it comes to leveraging past results to speak to an expectation of future results.
Test the EA with the optimized parameters on another timepreriod (outside the period you have optimized).
Profit is not a good optimization paramter, profit factor and drawdown say more about a strategy..
my 2 cents.
Thanks, I'm working on the period filtering.
The short answer is that NONE of those are any good. First, just think about "it"...it being the industry of investment, do you see ANY professional investment firm or fund manager that reports their track record in the terms you see in your optimization report? Some will report max drawdown, but no one talks profit factor or expected payoff or total profit. (I shouldn't say no one, mostly its just the scammers that do report these same types of numbers, the guys who want you to buy their book because "I turned $3000 into $30m in just 7 weeks!") So look around and then ask yourself "why don't the professionals use these?".
Second, there is a good reason none of these outputs are used, as reported they do not speak to the statistics involved (do you see any standard deviations?) and as such they cannot be used to generate any numbers that tell you anything about expected future performance.
For starters you need the standard deviation of the rates of return (be it daily, per trade, per week, etc) so you can computer your Sharpe Ratio and your Risk of Ruin. With those numbers you can begin to rank sort the performance of the test parameters in a manner that is more in lne with the rest of the industry as well as having an actual statistical footing when it comes to leveraging past results to speak to an expectation of future results.
Wow, great! This is something new to me & I can't wait to step further. I also stumbled upon & downloaded your statistic analyser through searches from the "Sharpe Ratio" & "Risk of Ruin" that you mentioned.
Thank you so much, I'm going to learn a lot from this.
Thanks, I'm working on the period filtering.
Wow, great! This is something new to me & I can't wait to step further. I also stumbled upon & downloaded your static analyser through searches of "Sharpe Ratio" & "Risk of Ruin".
Thank you so much, I'm going to learn a lot from this.
errr... excuse me kind sir :)
how do you apply this static analyser on an EA ?? how do you even open it ? is there some istruction manual somewhere? ?
errr... excuse me kind sir :)
how do you apply this static analyser on an EA ?? how do you even open it ? is there some istruction manual somewhere? ?
It is intentionally NOT blackbox...if you can't comprehend what the code itself does, or the statistics themselves are aimed at accomplishing, then there really isn't any value for you to gain by using the codes.
Not trying to be a prick, just saying this is one of those circumstances where you need to go and fish for yourself and not merely be handed a fish. I've given you the fishing pole, the bait, and pointed you in the direction of the lake. I'm always interested in talking about the fish though, so if you catch something or have an interesting tale to regail me with after having used my fishing gear then I'd love to hear it and engage with you then. Until then, best of luck fishing :)
1005phillip:
It is intentionally NOT blackbox...if you can't comprehend what the code itself does, or the statistics themselves are aimed at accomplishing, then there really isn't any value for you to gain by using the codes.
Not trying to be a prick, just saying this is one of those circumstances where you need to go and fish for yourself and not merely be handed a fish. I've given you the fishing pole, the bait, and pointed you in the direction of the lake. I'm always interested in talking about the fish though, so if you catch something or have an interesting tale to regail me with after having used my fishing gear then I'd love to hear it and engage with you then. Until then, best of luck fishing :)
lol... loved the analogy
thanks
if i get some "gold" fish i'll definetly share with you
I defined a robot with a T.p of 350 pips
and a S.L of 20 pips
following the output above ^
with a constant risk of 0.5% per trade (20 pips = 0,5%)
does the calculation makes sense?
(rounded the presentage values for ease of calculation )
x P(x)
350 8%
-20 92%
E(x²)= 350² (0.08) - 20²(0.92) = 9432
E(x) = 350 (0.08) - 20(0.92) = 9.6
σ = sqrt ( E(x²) - (E(x))² ) = 96.64
E(x)% = 9.6/20 * 0.5% = 0.24% (= 0.0024)
σ% = 96.64/20 * 0.5% = 2.416% (=0.02416)
the chance of losing 50% :
R = e^[(-2a/d)*(ln(1-z)/ln(1-d))] = e^[-0.1986*(-0.6931/-0.0244)] = 3.5 * 10^-3 | where, a=0.0024 ; d=0.02416 ; z=0.5 ( 50%)
that means I have a 0.35% of being at 50% of my account balance
I'm trying to understand the origin of your x and P(x) numbers, I think maybe english is not your first language so I want to make sure we understand the meaning of the terms you are using before I make any conclusions or confusing statements.
"with a constant risk of 0.5% per trade"
What is 0.5% risk per trade? Does this mean you are risking 0.5% of the account balance in the event that the market moves against your position and the position is closed at the stoploss price?
"that means I have a 0.35% of being at 50% of my account balance"
Risk of ruin is a time-factor computation, meaning the units on the statement that you make with the numbers you compute is intended to be a "per trade" or "per week" or "per month".
At the moment I can't tell where x and P(x) come from but that determines the units involved here.
Help me understand what you did and I'll be more than happy to invest the time to determine if you are applying the calculations correctly.
// 0.5% risk per trade @ 20 pip SL
double maxRisk = 0.005 * AccountBalance(),
       spread  = Ask-Bid,
       risk    = 20 * pips2dbl + spread,
       minLot  = MarketInfo(Symbol(), MODE_MINLOT),
       lotStep = MarketInfo(Symbol(), MODE_LOTSTEP),
       perLotPerPoint  = PointValuePerLot(),
       maxLossPerLot   = (risk+Slippage.Pips*pips2dbl) * perLotPerPoint,
       size = maxRisk / maxLossPerLot;  // Must still round to lotStep.
       size = MathFloor(size/lotStep)*lotStep;
       at.risk.new = size * maxLossPerLot;                 // Export for Comment
       if (size < minLot){     /*at.risk.new=0;*/                  return(0); }
...
double  PointValuePerLot() { // Value in account currency of a Point of Symbol.
    /* In tester I had a sale: open=1.35883 close=1.35736 (0.00147)
     * gain$=97.32/6.62 lots/147 points=$0.10/point or $1.00/pip.
     * IBFX demo/mini       EURUSD TICKVALUE=0.1 MAXLOT=50 LOTSIZE=10,000
     * IBFX demo/standard   EURUSD TICKVALUE=1.0 MAXLOT=50 LOTSIZE=100,000
     *                                  $1.00/point or $10.00/pip.
     *
     * https://www.mql5.com/en/forum/127584 CB: MODE_TICKSIZE will usually return the
     * same value as MODE_POINT (or Point for the current symbol), however, an
     * example of where to use MODE_TICKSIZE would be as part of a ratio with
     * MODE_TICKVALUE when performing money management calculations which need
     * to take account of the pair and the account currency. The reason I use
     * this ratio is that although TV and TS may constantly be returned as
     * something like 7.00 and 0.00001 respectively, I've seen this
     * (intermittently) change to 14.00 and 0.00002 respectively (just example
     * tick values to illustrate). */
    return(  MarketInfo(Symbol(), MODE_TICKVALUE)
           / MarketInfo(Symbol(), MODE_TICKSIZE) ); // Not Point.
}
- Free trading apps
- Over 8,000 signals for copying
- Economic news for exploring financial markets
You agree to website policy and terms of use
I find it hard to decide an optimal setting from the result of an optimization.
Could anyone please tell me which is the best to choose from an optimization result, the lowest drawdown, the profit factor or any other thing that I should consider?
Thanks!