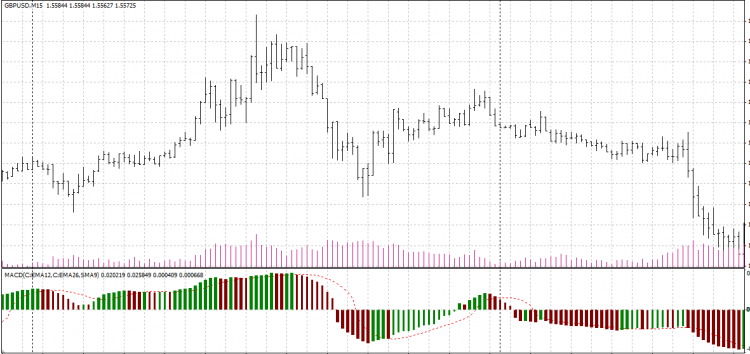
Use 3 buffers. If using histograms, it's easy. If using single line that changes colour, it's more complicated, and I suggest getting the histogram working first.
Here's one I prepared earlier. It draws different colours for rising & falling MACD, and different thicknesses depending on whether Signal line is shadowed or not.
The code will not compile 'as is' - ignore the Compression stuff (it just makes zero crossing easier to see) & other functions (not needed for actual working bits).
Also, for some reason, it sometimes used to ignore colours etc, so I 'fixed' it by redoing SetIndexStyle(..) first time in start(). If anyone can work out how to fix it, let me know!
Technically it's copyright (mine), but do with it what you will!
NB no guarantees that the code works, don't sue me if you lose a gazillion dollars, etc
Thanks your help but this is not what I'm looking for. I want to color of the MA line compare the price difference between the MAs.
Example: 17:05 the EMA(55) price is (EUR/JPY) 111.229
17:10 the EMA(55) price is (EUR/JPY) 111.229
17:15 the EMA(55) price is (EUR/JPY) 111.228
17:20 the EMA(55) price is (EUR/JPY) 111.229
X=0.00500
In this example the difference between the prices only 0.00000 or 0.00100 . I like to see the line WHITE because the difference between
-0.00500 and +0.00500
If the difference is greater than +0.00500 than i like to see the same line to change to LIME color and if less than -0.00500 than to RED
Thank you again
Zsolt
- Free trading apps
- Over 8,000 signals for copying
- Economic news for exploring financial markets
You agree to website policy and terms of use

Hello Every One...
I like to use a custom Moving Average Indicator.
x=0.00000 5 decimal places and adjustable
IF (Current MA Price - Previous MA Price) > x = (Lime) line
IF -x < (Current MA Price - Previous MA Price) < x = (White) line
IF (Current MA Price - Previous MA Price) < -x = (Red) line
Thanks all your help in advance and
HAPPY HOLIDAYS & HAPPY NEW YEAR!