Use labels instead of text obects for such things. Labels are positioned with screen coordinates relative to the corners of the window and are ideal for displaying UI elements like some general info or status of your EA while all other objects are anchored at a certain time and price and meant to mark things in the price chart itself.
But I want to know the maximum / minimum of the Y axis on the chart. Im just using an example of the drawing a line at the maximum to demonstrate that WindowsMaxPrice is not reliable.
Sometimes WindowsMaxPrice returns a value that is not the maximum on the chart. Can anyone help?
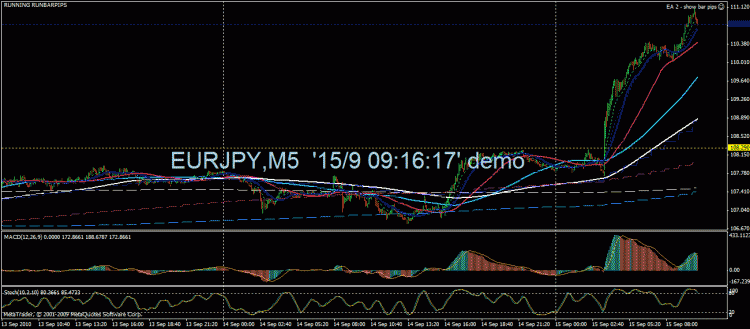
Heres what Im talking about. The yellow line is drawn by an EA at WindowsMaxPrice, so it should be at the top of the screen. But its not - as you can see, its drifted half way down the screen. I think the chart data is somehow becoming out of sync with the actual chart. Like I say, if I click on the chart to bring it into the foreground, the problem goes away.
I am calling RefreshData() in my EA, but that doesnt help..
Assumptions:
You are viewing one chart, the chart is "maximized" to fill the MT4 window.
Charts in the background can be any size until you click their tab and they are maximized for viewing.
So, the first visible bar can be different, as well as the max and min of the chart window.
Experiment:
Manually resize your charts so they fill the window, before maximizing for single chart viewing.
This doesn't fix anything, might be a workaround, or at least explain the mysterious "misplacement"
The charts are all maximized, even in the background.
Anyway, a related question - can anyone think of a way to calculate the max and min of the Y axis on a screenshot?
When you take a screenshot, you can specify the first visible bar, and the y axis is readjusted automatically. I presume this is done by finding the highest and lowest values for the n bars, then adding a bit of space at the top and bottom.
But does anyone know the formula?
What I am doing is taking screenshots from my EA and displaying them in a VB app Ive written. If I know the max and min of the y axis I can calculate the price of wherever my mouse cursor is in the VB app.
You can determine the number of bars in the chart and then use iHighest() iLowest() and friends to get the prices
I know, but the Y axis on a chart is more complicated than that. It adds space at the top and bottom. There must be some formula behind it.
- Free trading apps
- Over 8,000 signals for copying
- Economic news for exploring financial markets
You agree to website policy and terms of use

Does anyone have a problem with objects drifting on charts?
For example, I have an EA that draws a line and some text at the top of each chart using WindowsMaxPrice to find the maximum price (it deletes the old lines /text and creates new ones each tick). This normally appears at the top of the chart, as you might expect. But quite often it doesnt - after a while, it has drifted further down, or off the screen entirely.
What I find is if I click on this chart to make it the active / foreground chart, the problem goes away (sometimes I need to wait for next tick). So I think its something to do with it being in the background. I have the charts set to autoscroll. Ive not noticed any pattern in how this happens. It seems to happen about 30% of the time. Im using MT4 build 225.