USDJPY Technical Analysis 23.06 - 30.06 : Rally Finishing to Ranging
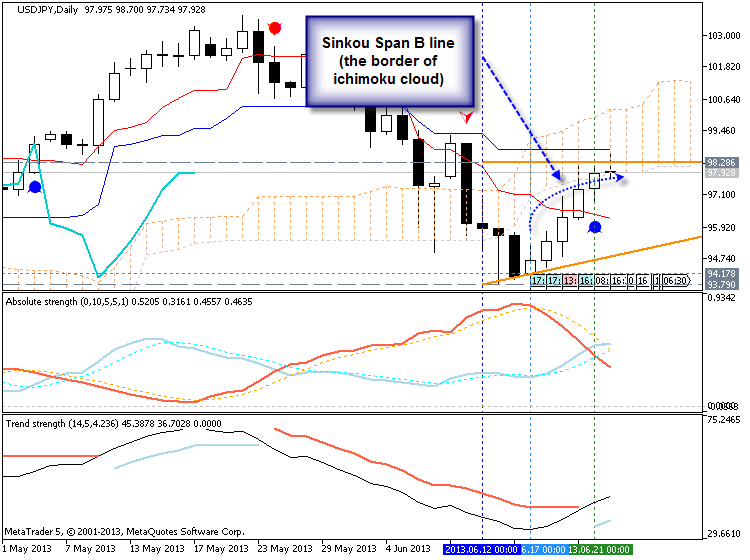
The price is slowly going along Sinkou Span B line which is the border of the cloud and the border between primary bullish and primary bearish:
Just a continuation of this post - just an example concerning "slowly movement in case of medium/high impacted news events" - we can see this chart - this is the movement during/after CSPI :

2013-06-25 12:30 GMT | [USD - Durable Goods Orders] - read this post for the explanation.
About USDJPY price - it was 30 pips in profit :
MetaTrader Trading Platform Screenshots
MetaQuotes Software Corp., MetaTrader 5, Demo
usdjpy durable

2013-06-25 12:30 GMT | [USD - Durable Goods Orders] - read this post for the explanation.
About USDJPY price - it was 30 pips in profit :
Is that a indicator?
Could you please tell me which indicator is that?
Just about GBP which we had at 12:30 GMT (or 14:30 MQ MT5 time) :
newdigital, 2013.06.26 14:51
U.S. GDP Grew Much Less Than Previously Estimated In Q1 :
6/26/2013 8:41 AM ETIn a major shock to economists, the Commerce Department released a report on Wednesday showing a substantial downward revision to the pace of U.S. economic growth in the first quarter of 2013.
The Commerce Department said its final reading on first quarter gross domestic product showed 1.8 percent growth, well below the previous estimate of a 2.4 percent increase.
The sharp downward revision to the pace of GDP growth came as a surprise to economists, who had expected the increase to be unrevised.
A notable downward revision to the increase in consumer spending contributed to the much weaker than previously estimated growth.
and we had good price movement of 37 pips :
MetaTrader Trading Platform Screenshots
MetaQuotes Software Corp., MetaTrader 5, Demo
usdjpy 37 pips

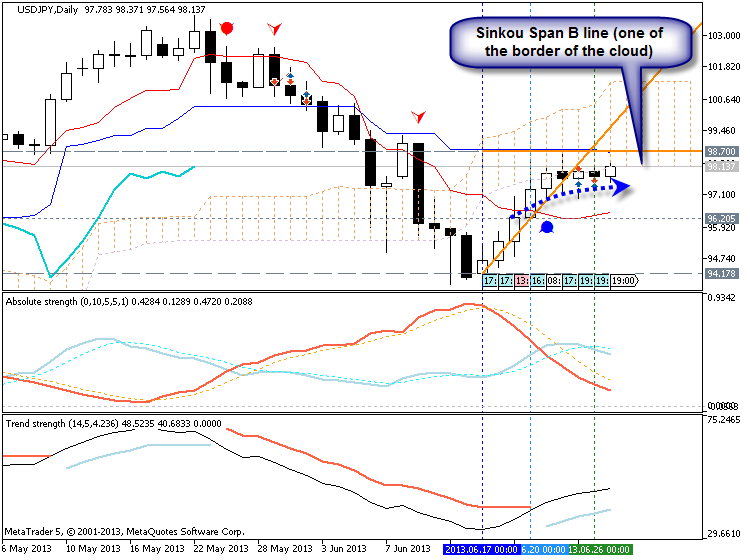
The price is continuing to go along to Sinkou Span B line (which is the border between primary bullish and primary bearish) :
Well ... what I am explaining here by text and charts - it is understandable for traders. But there are traders and coders on the forum. And I think we all know that they are using different "forex english" in some cases. So, I am just translating some terms/words I am using for technical Ichimoku analysis onto "coding english" language :) :
- Tenkan Sen - moving average of the highest high and lowest low over the last 9 trading days. (Highest high + Lowest low) / 2 over the last 9 trading days
- Kijun Sen - moving average of the highest high and lowest low over the last 26 trading days. (Highest high + Lowest low) / 2 over the last 26 trading days.
- Senkou Span A - the average of the Tenkan Sen and Kijun Sen, plotted 26 days ahead. (Tenkan Sen + Kijun Sen) / 2 plotted 26 days ahead
- Senkou Span B - the average of the highest high and lowest low over the last 52 days, plotted 26 days ahead. (Highest high + Lowest low) / 2 over the last 52 trading days plotted 26 days ahead.
- Chikou Span - the closing price plotted 26 days behind.
- Free trading apps
- Over 8,000 signals for copying
- Economic news for exploring financial markets
You agree to website policy and terms of use
The price on D1 was on Bear Market Rally and came very close to Sinkoy Span B Line trying to cross this level to be inside Ichimoku cloud. But there are few very strong resistance levels located directly inside the cloud on the way the price to go up: 98.28 and 98.99. Besides, Sinkou Span B line (97.88) is strong resistance level as well.
Thus, if the price will go to inside the cloud by breaking Sinkou Span B line so it may be ranging market condition. If the price will reverse back to primary bearish so we may have same trend with same direction which we had in the last week for example.
UPCOMING EVENTS (high/medium impacted news events which may be affected on USDJPY price movement for the next week)
2013-06-24 08:00 GMT | [EUR - IFO Business Climate]
2013-06-24 23:50 GMT | [JPY - Corporate Service Price Index (CSPI]
2013-06-25 12:30 GMT | [USD - Durable Goods Orders]
2013-06-25 14:00 GMT | [USD - Consumer Confidence]
2013-06-25 14:00 GMT | [USD - New Home Sales]
2013-06-26 12:30 GMT | [USD - Gross Domestic Product (GDP)]
2013-06-27 12:30 GMT | [USD - Core Personal Consumption Expenditure Price Index (Core PCE Price Index)]
2013-06-27 14:00 GMT | [USD - FOMC Member Speaks]
2013-06-27 23:30 GMT | [JPY - National CPI Core]
2013-06-27 23:50 GMT | [JPY - Retail Sales]
2013-06-28 12:00 GMT | [USD - FOMC Member Speaks]
2013-06-28 13:45 GMT | [USD - Chicago PMI Index]
2013-06-28 13:55 GMT | [USD - University of Michigan Consumer Confidence Index]
SUMMARY : rally finishing
TREND : ranging
Intraday Chart