- I Need help with MQL4 code
- Cycle indicators
- Trading System Development Process: I'm interested in your experiences
I think MetaTrader came up back in 2001 i.e. less than 10 years ago, so it will be kinda hard to find an EA that is that old at all. On the other hand I've recently coded an EA based on the original turtle rules (defined back in 1980s) and the account is still at profits after more than 3 months of trading now. So I should say that it is possible to create a system that works for 10 and more years and is profitable overall...
Another note I would like to make is that trading is much more than a single method, indicator or an EA. If you would like to be profitable in the long run you need to be adaptive. Markets are dynamic, they are changing all the time, so you probably would like to adjust/update your EA (or trading system) on regular basis in order to keep the performance and profitability up...
http://grid9.forexmosaic.com/ - 8621 pips in 7 weeks of grid trading
CB
You say "EA" but you really mean "trade strategy"...working EA's are plentiful, working EA's containing profitable trade and money management strategies are not so plentiful but they do exist.
I understand your frustration, been to that edge many times where you throw your hands up and just say "why is this not working!?"...backtesting shows great results but forward/live trading fails to live up to the hype.
Have you read the "My First Grail" article? https://www.mql5.com/en/articles/1413
Defining what "success" means when it comes to an EA is indeed a nebulous subject. Is success having a higher EP but a lower win rate? Is success having a positive ROR (while accepting a correspondingly large sigma)?
It is not really possible to predict the forex market, any more so than it is possible to predict the weather, but it is possible to forecast the forex market in very much a similar manner as modern day meteorologists forecasts tomorrow's weather.
You need a working model (the basis for cause and effect in your system) which takes measurable/observable inputs (price, momentum (rate of price change)) and outputs an expected response. Neural networks, etc.
We have all heard the cliche "past performance is not indicative of future results" but we endeavor with the belief that there are exceptions to this rule and that those exceptions can be discovered by us with just a little bit more elbow grease and savvy coding.
In time I have come to recognize that for many of my EA's the past performance was actually quite indicative of its (then) future results but that I had failed to recognize what, exactly, the past performance entailed/foretold.
It is too easy to get caught up in the sexy ROR and expected profit metrics when staring you right in the face is all the statistical info you need to crank thru a risk of ruin calc and come to the conclusion the past performance (including its sigma) most assuredly portends the account going broke with high probability in the future.
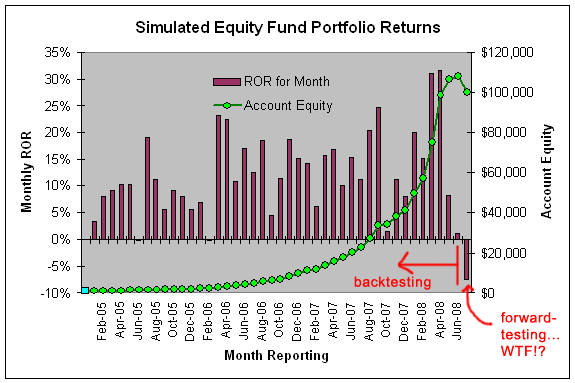
Here is an example of an EA that at first glance appeared to be ready to deliver some nice results based on >3yrs of backtesting:

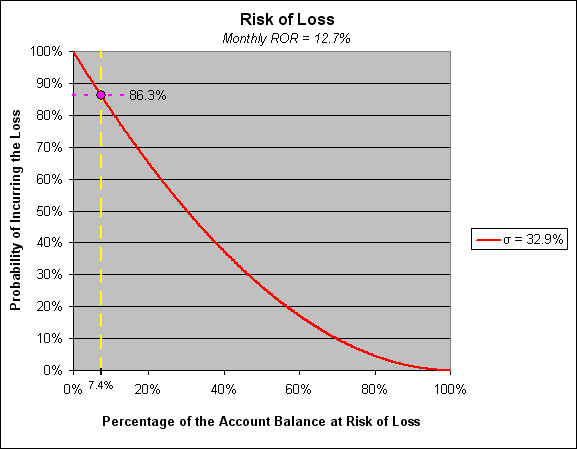
But that first month of live testing resulted in a net loss of ~7%. Initial conclusion was that backtesting didn't tell us crap, that past results didn't mean diddly to projecting future results. But that was an incorrect assessment of the past results. When crunching the past results through risk of ruin calcs we realized that the data was telling us we had an 86% chance of seeing a -7% monthly ROR at some point.

So in hindsight it was not really surprising that we in fact saw such losses, the standard deviation of our ROR results was so large that we had a 50% chance of losing 30% of the accounts equity despite having an average 12.7% monthly ROR spanning 3yrs.
So the moral of the story is that sometimes the past results are indicative of future results...you just need to get to know what those past results are really indicating!
Over the "long" term on average, there is a 50/50 chance of the price going up or down, so you have a 50/50 chance of getting it right.
The only thing against you is the spread -- all other factors can be utilized to work in your favor. So if you can get your EA up to 51/49 in your favor, you have a winner. In theory.
In theoretical terms, it should be possible to have a "working" EA.
Over the "long" term on average, there is a 50/50 chance of the price going up or down, so you have a 50/50 chance of getting it right.
The only thing against you is the spread -- all other factors can be utilized to work in your favor. So if you can get your EA up to 51/49 in your favor, you have a winner. In theory.
In theory there is no difference between theory and practice. But in practice there is. :)
In theory there is no difference between theory and practice. But in practice there is. :)
In theory, we know that theory is theory only, and does not account for all the things we will encounter in practice. But I know where you are going... :)
[...]
So the moral of the story is that sometimes the past results are indicative of future results...you just need to get to know what those past results are really indicating!
Phillip, I don't have much to say, except that it's an interesting and thought provoking post (especially your example). In fact I am still thinking about it. Thanks for sharing.
When crunching the past results through risk of ruin calcs we realized that the data was telling us we had an 86% chance of seeing a -7% monthly ROR at some point.
Out of interest, what's the time element in this? Does "at some point" mean that there's an 86% chance of it happening in a single month if you run the system for 1 year, or if you run it for 100 years?
The more typical interpretation of risk of ruin metrics is along the following lines (continuing the example I used above): this account will spend 86% of its time at least 7% below its max equity benchmark.
The max equity benchmark increases from time to time of course as profitable trades roll in, and the only time an account is NOT below its max equity benchmark is when the sum total of floating profits on existing open trades is above water AND the balance of the account is the max balance for the account. (this is universally true of all investment vehicles)
If you have not had a chance to read it yet I recommend checking out: https://www.mql5.com/go?link=http://www.futuresmag.com/Issues/2009/August2009/Pages/Minimizing-your-risk-of-ruin.aspx?page=1
So it is just a matter of coincidence as to whether an end-of-month event happens to coincide with a particular level of drawdown since the prior month's highwater mark was established. To assess the influence of artificial timing events (such as EOM and EOY ROR calcs) on a given trade strategy's ROR and ROL metrics you have to intentionally shift the timestamps - either those of the candles in the hst database or the timestamp you are using to define an EOM or EOY calendar event - and rerun the backtest generating the ROR and ROL metrics once again.
(for example when you calculate monthly ROR don't do it by the calendar month; rather, calculate your monthly ROR for the time frame spanning the 15th day of one month to the 15th day of the next month, then repeat say from the 5th to the 5th, etc...your resultant monthly ROR and standard deviation will vary naturally as you canvas more and more of that rarely investigated or analyzed monthly drawdown profile)
I don't claim it to be the best approach, or even a necessary approach, just something I have found I needed to do to better wrap my mind around what exactly the past results were indicating I should expect when it came to future results.
- Free trading apps
- Over 8,000 signals for copying
- Economic news for exploring financial markets
You agree to website policy and terms of use