Wavelet Based Indicators
Dear knuf,
I'm glad to meet a person with same interests :) I've started playing with wavelets too, but I did not bother with commercial soft - proceeded directly to Matlab :)
I did not get to realtime processing, just expirementing offline. What kind of troubles and in what cases do you expirience? I'm working with DWT (the "wavedec"/"waverec" routines), they seem to be working pretty fast. Afterall, if u get the model working, it is always possible to code in C++ :) there are a lot of opensource libraries on every case.
By the way, I would be glad if we discuss here some aspects of the apllication of waveletsto market analysis. I've got the following questions:
1. Wavelet approximation of Nth level seems to be a perfect substitution to the MA. It do not have a delay and follow the trend better. But what about side-effect? How to deal with it? What is the best method of padding? Maybe some allowance (some artificial delay) should be taken to eliminate side-effect?
2. What wavelet is suitable best for analysis of price data?
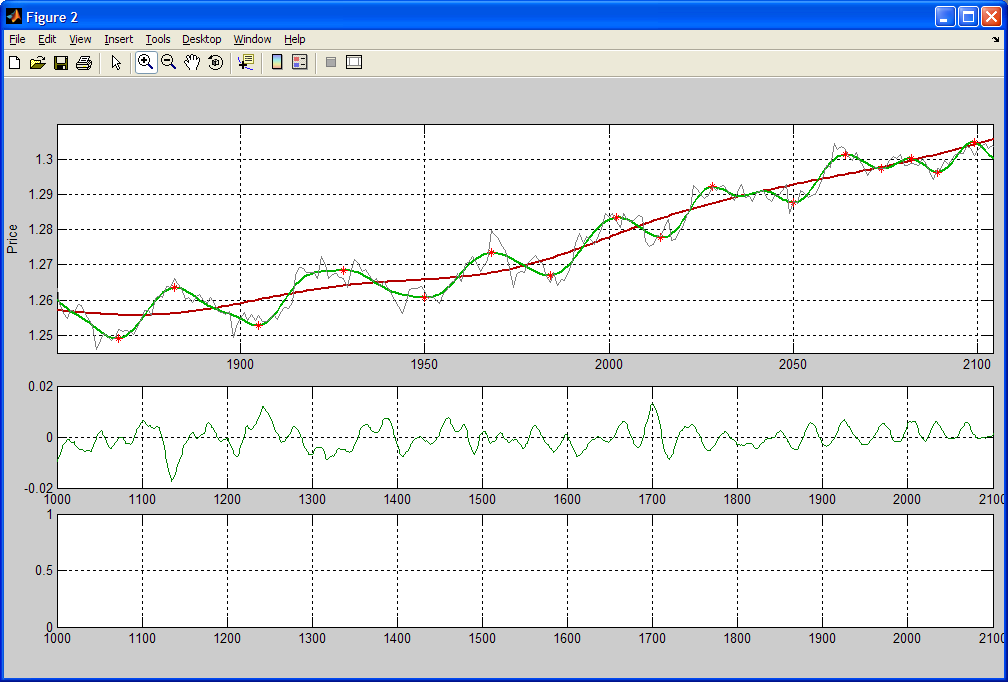
Currently, I'm using Meyer wavelet to smooth the graph. On the picture below
- the red line is the 5th level approximation
- the green line is the 3rd level approximation
- price is gray
It would be interesting to know how do u use wavelets.
ЗЫ а может ты и по-нашему понимаешь? :)
Hi timur,
it`s nice to see someone struggling with this also.. well, not just to see the struggle but the possible solutions, though :)
i`ve been out of this work for some time, so i`m writing to reply ASAP to keep this thread going, and would need some time to get into these things again, but i still do think it is worth of it.
As you noted also, biggest problem is boundary effects... well, i think the simple padding would not be enough to obtain reasonable results. i have still some scientific papers laying somewher and if i remember correctly, some keywords to this were:
extrapolation - this can be easily tested in matlab (not very good results)
construction of boundary wavelets - to be honest, i`m still a bit confused with this approach
tools : are you using only default matlab wavelet toolbox? `i`ve found great toolbox from professor Donoho&co. called wavelab802. It contains several algorithm marked as boundary-corrected (or sometginh like that), but i have not manage to get better results with them, however i think i was not using this tools correctly - this is for further study.
do you use decimated or un-decimated (shif invariant) version of transform, i think that decimated is ok if you focus on the inversely-transformed result after denoising for example, but not suitable for features extraxtion using NN . . .
to you 2nd question, i think i have some paper assessing different wavelets for financial time series, i`ll try to find it.
so i strongly recommend you to take a look at wavelab802, i`ll try to post some thoughts during the week, because as i said i mashed this up just as quickly as i could ...
ja ponimaju, nemnogo :)
Dear knuf,
it seems 2 me that simple "mirror" extrapolation ("Symmetrization") works quite good. In fact, boundary effect becomes noticeable only on a high-level wavelet coeffs. It fits my needs quite well.
Yes, I use just wavelet toolbox. I've downloaded wavelab recently, but didnt look at it. Did u get significantly better results with it?
I do not use non-decimated methods. I use wavelets for long- and short-term trend detection. In fact, all I need right now is just a preprocessing filter before some inference mechanism. I've decided to make a channel detection algorithm based on fuzzy logic.
This is how I'm trying to get it working:
s1 = std. deviation of the linear regression for last 3 max points
s2 = std. deviation of the linear regression for last 3 min points
k = coeff of parallelity between linear regression of the max and min points
Here is the fuzzy rule:
a = s1 is low and s2 is low and k is high
For example, here we have a=0,8
I dont know if this is really interesting, but I'll try to get it working :) What do u think of the idea?
Dear knuf,
it seems 2 me that simple "mirror" extrapolation ("Symmetrization") works quite good. In fact, boundary effect becomes noticeable only on a high-level wavelet coeffs. It fits my needs quite well.
I too am interested in wavelets, but don't have access to convenient software like mathlab. Can I ask how you obtained the curves shown above? How far did you slip the input between transforms? For compression purposes I guess you would slip the input window a full window size, but for real time signal filtering it seems that you can slip the input window only one sample at a time. Would this result in what is called 'repainting'?
The second question is whether the curves represent single-sample prediction, or filtering? By prediction I mean that you take the transform, throw away some coefficients, take the inverse transform, and extend one sample. It seems that mirror extrapolation would mess that up pretty badly. By filtering, you just don't do the extension.
Do I make sense?
MadCow,
the task i'm trying to solve right now is "channel" detection. That is, i'm trying to make an algorithm that would make an estimate of support and resistance levels based on recen toscillations of the price. So i did not get deep into extrapolation tecniques. The only thing i did was filtering with mirror-based extrapolation.
as for the second question - the curves presented are just filtering results.
I did not have time to continue my expirements for some weeks, but i hope i'll get back to it soon)
- Free trading apps
- Over 8,000 signals for copying
- Economic news for exploring financial markets
You agree to website policy and terms of use
Hello, after trying to discuss this at national forum without any success, i`m trying a luck at broader community...
I`m experimenting with a wavelet transform in MATLAB because of its well-known purposes - multiresolutional analysis, denoising, feature-extraction, signal pre-processing for NNs etc. I`m considering to use it as a base for improving basic indicators - reducing noise, replacement of MAs etc. The results using historical data are very nice, but the main issue i`m facing is the edge effects (boundary artifacts). This significantly decreases performance of the WT using real-time data (windowed - taking xxx past samples).
I wonder if some of you are using commercially available WT based indicators (T.S Research Group, Pilgrimm), what is your experience, do they also suffer from boundary artifacts?
Just to be more precise, the method i`m trying is redundant (non-deciamated), shift invariant transform. I`ve tried several toolboxes - matlab wavelet toolbox, Wavelab802 (donoho and co.), Pieflab, still without a much a success in real-time performance.
thx for the answers