 MetaTrader 5
 Experts
 Indicators
 Scripts
 Libraries
 Storage
Join our fan page

Spread Profile by Hour - indicator for MetaTrader 5

- Views:
- 24
- Published:
-
 You are missing trading opportunities:
- Free trading apps
- Over 8,000 signals for copying
- Economic news for exploring financial markets
Registration Log inYou agree to website policy and terms of use
If you do not have an account, please register -
 Need a robot or indicator based on this code? Order it on Freelance
Go to Freelance
Need a robot or indicator based on this code? Order it on Freelance
Go to Freelance
Spread Profile by Hour builds the real spread distribution for every server hour from your broker's own tick history and shows the median and the 90th percentile as 24 bars. Enter your typical stop size, and every bar tells you how much of 1R the spread takes in that hour, so the expensive hours of the day are visible at a glance.
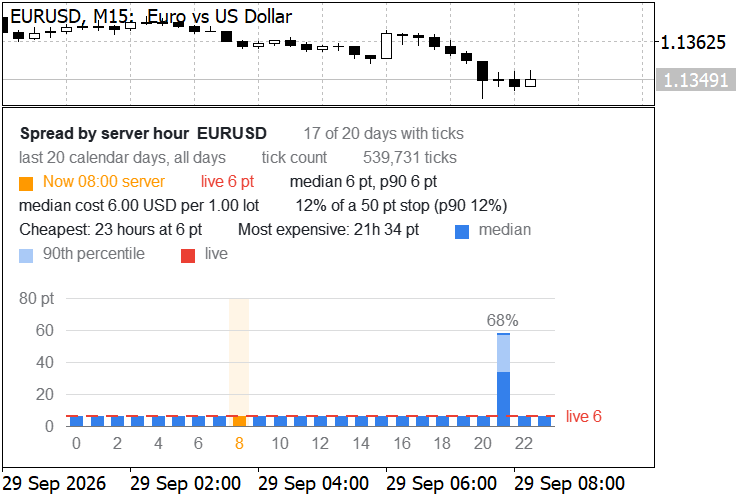
EURUSD, tick count, 50-point stop: 6 points (12% of the stop) most of the day, 34 points (68%) at the 21:00 rollover
The problem
For intraday and scalping systems the spread, not the entry signal, often decides whether an edge survives. The terminal shows the current spread, but not how the spread behaves over the day. A strategy tested on quiet hours can fail with the same rules at rollover, at the session open or around news, simply because the spread there is several times wider.
Bar history stores only one spread value per bar, which hides the distribution. This indicator reads the ticks themselves: every bid/ask quote of the last N days, grouped by the hour of the day in server time. The result is a per-hour median and 90th percentile that you can compare directly with your stop and your expected move.
Features
- Per-hour median, 90th percentile, mean and maximum spread in points, computed from CopyTicksRange over the last N calendar days. Today is excluded, so the picture does not shift during the session.
- Two sampling modes:
- Tick count: every quote counts once.
- Time-weighted: every quote counts for the time it stayed valid (until the next quote, at most 60 seconds). Tick counting over-represents fast markets, and fast markets often have the widest spreads. Time weighting answers the question "what spread would I have paid at a random moment of this hour".
- Weekday filter: all days, or Monday to Friday individually.
- Cost view: enter your stop size in points and every bar is labelled with the median spread as a percentage of that stop. The header shows the current hour's median and 90th percentile as a share of the stop.
- Median spread cost in account currency per 1.00 lot for the current hour, calculated from the symbol's tick value and tick size.
- Cheapest and most expensive hours by median, up to three each. Hours with the same median are listed together or summarized, for example "Cheapest: 23 hours at 6 pt", so equal values are never presented as a ranking. If every hour has the same median, the header says so.
- Current server hour highlighted, live spread drawn as a dashed line. When the window is too narrow for a label above every bar, the highest bar keeps its label.
- Optional CSV export of the per-hour statistics to MQL5\Files (UTF-8, opens directly in Excel).
- Loads one day of ticks per timer step and frees it straight away, so the chart stays responsive even with gold or crypto (100,000 and more ticks per day). Days that the terminal is still downloading are retried for a few seconds, and a day whose ticks do not cover its M1 bars is retried before it is used. For days older than the terminal's M1 history (Max bars in chart) completeness cannot be verified against bars; while the terminal is downloading, such a day is used only once its tick count stops changing.
- Reads the most recent days first. When three trading days in a row return no ticks (or three consecutive days of the chosen weekday), or ten in a row have neither ticks nor M1 bars (longer than any market holiday), those days are read a second time after a short pause, and if they still have no ticks the load stops; a gap in the broker's tick storage has the same effect. A symbol without any tick history shows a clear message within about 20 seconds, and a tick history shorter than the chosen depth is used up to its start. On the very first run over a long depth the terminal may still be downloading; if the load stops early, re-attach once the download has finished (the second run reads from disk). The Experts journal gets one summary line per calculation.
- Follows the chart: the background comes from the chart colour by default, text and grid colours adapt to dark or light backgrounds, and the layout scales with the screen DPI. Several copies can run on one chart.
- No trading functions, no DLLs, no external files needed.
Inputs
| Input | Default | Description |
|---|---|---|
| History depth, calendar days (today excluded) | 20 | Number of calendar days before today to read (1 to 365). Weekends count as days, so 20 calendar days give 14 to 17 trading days. |
| Sampling | Tick count | Tick count or time-weighted (see Features). |
| Weekday filter | All days | Restricts the profile to one weekday. Raise the history depth as well, since 20 calendar days contain only 2 or 3 of a given weekday. |
| Histogram range, points (wider spreads = overflow) | 5000 | Spreads wider than this go to an overflow bin. Statistics that fall into the overflow bin are shown as ">5000". |
| Minimum ticks for an hour to be shown | 100 | Hours with fewer ticks are shown as "-", for example the daily break. |
| Stop size, points (0 = off) | 0 | Your typical stop. 0 turns the percentage labels off and shows the median in points instead. |
| Window height at 100% scaling, px (0 = resizable) | 240 | Fixed height of the indicator window, scaled with the screen DPI. 0 lets you resize the window freely. |
| Background (None = chart background) | None | None uses the chart background. |
| Median bar | Blue | Colour of the median bar. |
| 90th percentile cap (None = lighter bar color) | None | None uses a lighter version of the bar colour. |
| Current hour | Orange | Highlight colour of the current server hour. |
| Live spread line | Red | Colour of the live spread line. |
| Text (None = automatic) | None | None picks a readable colour for a dark or light background. |
| Grid (None = automatic) | None | None picks a grid colour that matches the background. |
| Font size, pt | 9 | Base font size. |
| Save per-hour statistics to MQL5\Files (CSV) | false | Writes MQL5\Files\SpreadProfile_<symbol>_<yyyymmdd>.csv after each calculation. |
How to read it
Each bar is one hour of the day in server time. The solid part is the median spread: half of the quotes, or half of the time in time-weighted mode, had a spread at or below it. The lighter cap reaches the 90th percentile: one quote in ten was wider than that. The dashed line is the live spread, and the highlighted column is the current server hour. The examples below come from the screenshots, taken on a demo account over 20 calendar days (17 of them with ticks).
- EURUSD, tick count, 50-point stop: the median is 6 points in 23 of the 24 hours. At 21:00 server time, the daily rollover, it is 34 points with a 90th percentile of 58. The median spread takes 12% of 1R for most of the day and 68% in that hour.
- GBPUSD, time-weighted: 7 points in 23 hours, median 46 and 90th percentile 94 at 21:00. In tick-count mode the same hour reads 54 and 100, because the busiest quoting moments around the rollover also carry the widest spreads.
- XAUUSD, tick count, 1500-point stop: the median is 182 points (12% of the stop, 18.20 USD per lot) in every hour with data, so the header says so instead of ranking equal values. The daily break at 21:00 has no ticks and is shown as "-".
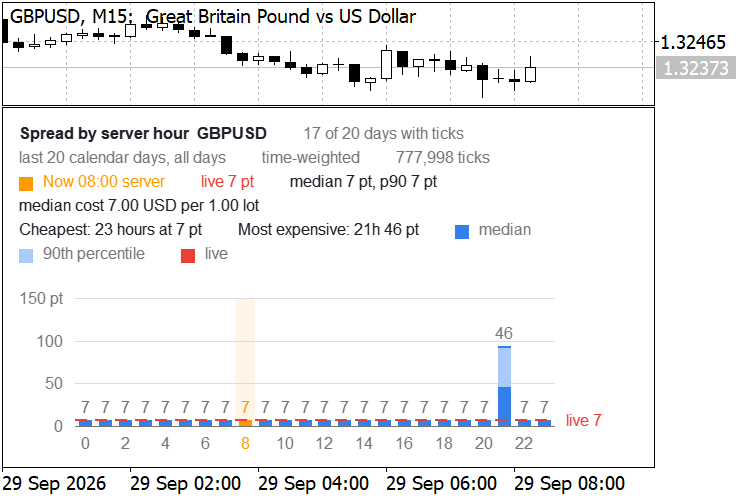
GBPUSD, time-weighted, no stop entered: 7 points in 23 hours, median 46 and 90th percentile 94 at 21:00
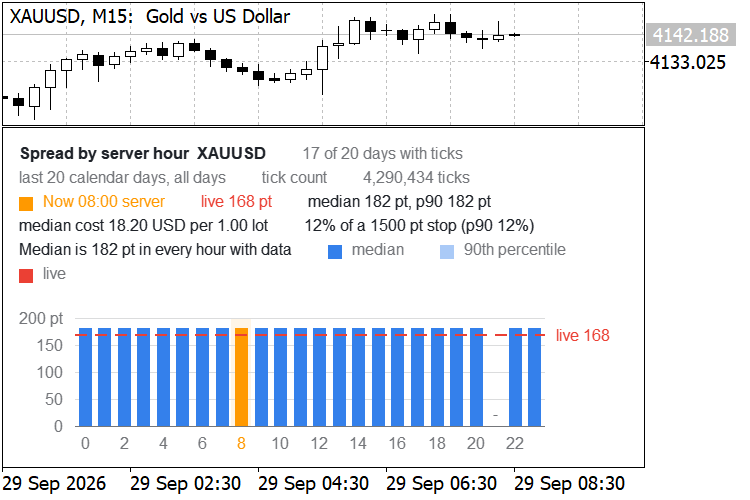
XAUUSD, tick count, 1500-point stop: 182 points in every hour with data, no ticks in the 21:00 daily break
A practical reading: if your system trades in an hour where the median spread is a large share of your stop, either skip that hour, widen the stop, or make sure the expected move pays for it. The 90th percentile tells you what a bad but not rare fill looks like.
Notes and limitations
- Tick history depth depends on your broker and on what the terminal has already downloaded. The first run over a long period can take a while, because the terminal downloads the ticks from the server. If the tick history ends before the chosen depth, the header shows "no ticks before" with the date of the oldest day used. On the test server, for example, tick history started on 1 January 2026, while M1 bars went back years.
- All hours are server hours. Depending on the broker's server time zone and daylight saving rules, an event such as the daily rollover can move by one server hour between summer and winter. A history window that spans such a switch shows the event split across two neighbouring hours.
- Demo and live accounts, and different account types (standard, raw, zero), can have very different spreads for the same symbol. Measure on the account you trade.
- Spread history does not guarantee future spreads. News, holidays and low-liquidity periods can produce spreads well above the 90th percentile shown here.
- The cost per lot uses the current tick value, which for cross pairs changes with the exchange rate.
- The profile is recalculated once per new server day, and whenever the inputs, the symbol or the timeframe change.
- On the test machine, 20 days of XAUUSD (4.3 million ticks) loaded in about 1 to 3 seconds, 90 days (19 million ticks) in about 8 seconds and 365 days of EURUSD (9.4 million ticks in 232 days with ticks) in about 30 seconds, including the second reading of the days before the start of the tick history, once the ticks were on disk. Your times depend on your broker's tick density and on whether the ticks are already on disk.
Symbol Spec Auditor
A chart panel that shows the contract specification details that decide position size and trading cost (point value, spread cost, margin, swap, execution rules) in the account currency, warns about broker settings that silently break lot-size code, and exports the audit of every Market Watch symbol to CSV.
Sensible Guide Confluence
H1 indicator that combines support/resistance confluence from H4, D1 and W1 with EMA trend alignment and candlestick confirmation. Shows non-repainting BUY/SELL arrows with ATR-based stop and reward/risk filtering.
Accelerator Oscillator (AC)
The Acceleration/Deceleration Indicator (AC) measures acceleration and deceleration of the current driving force.
MACD Signals
Indicator edition for new platform.