 MetaTrader 5
 Experts
 Indicators
 Scripts
 Libraries
 Storage
Join our fan page

Trade Excursion Report: MFE and MAE of every closed trade, to CSV - script for MetaTrader 5

- Views:
- 621
- Rating:
- Published:
- Updated:
-
 You are missing trading opportunities:
- Free trading apps
- Over 8,000 signals for copying
- Economic news for exploring financial markets
Registration Log inYou agree to website policy and terms of use
If you do not have an account, please register -
 Need a robot or indicator based on this code? Order it on Freelance
Go to Freelance
Need a robot or indicator based on this code? Order it on Freelance
Go to Freelance
What it writes
One line per closed position, grouped by DEAL_POSITION_ID (works on hedging and netting accounts; tested on a hedging demo). Columns: ticket, symbol, direction, entry time, exit time, entry price, exit price, profit points, MFE points, MAE points, capture ratio, bars spanned, holding time.
Inputs
- InpDias — how many days of history to read (365)
- InpSoEsteAtivo — only the chart symbol, or every symbol in history (false)
- InpTF — timeframe used to measure the excursions (current chart)
- InpArquivo — CSV file name in MQL5\Files
Summary printed to the Experts log
Trade count, won/lost, net result, median MFE and MAE of winners, median MAE of losers, median CAPTURE ratio, median bars per trade, the number of single-bar trades, and the number of trades that could not be measured because the terminal has no bars for that symbol any more (expired futures, for instance) — those are reported, not silently written as zero.
Measurement limit
Excursions are taken from the high and low of the bars each trade spanned on InpTF . The path inside a bar is unknown. If the bars column shows 1 for many trades, run it on a smaller timeframe.
Shares TradeExcursion.mqh with the Trade Excursion indicator; the include goes in MQL5\Include .
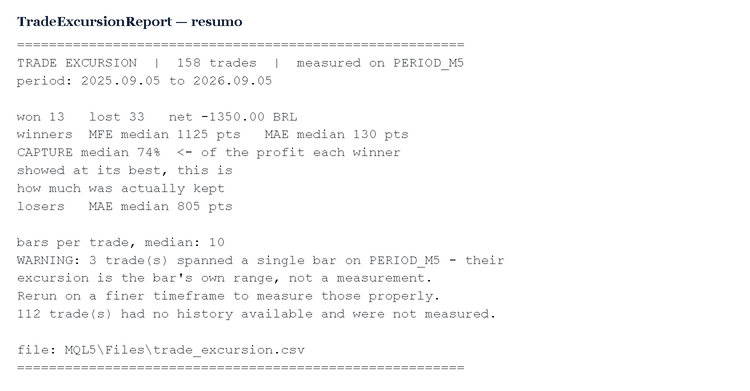
 Trade Excursion: how much of each winner you actually kept (MFE/MAE from your own history)
Your statement tells you what you KEPT. It does not tell you what you HAD. This indicator reads your own closed trades from the account history and draws, for each one, the full range it travelled: the best unrealised profit it ever showed (MFE) and the worst unrealised loss it survived (MAE). The gap between what a trade showed and what it paid is where two common problems hide, and neither is visible in a balance curve: winners closing far below their best point (the exit leaves money behind), and losers whose worst excursion barely passed the stop (the stop sits inside the noise). The number to look at is the CAPTURE RATIO: of the profit a winner showed at its best, how much did you take home? 90% says the exits are well placed; 30% says the market kept offering and the exit kept refusing. Limit, stated up front: excursions come from the bars each trade spanned, on the chart timeframe; the path inside a bar is unknown. Predicts nothing; measures trades that already happened.
 Decision Watchdog: refuse yesterday's decision, fail closed, log once
A daily process writes "today's decision" (which strategy runs, or FLAT) to a file the EAs read at the open. One day the writer did not run. The EAs read yesterday's file, compared its date with TimeCurrent() - the server clock, which had stepped back to the previous day overnight - saw a match, and traded all morning on a 24-hour-old decision. No error anywhere. Two rules, both in this class: 1) staleness is judged against TimeLocal(), which always moves forward; TimeCurrent() is the last tick's stamp - it freezes without ticks and can step back on reconnect. 2) When in doubt the answer is FLAT: missing file, bad date, wrong day, empty line - every failure path returns "do nothing", and each is logged ONCE per state change, not on every tick and not never. File format: line 1 = ISO date, line 2 = decision string. The demo writes a fresh, a stale, a malformed, an empty and a missing file, and shows that only the first is allowed to trade.
 SessionReopenEA
Gold has a daily maintenance break on the CME. The first hour after it rises more than chance explains, in every calendar year of an 11-year sample - while every other hour of the day measures flat. One trade per session, a volatility-scaled server-side stop, no averaging or grid. Then my cost model turned out to be wrong. A real-tick backtest showed the true round-trip cost at the reopen is about 60 points, not the 19 my research had charged - the M1 bar spread field is a per-bar summary and understates it roughly threefold. Re-running 11 years at the corrected cost: +3.34 bps, t 7.40, 59.3% wins -> +1.60 bps, t 3.42, 50.8% wins The edge survives, at less than half its original strength. That second number is the real one. What it is not: about +3.3% a year with 4.6% drawdown, roughly one year in nine negative. At 0.01 lots that is ~130 a year - a figure that measures the position size, not the strategy.
OHLC Reality Check - at what stop distance does your backtest start lying?
Opens a virtual bracketed trade on every M1 bar, walks it forward on the real tick history, and reports for a sweep of stop distances how often 1-minute OHLC modelling would score the trade the wrong way round.