Versus USD MT5
- Indikatoren
- Vonjinirina Alfred Randrianiaina
- Version: 1.10
- Aktualisiert: 5 Mai 2023
- Aktivierungen: 10
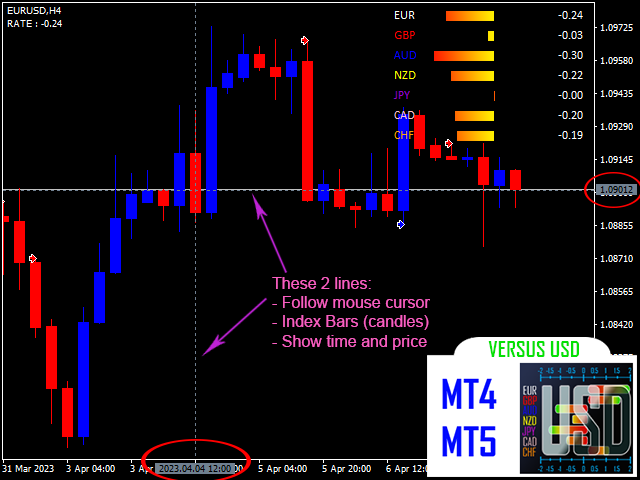
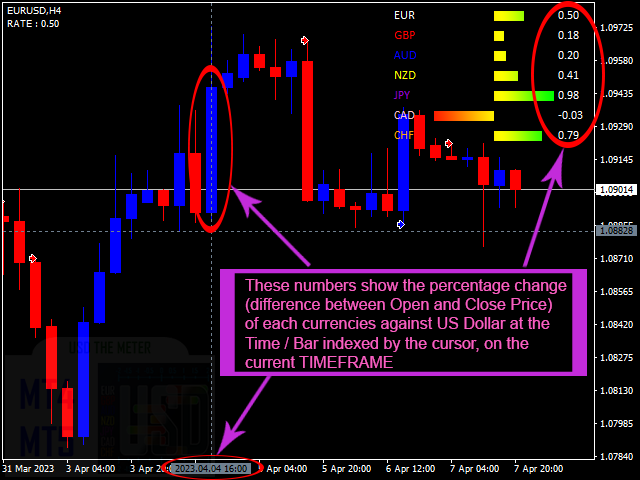
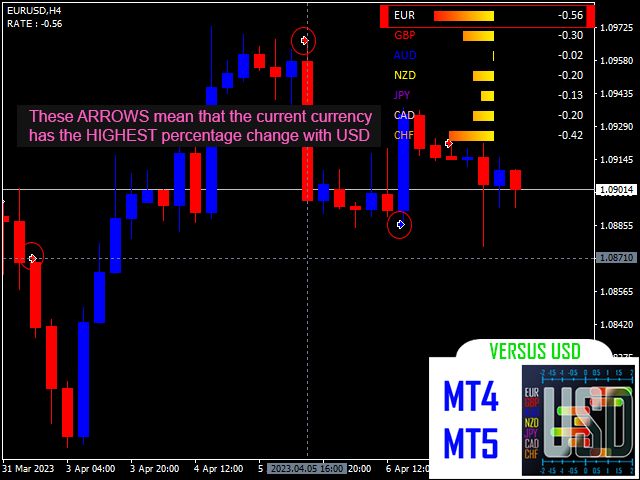
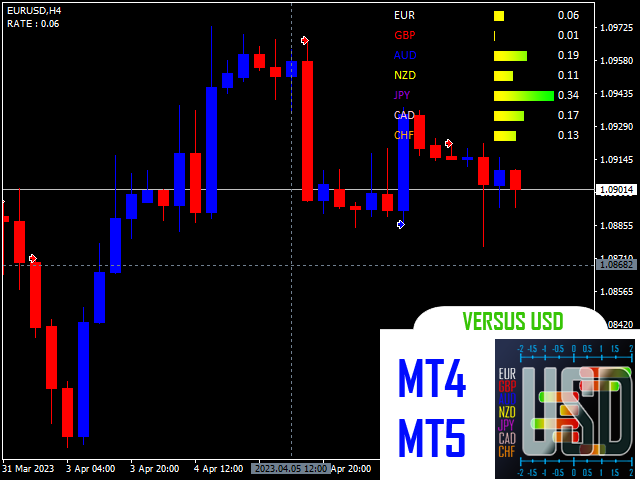
Versus USD berechnet die Preisänderung jeder wichtigen Währung gegenüber dem USD und zeigt eine klare und vergleichende Ansicht ihrer Leistung für jeden Zeitraum oder Balken, der durch den Cursor im aktuellen Zeitrahmen des Diagramms mit Fortschrittsbalken indiziert ist. Darüber hinaus markiert es einen Pfeil auf dem Balken/Zeitraum, in dem die betreffende Währung die höchste oder niedrigste Veränderungsrate gegenüber dem USD im Vergleich zu anderen Währungen erlebt hat, wodurch eine genauere Messung der Leistung der Währung bereitgestellt wird.
Der US-Dollar ist die primäre Währung, die zur Messung der Leistung jeder wichtigen Währung auf dem Devisenmarkt verwendet wird, da er die liquideste und am weitesten verbreitete Währung in internationalen Transaktionen ist. Darüber hinaus beinhalten die meisten Forex-Transaktionen den US-Dollar entweder als Basis- oder Notierungswährung, was es erleichtert, die Leistung anderer Währungen zu vergleichen und zu bewerten.
Unabhängig von Ihrem Erfahrungsstand im Devisenhandel und Ihrem Handelsstil, ob Sie bereits eine profitable Strategie haben oder nicht, kann dieser Indikator Ihre Fähigkeiten in kürzester Zeit verbessern. Außerdem ist er einfach zu bedienen, weil er folgende Funktionen hat:
- Kompatibel mit allen 28 wichtigen Währungspaaren
- Funktioniert mit allen Zeitrahmen (M1 - MN)
- Keine Notwendigkeit für Konfiguration, alles ist automatisiert
- Verfügbar auf MT4 und MT5
VORAUSSETZUNGEN:
1. Um den Indikator korrekt zu verwenden, müssen die historischen Daten der sieben wichtigsten Paare synchronisiert und aktualisiert werden, und es wird empfohlen, die Charts dieser Paare zu öffnen, auch wenn Sie den Indikator nicht bei einem von ihnen verwenden.
Diese 7 wichtigsten Paare sind:
- EURUSD
- GBPUSD
- AUDUSD
- NZDUSD
- USDJPY
- USDCAD
- USDCHF
2. Es ist entscheidend, dass die historischen Daten anderer Symbole, die mit dem Indikator verwendet werden, ebenfalls auf dem neuesten Stand und synchronisiert sind mit denen der sieben Hauptpaare.
EMPFEHLUNGEN:
- Ich empfehle Benutzern dringend, den Indikator mit Währungspaaren zu verwenden, die JPY enthalten, da er mit diesen Paaren viel zuverlässiger und genauer ist.
- Warten Sie, bis die historischen Daten für die 7 wichtigsten Währungspaare (mit USD) sowie das Paar, mit dem Sie den Indikator verwenden werden, auf dem neuesten Stand und synchronisiert sind, bevor Sie Versus USD zu Ihrem Chart hinzufügen, um potenzielle Fehler zu vermeiden.
- Wenn der Indikator einen Fehler feststellt, empfehle ich, zu einem anderen Timeframe zu wechseln und dann zum gewünschten Timeframe zurückzukehren.
Join the Versus USD chat if you have questions or reports or something else about the indicator.
Versus USD MT4 : https://www.mql5.com/fr/market/product/97127