AnalyzerTool
- Utilitys
- Facundo Laje
- Version: 1.2
- Aktualisiert: 25 April 2023
Do manual Technical Analysis in multiple Charts and receive Alerts when price touch Supports & Resistances Zones and Levels.
Manage all the Charts from an unique Dashboard Panel, using Key ShortCuts. Save Time do Money!
IMPORTANT:
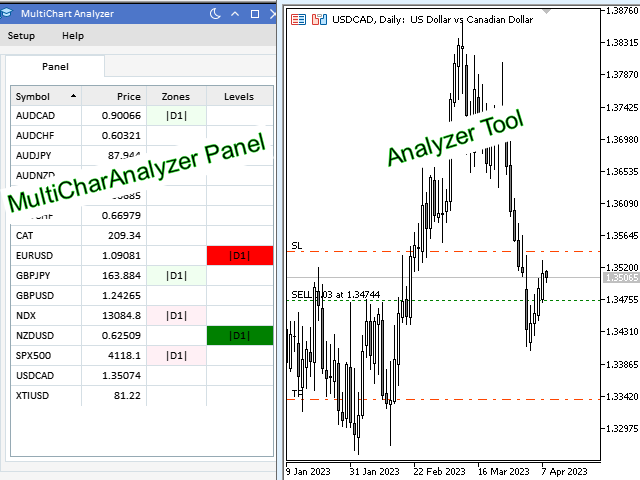
Multi Analyzer Panel EA works together with Analyzer Tool indicator.
Please you need to download both of them and install each one on different Charts
Find them on https://www.mql5.com/es/users/velasforexpips/seller
Please use them and give me feedback!! It really helps! Thank you very much!
Analyzer Tool indicator helps to do Manual Technical Analysis on the chart. It is possible to set Support&Resistance Zones and Level, very easy by using Key Shortcuts
You could also have two or three open charts with Analyzer indicator installed, so the Symbol and all Objects on these charts will be synchronize, but you could have different time frame on each other. This helps when you want to have a multi temporal over view before taking trading decisions
PROPERTIES OPTIONS
Key Setting: Is possible to configure the Keyboard key for the Short Cuts
Labels: Enable or disable Labels on Zones or Levels, and configure font size and color
Levels and Zones Parameters: Configure different properties like Height, Color, Fill or not Fill, Border, etc
Objects Time Frames: Enable or disabled higher time frames to be shown or not on lower ones.
SHORTCUTS
o key 1 and 2: Change Time Frames
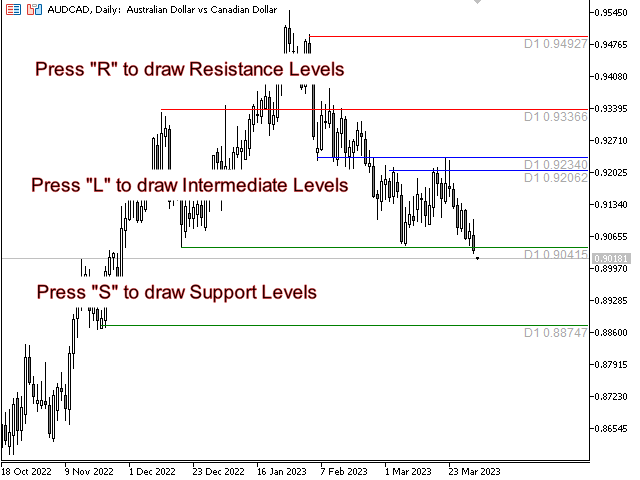
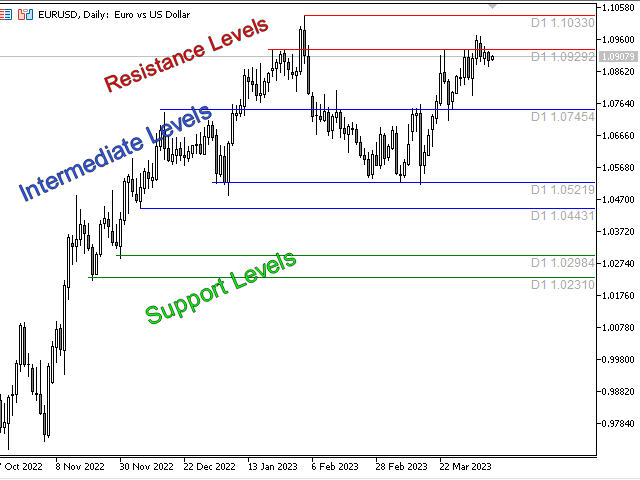
o Key R: Draw a Resistance Level
o Key S: Draw a Support Level
o Key L: Draw an Intermediate Level
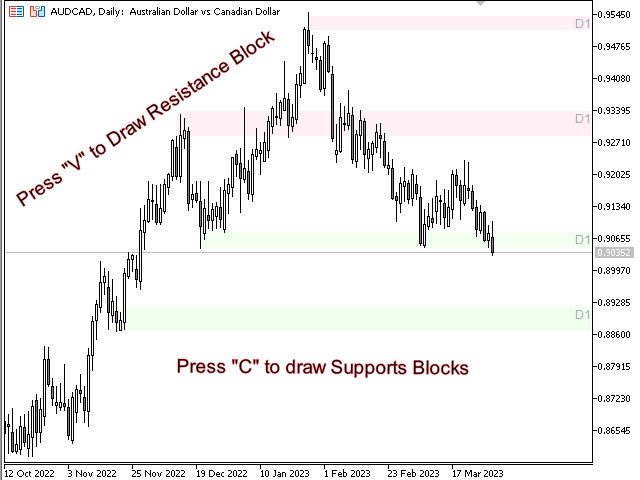
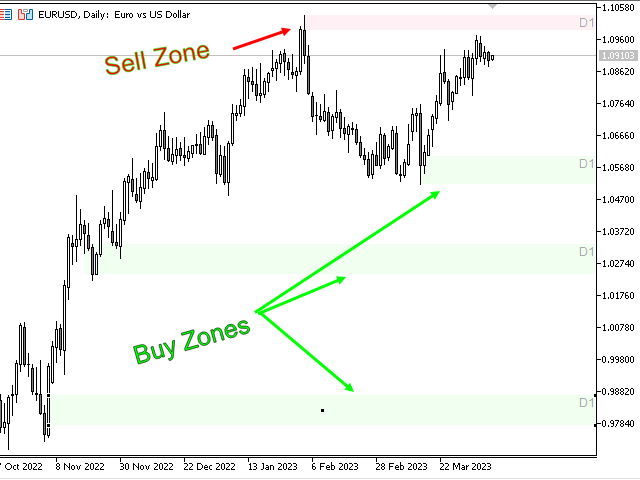
o Key C: Draw a Buy Block Zone
o Key V: Draw a Sell Block Zone
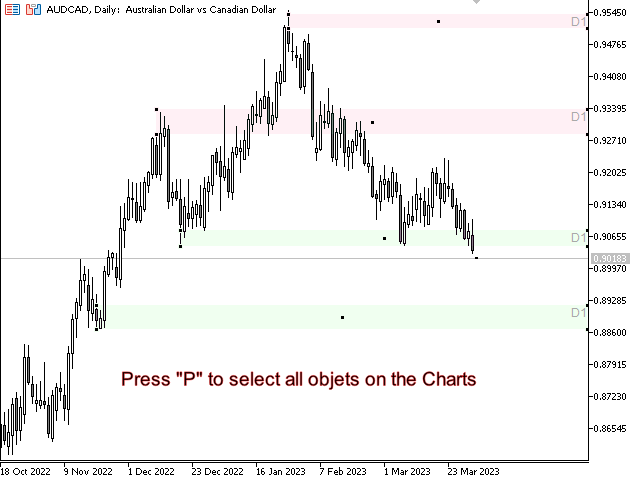
o Key P: Select or Deselect all drew Objects


I recommend to everyone. A very convenient utility. Some instruments may freeze and require reinstallation.