Draw Rectangle Time and Price Range for X days
- Indikatoren
- Tobiasz Andrzej Wlodarczyk
- Version: 1.2
- Aktualisiert: 22 April 2023
- Aktivierungen: 5
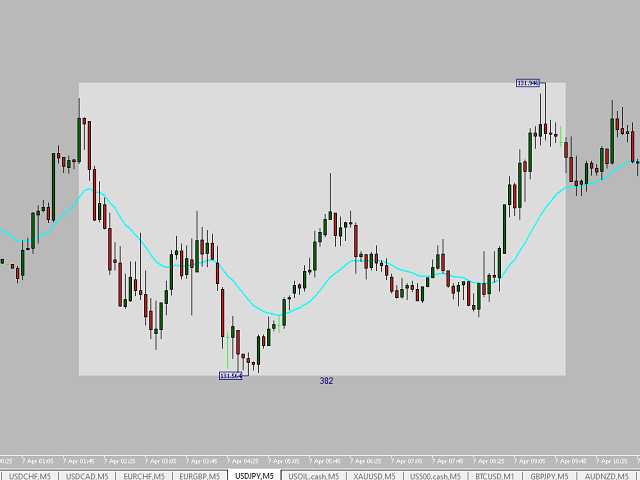
This useful tool helps to draw rectangle - range of price between two points of time for many days. For all trading instruments.
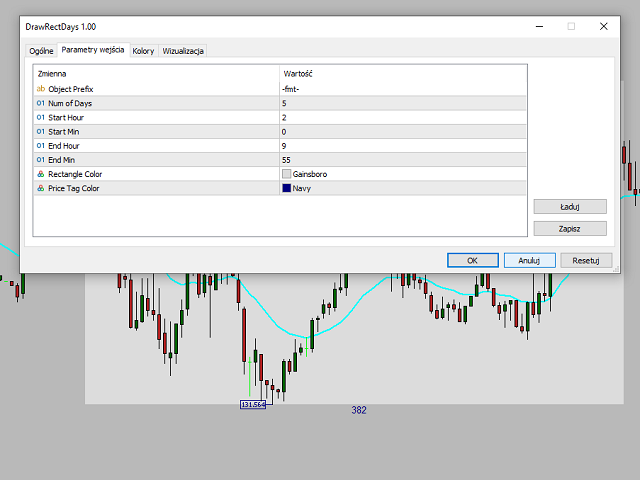
User set start time (Start Hour, Start Min), end time (End Hour, End Min) and number of days to draw a rectangle.
Indicator draw a rectangle marking highest and lowest price in set period of time.
Below the rectangle it shows range between MAXprice and MINprice in pp.
This tool is almost irreplaceable when you play strategy based on overnight price move (for example: false breakout strategy).
User can also modify color of the rectangle and price tag color.