• Übersicht
  • Bewertungen
  • Diskussion
  • Neue Funktionen

Volume Str

The Volume Str indicator is an indicator based on tick volumes.

The very name of the indicator "Volume Street" indicates the use and sorting of volumes.

according to a certain algorithm, which leads to a good result at the output.

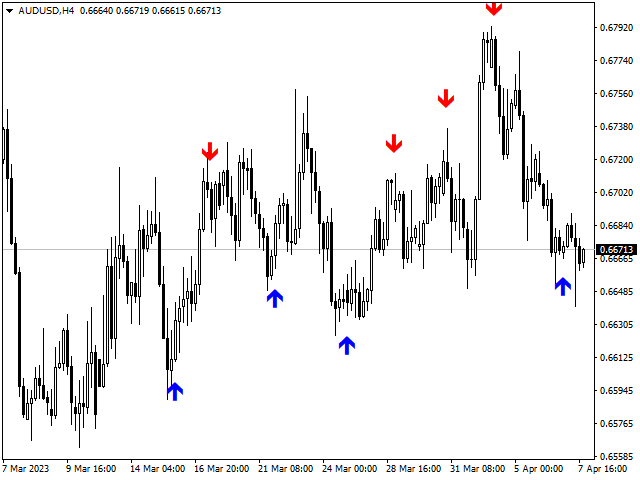
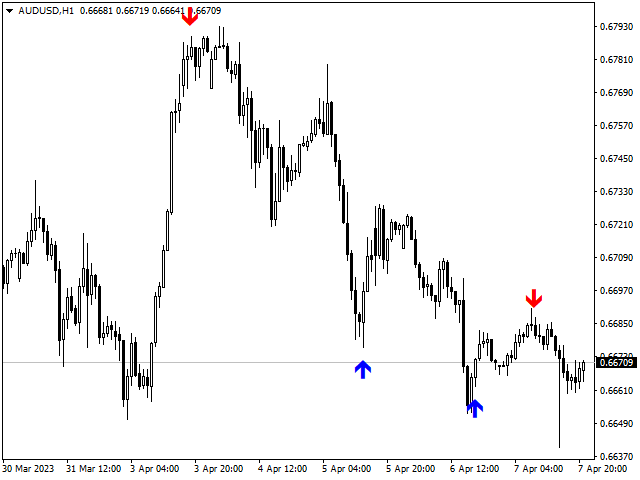
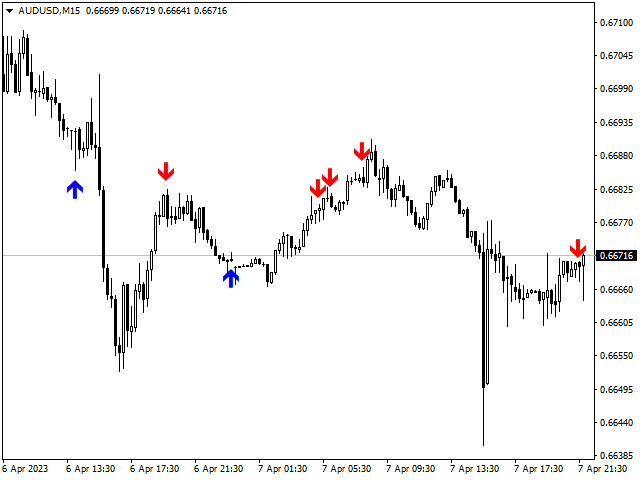
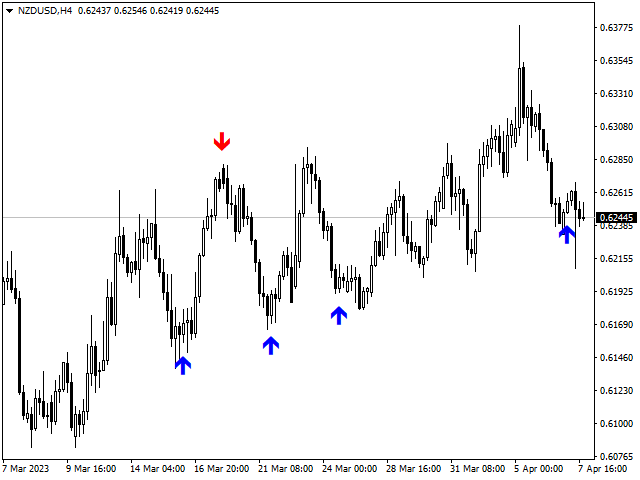
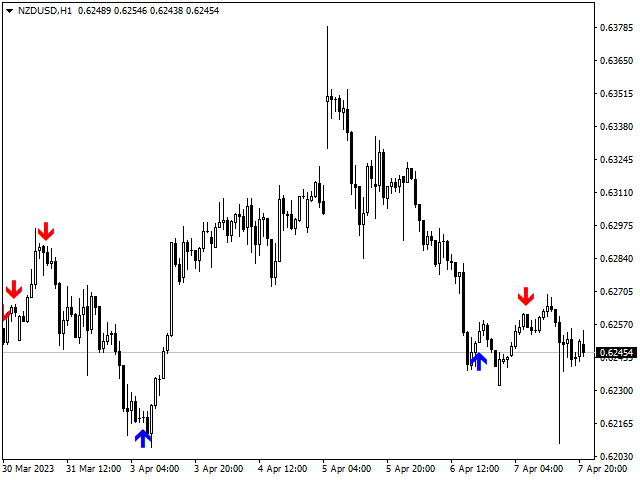
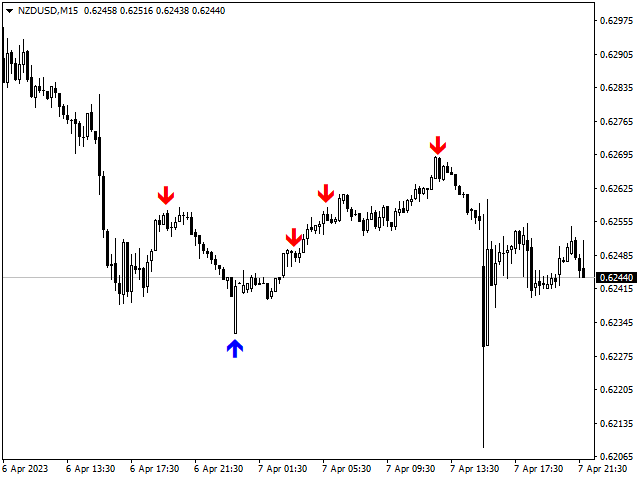
Look at the screenshots and you will see what signals it gives.

The indicator does not redraw and you can use its signals after the first bar closes.

Empfohlene Produkte
This indicator shows the high volume zone. From the last minutes that you set yourself, the image of the volume zone is generated on an ongoing basis. The indicator also shows the V-Poc, Average Volumen and V-WAP lines. if you are using high intervals you must enter a large number of minutes. the zone builds itself up as the chart moves. if you want to build a zone from:  last day - 1440 minutes,    last week - 10080 minutes, ... etc. If you need an indicator that shows the constant volume zone
Range Volume Profile
Oleksandr Martsynyshen
Range Volume Profile The indicator Range Volume Profile shows the distribution of transactions on the price scale in a given time range. This tool simplifies the analysis of the market situation and helps to find the price levels where a large player is sitting.   Features: shows the distribution of tick volumes relative to the price. shows the distribution of real volumes relative to the price. If your broker provides them. you can select the part of the chart that you want to explore. for cert
The Time Segmented Volume (TSV) is a technical indicator that measures the volume of a financial instrument within specific time segments. It helps traders identify buying and selling pressure based on volume analysis. The TSV indicator can be used as part of a trading strategy to generate trade signals and confirm market trends. Let's explore how to use the TSV indicator as a trading strategy. To begin, add the TSV indicator to your trading platform. The TSV is typically represented as a line o
IVolX 2 DPOC
Denis Chebatarev
Vol 2 DPOC volume vol 2 DOC-dynamic horizontal volume indicator for any time periods Main settings of the indicator: Volume Source -selecting data for volumes (tick or real) DPOCOn -enabling / disabling the indicator DPOCFrom -calculation start date DPOCTo -settlement end date The indicator allows you to manually select areas on the chart to analyze changes in the maximum volume over time. You can do this by using vertical lines and moving them along the chart. Or by setting specific dates
Quantum Swing
Yriy Doronin
4.75 (4)
Quantum Swing 1. What is Quantum Swing The indicator calculates and displays future price levels based on quantum mathematics with high accuracy of probability and direction. Levels are displayed in the form of zones for making trading decisions; they clearly define a narrow price range for placing orders with a minimum stop-loss and maximum take-profit. The indicator displays future trading zones on different timeframes H1, H4, D, W. Quantum oscillations are also displayed without reference to
FREE
'Zig Zag Percentage strenght'   This indicator is awesome. Why? It's able to show the percentage of the last leg, compared with the previous leg. In this way you have a better understanding of the forces in play in that moment.   In fact, for example, if you see that the up extensions are, in percentage, greater of the down legs, that means that there is more bullish pressure or maybe the market is starting to reverse from downtrend to uptrend.   Hope you will ind it useful !
Trend Zones
Augustine Kamatu
Introducing Trend Zones: Your Ultimate Tool for Precise Market Entry and Exit Points. Trend Zones is a revolutionary MetaTrader 4 indicator designed to provide traders with clear buy and sell zones based on trend reversals and price action. Built upon advanced algorithms and non-repainting technology, this indicator offers unparalleled accuracy in identifying optimal entry and exit points in the forex market. Key Features: 1. Non-Repainting Signals: Trend Zones delivers non-repainting signal
Horizontal volume bars, Cluster analysis, Volume profile Volume in Range gets information about the accumulated volume in a specified vertical range and period in bars. The received data is then plotted on the chart as rectangular boxes with the volume quantity inside. Usage:- The tool acts as a support resistance levels but most importantly it should be used to check in which direction the price breaks out of the significant levels formed by this indicator and then actions to be taken on correc
Colored Volume
Seyed Ali Tabatabaei Lotfi
The Colored Volume is a simple, yet useful indicator that paints the color of the volume based on the price direction.  If the price has increased, the volume will be shown in green. If the price has decreased, the volume will be shown in red. This indicator will make it super easy for traders to track volume bars based on price movements. (The settings of the volume bars including line width and color can be manually changed by the trader.)
UPD1 Volume Cluster
Vitaliy Kuznetsov
4.8 (15)
Der Algorithmus findet auf der Grundlage des Indikators UPD1 Trend Direction die Bereiche mit niedriger Volatilität und erstellt das maximale horizontale Volumen auf der Grundlage des Indikators UPD1 Volume Box . In der Regel tritt eine starke Trendbewegung auf, wenn Sie die Akkumulation verlassen. Wenn der Preis die Akkumulation verlassen hat, kann er sein maximales horizontales Volumen (POC) testen. Smart-Benachrichtigungen sind in den Einstellungen verfügbar. Eingangsparameter. Grundlege
FREE
volume MTF is the way to give you the Volume of currency and you will Know the trend and reflection when happen it used on scalping and entraday trading strategy with (M1....H4) Timeframe i always going take a look on higher timeframe then back to small timeframe and wait an indicator signals the setting of indicator i usually used the default just remove the arrows from setting  this indicator recommended for scalping 
Forex Indicator "HTF Envelopes" for MT4 Upgrade   your trading methods with the professional  HTF   Envelopes  for MT4. H TF means -   H igher Time Frame Envelopes    is one of the best trend indicator on the market - perfect tool for trading It is used to help traders to identify extreme overbought and oversold conditions as well as trading ranges. HTF   Envelopes indicator is excellent for   Multi-Time Frame trading systems   with Price Action entries or in combination with other indicators. I
CyberZingFx Trend Reversal
Afsal Meerankutty
4.26 (19)
Indicator captures the trend reversals with no-repaint Buy and Sell Arrow signals. CyberZingFx Trend Reversal Indicator - your go-to solution for accurate and reliable trend reversal signals. With its  advanced trading strategy , the indicator offers you Buy and Sell Arrow signals that do not repaint, making it a reliable tool for catching Swing Highs and Swing Lows in any market and any time frame. Indicator works on  any market  and  any time frames . __________________________________________
CloseBarInfo
Dmitrii Korchagin
Der Indikator zeigt die aktuelle Serverzeit und die Zeit an, bis der aktuelle Balken geschlossen ist. Die Informationen sind in den Momenten der Veröffentlichung von Nachrichten sehr nützlich, wenn Händler darauf warten, dass die Kerze geschlossen wird, um eine Handelssitzung zu beginnen. Sie können die Schriftgröße und -farbe an Ihre Grafikvorlage anpassen. Die Einstellungen: Text color - die Farbe des Anzeigetextes Text size - die Größe des Anzeigetextes Füge mich zu deinen Freunden hinzu,
FREE
InfoLot
Aleksandr Nadein
Индикатор помощник при торговле на валютных рынках.Работает на любых таймфреймах и любых валютных парах.Стоит его установить на любое открытое окно,чтобы получить текущую информацию по счету.Для более детальной информации нужно зайти в историю терминала и выбрать конкретный период торговли.Это может быть один день,последние три дня,неделя,месяц или вся торговля по данному счету.Индикатор учитывает все протаргованные сделки доступные в истории за выбранный период времени и по все торгуемым инстру
Trinitron
Oleksii Ferbei
Индикатор Trinitron создан для того чтобы отображать тренд в наглядном виде. Одним из главных определений для мониторинга рынка валют является тренд. Тренд - это устойчивое направление движения цены. Для его нахождения индикатор использет расчёты, призванные сглаживать резкие колебания, не влияющие на общую картину движения цены. Тренд может быть возрастающим (бычий тренд) и убывающий (медвежий тренд). В большинстве случаев тренд растёт долго и резко падает, но во всём бывают исключения. На д
SPV Corr
Yvan Musatov
The SPV Corr indicator displays the average percentage correlation between the bar's body and its shadows. A very effective system for building various filters and market entry confirmations. It fixes cyclicality and can be used in trading in different ways. You can see the ups and downs of the indicator alternate and have such a relationship with the market, which can be used to draw conclusions to predict price behavior. Also, indicators can be combined with each other. The value of the indica
Price Alert with Trendline
Rainer Albrecht
3.67 (3)
The indicator plays sound alerts when the price reaches certain levels, specified by trader. You only need to draw a trendline and then press the alert button in the panel. The texts of the notification you determine. Notification via a smartphone or email address is possible. Note for "Free Demo" : MetaTrader 4 does not support displaying an alert window or playing sounds in the strategy tester, only in live or demo accounts. How it works Draw a trendline Click the "Alert" button (Trendline
VWAP Indicator MT4
Kyra Nickaline Watson-gordon
5 (2)
Description : VWAP (Volume-Weighted Average Price) is the ratio of the value traded to total volume traded over a particular time horizon. It is a measure of the average price at which pair is traded over the trading horizon. Read More. All Symbols and All Timeframes are supported. Indicator Inputs :     VWAP Mode : Mode of VWAP Calculation. Options can be selected : Single,Session,Daily,Weekly,Monthly     Volumes : Real Volumes,Tick Volumes     Price Type : Used price for ca
Volume Champion ist ein Indikator, der das Volumen des Marktes analysiert und die Daten in Form eines Histogramms anzeigt. Sie müssen sich nicht in die Theorie der Marktanalyse vertiefen. Sie können einfach den Indikatorwerten folgen. Die Indikatorbalken zeigen die potenzielle Richtung der Preisbewegung basierend auf der Analyse der Marktvolumenstruktur. Dieser Indikator ist für die Verwendung in höheren Zeitrahmen wie H4, D1, W1 konzipiert. SIGNALE WERDEN NICHT BEREITGESTELLT! Technisch gesehen
Weis Wave Indicator
Dhabaleswar Prasad Jena
This indicator is based on the Weis wave principle of wave volume. Below are few features of the indicator It draws the wave on the chart while the accumulated volume per wave in a different window at the bottom of the chart You can configure the turning point move It displays the accumulated volume (in thousands, eg for 15000 volume it will show 15) at the end of each wave You can also configure to show number of candles in the wave along with the wave volume The indicator calculates the distin
Mit diesem Handelstool können Sie 15 Märkte gleichzeitig scannen. Einführung eines neuen Handelsindikators 2024: ️ Dashboard Multi-Währung Multi-Time-Frame Stochastic. Es gibt mindestens zwei Gründe, warum ich dieses Handelstool entwickelt habe: Erstens ist es mir langweilig, nur einen Markt zu beobachten. Zweitens möchte ich den Einstieg in einen anderen Markt nicht verpassen. Deshalb möchte ich gleichzeitig auch andere Marktbedingungen kennen. Aus diesem Grund benötige ich einen
Добрый всем ДЕНЬ, вечер, утро. Я, трейдер(частный), Вадим Сергеевич Лепехо, 20 лет опыта. Предлагаю Вам очередной продукт. Построен на базе индикатора arrows_template.Индикатор не затейливый. Вообщем прост в понимании.  Видите квадраты синего цвета: High & Low. Ждите куда цена пробьет, после пробития дожидаемся появления  зоны: боковик, флэта, консолидации, замедления, накопления. Выставляем отложенный ордер от High или Low смотря куда был пробой: вверх или вниз. Цена приблизительно почти доходи
Super volumes
Yerzhan Satov
4 (1)
Der Pfeilindikator für Forex und Binäre Optionen basiert auf Tick-Volumina. Im Gegensatz zu vielen Volumenindikatoren berechnet der Indikator "Super volumes" bullische und bärische Volumina und gibt Signale für die Vorherrschaft von irgendwelchen von ihnen aus. Wenn wir zu diesem Zeitpunkt sagen, dass es in diesem Bereich einen Vorteil von bullischen Volumina gab, bedeutet dies, dass das Signal auf Buy liegt. Oder wenn das Vorherrschen bärische Volumina war, wird das Signal dementsprechend auf
The indicator allows you to trade binary options. The recommended time frame is М1 and the expiration time is 1,2,3 minutes. The indicator suitable for auto and manual trading. A possible signal is specified as a arrows above/under a candle. You should wait until the candle closes! Arrows are not re-painted Trade sessions: TOKYO section (Half-end) Currency pairs: USD/JPY Working time frame: M1 Expiration time: 1,2,3 minutes. The indicator also shows good results when using the martingale strateg
FREE
Pro Trader mt4
Natasha Diedericks
This indicator takes input from the RSI and a trend filter, and presents the output in a separate indicator window as a histogram. Great for scalping. Settings: No need to set up the indicator. Features Alerts. How to use: Simply attach to any chart Zoom chart in to get a better view of the histo color. Buy:  Blue histo color on multiple timeframes. (e.g,. M30-H1-H4) Sell: Red histo color  across on multiple timeframes. Or backtest and use as you see fit for your strategy. Best results on Majo
Bei der Analyse finanzieller Zeitreihen gehen Forscher meist davon aus, dass die Preise nach dem normalen (Gaußschen) Gesetz verteilt werden. Dieser Ansatz beruht auf der Tatsache, dass eine große Anzahl realer Prozesse unter Verwendung der Normalverteilung simuliert werden kann. Darüber hinaus bereitet die Berechnung der Parameter dieser Verteilung keine großen Schwierigkeiten. Auf den Finanzmärkten funktioniert die Normalverteilung jedoch nicht immer. Die Renditen von Finanzinstrumenten haben
Title: RapidNews Trader – High Frequency Trading Price will change soon ! RapidNews Trader's unique strategy revolves around swift analysis of market sentiment shifts during major economic announcements. By leveraging sophisticated algorithms and real-time data feeds, this Expert Advisor identifies potential market opportunities milliseconds after news breaks. The result? A remarkable ability to enter and exit trades with precision, maximizing profit potential. Key Features: High-Frequency Tradi
"Adjustable Fractals" - is an advanced version of fractal indicator, very useful trading tool! As we know   Standard fractals mt4 indicator does not have settings at all   - this is very inconvenient for traders Adjustable Fractals has resolved that issue - it has all necessary settings: Adjustable period   of indicator (recommended values - above 7) Adjustable distance   from Highs/Lows of price Adjustable design   af fractal arrows // More great Expert Advisors and Indicators are available he
Käufer dieses Produkts erwarben auch
Gann Made Easy
Oleg Rodin
4.93 (57)
Gann Made Easy ist ein professionelles und einfach zu bedienendes Forex-Handelssystem, das auf den besten Handelsprinzipien unter Verwendung der Theorie von Mr. basiert. W.D. Gann. Der Indikator liefert genaue KAUF- und VERKAUFSsignale, einschließlich Stop-Loss- und Take-Profit-Levels. Mit PUSH-Benachrichtigungen können Sie auch unterwegs handeln. Bitte kontaktieren Sie mich nach dem Kauf! Ich werde meine Handelstipps und tolle Bonusindikatoren kostenlos mit Ihnen teilen! Wahrscheinlich haben Si
Entdecken Sie das Geheimnis des erfolgreichen Forex -Handels mit unserem benutzerdefinierten MT4 -Indikator! Haben Sie sich jemals gefragt, wie Sie Erfolg auf dem Forex -Markt erzielen können und gleichzeitig Gewinne erzielen und gleichzeitig das Risiko minimieren können? Hier ist die Antwort, nach der Sie gesucht haben! Erlauben Sie uns, unseren proprietären MT4 -Indikator vorzustellen, der Ihren Handelsansatz revolutionieren wird. Einzigartige Vielseitigkeit Unser Indikator ist speziell
Atomic Analyst
Issam Kassas
5 (3)
Zunächst einmal ist es erwähnenswert, dass dieser Handelsindikator nicht neu malt, nicht neu zeichnet und keine Verzögerung aufweist, was ihn sowohl für manuellen als auch für Roboterhandel ideal macht. Benutzerhandbuch: Einstellungen, Eingaben und Strategie. Der Atom-Analyst ist ein PA-Preisaktionsindikator, der die Stärke und das Momentum des Preises nutzt, um einen besseren Vorteil auf dem Markt zu finden. Ausgestattet mit fortschrittlichen Filtern, die helfen, Rauschen und falsche Signale z
DERZEIT 26% RABATT Die beste Lösung für jeden Newbie oder Expert Trader! Dieser Indikator ist ein einzigartiges, qualitativ hochwertiges und erschwingliches Trading-Tool, da wir eine Reihe von proprietären Funktionen und eine neue Formel integriert haben. Mit nur EINEM Chart können Sie die Währungsstärke für 28 Forex-Paare ablesen! Stellen Sie sich vor, wie sich Ihr Handel verbessern wird, weil Sie in der Lage sind, den genauen Auslösungspunkt eines neuen Trends oder einer Scalping-Gelegenh
Zunächst einmal ist es wichtig zu betonen, dass dieses Handelstool ein Nicht-Repaint-, Nicht-Redraw- und Nicht-Verzögerungsindikator ist, was es ideal für professionelles Trading macht. Online-Kurs, Benutzerhandbuch und Demo. Der Smart Price Action Concepts Indikator ist ein sehr leistungsstarkes Werkzeug sowohl für neue als auch erfahrene Händler. Er vereint mehr als 20 nützliche Indikatoren in einem und kombiniert fortgeschrittene Handelsideen wie die Analyse des Inner Circle Traders und Stra
TPSpro RFI Levels
Roman Podpora
5 (13)
A key element in trading is zones or levels from which decisions to buy or sell a trading instrument are made. Despite attempts by major players to conceal their presence in the market, they inevitably leave traces. Our task was to learn how to identify these traces and interpret them correctly. Reversal First Impulse levels (RFI)   -  Version MT5                INSTRUCTIONS                 RUS                 ENG                                       R ecommended to use with an indicator   -  
Natürlich, hier ist die Übersetzung in Deutsch: Vorstellung des Astronomie-Indikators für MT4: Dein ultimativer himmlischer Trading-Begleiter Bist du bereit, deine Trading-Erfahrung auf himmlische Höhen zu heben? Suche nicht weiter als unseren revolutionären Astronomie-Indikator für MT4. Dieses innovative Tool übertrifft herkömmliche Trading-Indikatoren und nutzt komplexe Algorithmen, um dir unvergleichliche astronomische Einblicke und präzise Berechnungen zu bieten. Ein Universum an Information
Trend Screener
STE S.S.COMPANY
4.83 (86)
Trendindikator, bahnbrechende, einzigartige Lösung für Trendhandel und -filterung mit allen wichtigen Trendfunktionen in einem Tool! Es handelt sich um einen 100 % nicht neu zu malenden Multi-Timeframe- und Multi-Währungs-Indikator, der für alle Symbole/Instrumente verwendet werden kann: Forex, Rohstoffe, Kryptowährungen, Indizes und Aktien. Trend Screener ist ein effizienter Trendfolgeindikator, der Pfeiltrendsignale mit Punkten im Diagramm liefert. Die Funktionen, die im Trendanalysator-Indika
Wir stellen vor       Quantum Trend Sniper Indicator   , der bahnbrechende MQL5-Indikator, der die Art und Weise, wie Sie Trendumkehrungen erkennen und handeln, verändert! Entwickelt von einem Team erfahrener Händler mit über 13 Jahren Handelserfahrung,       Quantum Trend Sniper-Indikator       wurde entwickelt, um Ihre Trading-Reise mit seiner innovativen Methode zur Identifizierung von Trendumkehrungen mit extrem hoher Genauigkeit auf ein neues Niveau zu heben. ***Kaufe Quantum Trend Snipe
TPSproTREND PrO
Roman Podpora
5 (15)
TPSpro TRENDPRO  - is a trend indicator that automatically analyzes the market and provides information about the trend and each of its changes, as well as giving signals for entering trades without redrawing! The indicator uses each candle, analyzing them separately. referring to different impulses - up or down impulse. Exact entry points into transactions for currencies, crypto, metals, stocks, indices!  -  Version MT5               DETAILED DESCRIPTION        /       TRADING SETUPS           
Derzeit 20% Rabatt! Die beste Lösung für jeden Neueinsteiger oder Expert Händler! Dieses Dashboard arbeitet mit 28 Währungspaaren. Es basiert auf 2 unserer Hauptindikatoren (Advanced Currency Strength 28 und Advanced Currency Impulse). Es bietet einen hervorragenden Überblick über den gesamten Forex-Markt. Es zeigt die Werte der Advanced Currency Strength, die Veränderungsrate der Währungen und die Signale für 28 Devisenpaare in allen (9) Zeitrahmen. Stellen Sie sich vor, wie sich Ihr Hande
Break and Retest
Mohamed Hassan
4.56 (9)
‍You can visually backtest Break & Retest to see how it behaved in the past!     Manual guide:   Click here $65  for only 1  copy left! Next price is $120 .  This Indicator only places quality trades when the market is really in your favor with a clear break and retest. Patience is key with this price action strategy! Recommended timeframes: M1 for Scalpers.  M15 for Intraday traders. H1 & H4 for Day traders. Other timeframes are also excellent! After many months of hard w
Advanced Supply Demand
Bernhard Schweigert
4.92 (310)
Derzeit 33% Rabatt! Die beste Lösung für jeden Anfänger oder erfahrenen Händler! Dieser Indikator ist ein einzigartiges, qualitativ hochwertiges und erschwingliches Trading-Tool, da wir eine Reihe von proprietären Funktionen und eine neue Formel integriert haben. Mit diesem Update werden Sie in der Lage sein, doppelte Zeitrahmenzonen anzuzeigen. Sie können nicht nur einen höheren TF (Zeitrahmen) anzeigen, sondern sowohl den Chart-TF als auch den höheren TF: SHOWING NESTED ZONES. Alle Supply Dema
Scalper Vault
Oleg Rodin
5 (28)
Scalper Vault ist ein professionelles Scalping-System, das Ihnen alles bietet, was Sie für erfolgreiches Scalping benötigen. Dieser Indikator ist ein komplettes Handelssystem, das von Forex- und Binäroptionshändlern verwendet werden kann. Der empfohlene Zeitrahmen ist M5. Das System liefert Ihnen genaue Pfeilsignale in Richtung des Trends. Es liefert Ihnen auch Top- und Bottom-Signale und Gann-Marktniveaus. Die Indikatoren bieten alle Arten von Warnungen, einschließlich PUSH-Benachrichtigungen.
on free demo press zoom out button to see back.. cnt number is bar numbers.you can change up to 3000 related to chart bars numbers. minimum value is 500. there is g value set to 10000. sometimes need to lower or increase. and if they need can make small change on it. this indicator almost grail,no repaint and all pairs ,all timeframe indicator. there is red and blue histograms. if gold x sign comes on red histogram that is sell signal. if blue x sign comes on blue histogram that is buy signal.
Präsentation des Miraculous Forex Indikators: Entfesseln Sie die Kraft präzisen Tradings Sind Sie es leid, nach dem besten Forex-Indikator zu suchen, der wirklich herausragende Ergebnisse in allen Zeitebenen liefert? Suchen Sie nicht weiter! Der Miraculous Forex Indikator ist da, um Ihre Trading-Erfahrung zu revolutionieren und Ihre Gewinne auf neue Höhen zu bringen. Basierend auf modernster Technologie und jahrelanger sorgfältiger Entwicklung steht der Miraculous Forex Indikator als Höhepunkt v
Quantum Breakout Indicator PRO
Bogdan Ion Puscasu
4.96 (26)
Wir stellen vor       Quantum Breakout PRO   , der bahnbrechende MQL5-Indikator, der die Art und Weise, wie Sie mit Breakout-Zonen handeln, verändert!   Quantum Breakout PRO   wurde von einem Team erfahrener Händler mit über 13 Jahren Handelserfahrung entwickelt und soll Ihre Handelsreise mit seiner innovativen und dynamischen Breakout-Zonen-Strategie auf ein neues Niveau bringen. Der Quantum Breakout Indicator zeigt Ihnen Signalpfeile auf Breakout-Zonen mit 5 Gewinnzielzonen und Stop-Loss
Currency Strength Wizard ist ein sehr leistungsstarker Indikator, der Ihnen eine Komplettlösung für erfolgreichen Handel bietet. Der Indikator berechnet die Stärke dieses oder jenes Forex-Paares anhand der Daten aller Währungen in mehreren Zeitrahmen. Diese Daten werden in Form von benutzerfreundlichen Währungsindizes und Währungsstärkelinien dargestellt, anhand derer Sie die Stärke dieser oder jener Währung erkennen können. Sie müssen lediglich den Indikator an das Diagramm anhängen, mit dem Si
Das technische Handelssystem von BB Reverse Arrows wurde entwickelt, um umgekehrte Punkte für Einzelhandelsentscheidungen vorherzusagen. Die aktuelle Marktsituation wird durch den Indikator analysiert und für mehrere Kriterien strukturiert: die Erwartung von Umkehrmomenten, potenziellen Wendepunkten, Kauf- und Verkaufssignalen. Der Indikator enthält keine überschüssigen Informationen, verfügt über eine visuelle verständliche Schnittstelle, mit der Händler angemessene Entscheidungen treffen k
Wir stellen Ihnen ON Trade Waves Patterns Harmonic Elliot Wolfe vor, einen fortschrittlichen Indikator, der entwickelt wurde, um verschiedene Markt-Muster mithilfe sowohl manueller als auch automatischer Methoden zu erkennen. Hier ist, wie er funktioniert: Harmonische Muster: Dieser Indikator kann harmonische Muster erkennen, die auf Ihrem Chart erscheinen. Diese Muster sind für Trader, die die Theorie des harmonischen Handels praktizieren, wie sie in Scott Carney's Buch "Harmonic Trading vol 1
GOLD Impulse with Alert
Bernhard Schweigert
4.56 (9)
Dieser Indikator ist eine hervorragende Kombination aus unseren 2 Produkten Advanced Currency IMPULSE with ALERT  +   Currency Strength Exotics . Es funktioniert für alle Zeitrahmen und zeigt grafisch Impulse der Stärke oder Schwäche für die 8 wichtigsten Währungen plus ein Symbol! Dieser Indikator ist darauf spezialisiert, die Beschleunigung der Währungsstärke für beliebige Symbole wie Gold, Exotische Paare, Rohstoffe, Indizes oder Futures anzuzeigen. Als erster seiner Art kann jedes Sym
Werden Sie Breaker Trader und profitieren Sie von Änderungen der Marktstruktur, wenn sich der Preis umkehrt. Der Order Block Breaker Indikator zeigt an, wann sich eine Trend- oder Preisbewegung der Erschöpfung nähert und bereit ist, sich umzukehren. Es weist Sie auf Änderungen in der Marktstruktur hin, die normalerweise auftreten, wenn eine Umkehrung oder ein größerer Rückzug bevorsteht. Der Indikator verwendet eine proprietäre Berechnung, die Ausbrüche und Preisdynamik identifiziert. Jedes
RelicusRoad Pro
Relicus LLC
4.78 (139)
Jetzt 147 US -Dollar (nach ein paar Aktualisierungen auf 499 US -Dollar) - Unbegrenzte Konten (PCs oder MACs) RelicusRoad Benutzerhandbuch + Schulungsvideos + Zugang zur privaten Discord-Gruppe + VIP-Status EINE NEUE ART, DEN MARKT ZU BETRACHTEN RelicusRoad ist der weltweit leistungsstärkste Handelsindikator für Forex, Futures, Kryptowährungen, Aktien und Indizes und gibt Händlern alle Informationen und Tools, die sie benötigen, um profitabel zu bleiben. Wir bieten technische Analysen un
Entry Points Pro
Yury Orlov
4.7 (225)
Dies ist ein Indikator für MT4, der genaue Signale für den Einstieg in einen Handel ohne Repainting (Neuzeichnen) liefert. Er kann auf alle Finanzwerte angewendet werden: Forex, Kryptowährungen, Metalle, Aktien, Indizes. Er liefert ziemlich genaue Schätzungen und sagt Ihnen, wann es am besten ist, eine Position zu eröffnen und zu schließen. Sehen Sie sich das Video (6:22) mit einem Beispiel für die Verarbeitung nur eines Signals an, das sich für den Indikator gelohnt hat! Die meisten Händler ver
TrendMaestro
Stefano Frisetti
5 (2)
note: this indicator is for METATRADER4, if you want the version for METATRADER5 this is the link:  https://www.mql5.com/it/market/product/108106 TRENDMAESTRO ver 2.4 TRENDMAESTRO recognizes a new TREND in the bud, he never makes mistakes. The certainty of identifying a new TREND is priceless. DESCRIPTION TRENDMAESTRO identifies a new TREND in the bud, this indicator examines the volatility, volumes and momentum to identify the moment in which there is an explosion of one or more of these data a
Up down v6T
Guner Koca
5 (1)
Thise indicator is up down v6  comes with tradingwiev pinescript. purchased people, after installed on terminal ,contact me on mql5  to get BONUS  TradingView pinescript. up-down indicator is no repaint and works all pairs and lower than weekly time frames charts. it is suitable also 1 m charts for all pairs. and hold long way to signal. dont gives too many signals. when red histogram cross trigger line that is up signal.and price probably will down when blue histogram cross trigger line that
TrendDecoder Premium
Christophe, Pa Trouillas
5 (3)
Identifizieren Sie Bereiche und die nächsten wahrscheinlichen Bewegungen   |  Erhalten Sie früheste Signale und die Stärke von Trends   |  Klare Ausstiegssignale vor Umkehrung   |  Erkennen Sie die Fibo-Levels, die der Kurs testen wird Indikator, der nicht zurückverfolgt, nicht verzögert - ideal für den manuellen und automatisierten Trading - geeignet für alle Vermögenswerte und Zeiteinheiten Zeitlich begrenztes Angebot   >> 50% OFF Nach dem Kauf,   bitte kontaktieren Sie mich auf diesem Kanal  
FX Power MT4 NG
Daniel Stein
5 (9)
Erhalten Sie Ihr tägliches Marktupdate mit Details und Screenshots über unser Morning Briefing hier auf mql5 und auf Telegram ! FX Power MT4 NG ist die nächste Generation unseres langjährig sehr beliebten Währungsstärkemessers FX Power. Und was bietet dieser Stärkezähler der nächsten Generation? Alles, was Sie am ursprünglichen FX Power geliebt haben PLUS GOLD/XAU-Stärkeanalyse Noch präzisere Berechnungsergebnisse Individuell konfigurierbare Analysezeiträume Anpassbares Berechnungslimit für noc
The 1 2 3 Pattern Scanner
Reza Aghajanpour
4.78 (54)
** All Symbols x All Timeframes scan just by pressing scanner button ** After 17 years of experience in the markets and 3 years of programming, Winner indicator is ready. I would like to share with you! *** Contact me after purchase to send you instructions and add you in "123 scanner group" for sharing or seeing experiences with other users. Introduction The 123 Pattern Scanner indicator with a special enhanced algorithm is a very repetitive common pattern finder with a high success rate . Inte
Connect Indicator
Sukunthakan Ngernbamrung
Connect Indicator is a tool used for connecting indicators between the MQL market and MT4. The connected indicators are made by our group and can be used for other applications, such as sending messages to the Line application or Telegram application. If you have any questions, please don't hesitate to ask us to receive support. Function and indicator buffer Buffer one is the high price of the previous candle. Buffer two is the high price of the previous candle. Usage To connect indicators to fu
Weitere Produkte dieses Autors
Resistance and Support is an easy to use indicator to apply horizontal lines of resistance and support. There are two windows for adding levels. When you press the button, a line appears on the price chart. It is possible to move this line with the mouse, thereby changing the indicator readings. In the indicator menu there is a choice of possible alerts - no alert, alert on touching the level and an alert for closing the candle after the level.
FREE
Resistance and Support is an easy to use indicator to apply horizontal lines of resistance and support. There are two windows for adding levels. When you press the button, a line appears on the price chart. It is possible to double-click this line with the mouse to activate and move it, thereby changing the indicator readings. In the indicator menu there is a choice of possible alerts - no alert, alert on touching the level   an alert for closing the candle after the level.
FREE
Trend easy
Wiktor Keller
1 (1)
Trend easy простой трендовый индикатор в виде гистограмы. окно индикатора разделено на две части верхняя гистограма движение в бай, нижняя гистограма движениие в сел. Кроме гистограмы, сигнал индикатора дублируется на графике стрелками. В меню индикатора имеется количество баров в истории индикатора  значения периода для определения тренда разрешение рисования стрелок на графике код и цвета стрелок алерты и отступ стрелок
FREE
Trend indicator Trend Esay MTF is an indicator that draws arrows directly on the price chart. Like every trend indicator, it works well with good price movement and worse in a flat. A feature of this indicator is the ability to send alerts both in the terminal and on a smartphone. The indicator menu contains the number of bars in the history of the indicator and period value for determining the trend. The "trend" function has been added to the indicator menu, which filters the indicator signals
FREE
My Notes
Wiktor Keller
My notes is a simple indicator that will help you put any notes on your price chart. W ith one click you get as many notes as you choose from the menu. All blanks for your entries are lined up in one column. You only need to move the records to the right place on the graph and click on the record. The menu consists of four items: My_sum_Note number of entries , default 5 ; MyMessage Font font name, default "Arial"; MyMessage FontSize font size, default 10; MyMessageColor is the font color, Black
FREE
Adaptiv Ma это индикатор средняя линия  значение которой выставляется в меню и применяется на тейфрейме Н4. В последствии она адаптируется к выбранному определенному таймфрейму. В меню индикатора задаются следующие параметры 1. Период индикатора 2.Метод определения Ма. 3. Стиль Ма. 4.Толщина линии Ма. 5.Цвет линии Ма. При переключении между таймфреймами автоматически переключается значение периода Ма для адаптации к новому таймфрейму. Пишите насколько вам была полезен такой индикатор. 
FREE
Infometer
Wiktor Keller
Infometer индикатор для вывода информации в одном из углов - сколько пунктов  (пипсов) или в валюте депозита профита во всех отрытых ордеров данного торгового инструмента. В меню индикатора внесены такие данные 1. Угол вывода информации. 2. Цвет вывода информации. 3. вывод валюты депозита и пипсов. 4. Выбор вывода информации - профит и пункты - профит -пункты. На белом фоне автоматически информация выводится черным цветом на других фонах цвет вывода информации определяется в меню.
FREE
The Breakeven indicator is based on determining the breakeven levels of orders for a given instrument.  The indicator draws the breakeven level of BUY orders, the breakeven level of SELL orders.  If the number of lots between BUY orders and SELL orders between each other, the indicator draws the ALL breakeven level.  Drawing of levels is disabled in the indicator menu.
Rails
Wiktor Keller
The RAILS indicator is the identification of the candlestick analysis pattern - Price Action. It signals an imminent price reversal or pullback. The main feature is the identification of candle combinations. In this case, the indicator is looking for two adjacent candles that are directed in different directions. In the upper part there is an information panel where information about different timeframes and identified "Rails" paptterns. There is also information - how many bars to that the pat
One of the Price Action patterns called PinBar is implemented in a custom indicator. Usually means a large candle with a small body and a large tail. Such candles appear at the end of a movement or candles that indicate a continuation of the trend. The peculiarity of this PinBar indicator is that it determines the pattern on all timeframes. Information output by arrows is organized for the active timeframe and additionally for timeframes H1, H4, D1.
The Soldbar indicator is a price action candlestick pattern indicator. It indicates the begin or end of a trend. The information panel shows the last Soldbar of the found pattern on all time frames. When you hover the mouse arrow over an information bar, the pop-up menu shows the time of that bar. The signal of the active window is displayed by arrows, it is separately possible to turn on additional information timeframes H1, H4, D1.
Outsidebar is an indicator of price action candlestick patterns. The following information changes in the indicator menu 1. The number of bars in history. 2. Indent of the information panel. 3.Filter by trend. 4. Turning on the arrows of the current chart. 5. Turning on the arrows of the typhreys H1, H4, D1. 6. Inclusion of alert, signal, e-mail, push notification. 7.Select a signal. 8. Arrow indent.
Back to the Future is a trend indicator. It consists of four parts. 1. Part is the fibo levels that define the minimum and maximum targets. 2. This is a target level that defines the minimum correction targets and trend targets. 3. Dynamic levels correction targets and trend targets.. 4. Trend levels based on trend lines. All parts are included in the indicator menu. the indicator Back to the Future does not repaint. The change of information comes after the calculation of the last 3 bars
Divergence HiLo
Wiktor Keller
5 (1)
Stock! Now there is a special price for the first 10 buyers. Hurry up. Divergence HiLo is an indicator that identifies highs and lows prices (High end Low) . Based on a special algorithm, the indicator determines the value of divergence or convergence. In addition to divergence or convergence values, the indicator determines the expected take levels profit. The price chart shows divergence lines, possible profit levels and arrows that indicate the formed signal of the indicator in buy or sell.
The logical continuation of the divergence indicator is the Divergence HiLo Dashboard indicator - a divergence scanner immediately for three currency pairs. In the indicator menu, select which currency pairs we will analyze. The analysis is carried out on the timeframes M15, H1, H4, D1. In addition to divergences, tops and bottoms are analyzed. All data is entered into tables Alerts are provided in the indicator. According to the logic of the indicator, the signal appears after the end of 3 bars
The Breakeven levels indicator is an indicator that, according to its algorithm of work, determines the number of open orders on a certain instrument finds the level at which all orders go from loss to profit. Separately, for sell and buy orders, the general level of the beginning of profit is found. In the lower left or right corner, information is displayed on three buttons to choose from. When you press the button, a horizontal line of a certain level is displayed on the screen. On the right
Divergence HiLo scaner is a good tool for market analysis.   The indicator looks through all currency pairs and finds those that meet the selection conditions, where corrections or reversals to the main movements are supposed to begin. The indicator values ​​are entered in the final table. 1 value is swap 2 Currency pair. 3  The number of bars after finding the selection conditions. The bar color blue is used for the buy signal. The bar color yellow is used for the sell signal. The color of the
Trade panel manual is a multifunctional trading assistant. It allows you to open market and pending orders in one click. Value is set via button menu edit or deleted by specific buttons pending orders and the value of take profit and stop loss in one click. Through the edit menu of the button, a value is set that can be easily changed by simply moving level_tp lines for take profit or stop loss levels and for pending orders. It is possible to select orders and determine for them and set the leve
The Volume com indicator is an indicator in which the price movement control mode is organized using tick volumes. Volume com indicator gives signals that can be filtered and get a good result   The main advantage of the signals of this indicator is that they appear both at the end of the trend and along its course. The indicator works on all timeframe. The first indicator in the series .
Volume mag indicator is another indicator that is used to calculate entry points tick volume. The indicator rarely gives a signal, but this can be said to be its advantage. The indicator's signals are not redrawn and do not lag, but are issued after the close of the current candle. The indicator does not overload the terminal and calculates entry points within the BarsCount value, which is set in the menu, by default 500 bar.
The Volume New indicator is the main indicator for calculating direction of price movement by tick volumes. The indicator generates the maximum number of signals that it is possible to filter according to your strategies. The indicator does not redraw or lag and generates a signal according to the settings SIGNALBAR values, default 1 - after the close of the current candle. The number of history bars for calculation is set in the indicator menu by the value BarsCount, default is 500 bars.
Back to the Future это индикатор который определяет направление тренда. Определяет  четыре уровня для роста и падения  1-й уровень  флета 2 -й уровень  коррекции  3-й уровень продолжения тренда и 4-й уровень  возможного разворота. Индикатор рисует трендовые линии краткострочного и долгострочного тренда. Так же индикатор определяет  динамические сел и бай зоны в виде прямоугольников. От ближайшего максимума или минимума рисует фибо уровни для определения целей движения.  В меню индикатора отключа
Auswahl:
Keine Bewertungen
Antwort auf eine Rezension
Version 1.2 2023.04.08
Версия 1.02