• Übersicht
  • Bewertungen
  • Diskussion
  • Neue Funktionen

Supertrend MetaTrader 5

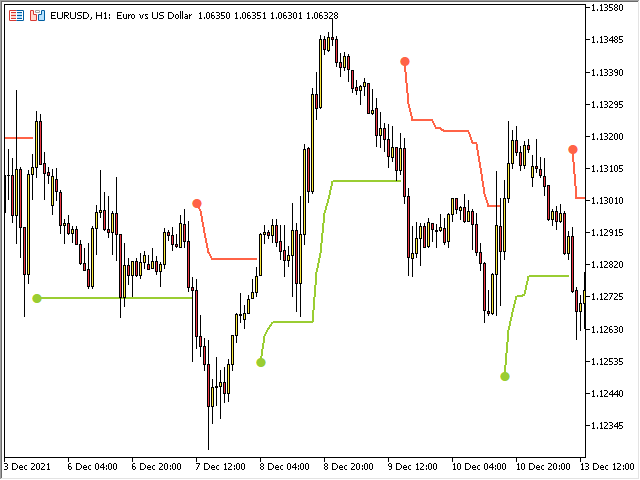
Der Indikator „Supertrend MetaTrader 5“ ist die Grundlage des einfachsten Trendhandelssystems. Und doch bleibt es sehr effektiv. Der Indikator funktioniert in jedem Zeitrahmen (im Zeitrahmen des aktuellen Charts). Aus dem Namen können Sie ersehen, dass dieser Indikator dem Trend folgt, und wenn sich der Trend ändert, zeigt der Indikator genau den Punkt der Trendänderung an. Die Grundlage von „Supertrend MetaTrader 5“ ist der Vergleich von Preis- und „Average True Range Indicator“-Werten multipliziert mit einem Multiplikator (es besteht auch die Möglichkeit, „Moving Average“ zu verwenden, der auf der Grundlage von „True Range“ anstelle von „ATR“ berechnet wird). .

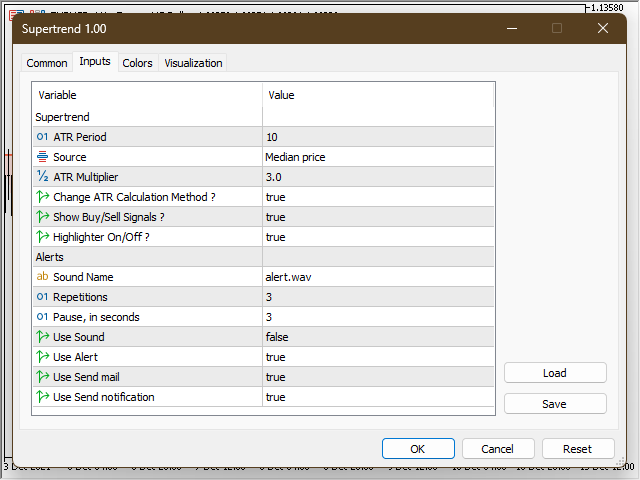
Der Indikator zeigt die besten Ergebnisse in trendigen Marktbereichen und mit den Parametern 10 und 3 ('ATR Period' ist gleich 10 und 'ATR Multiplier' ist gleich 3). Im D1-Zeitrahmen wird empfohlen, bestätigende Indikatoren zu verwenden.

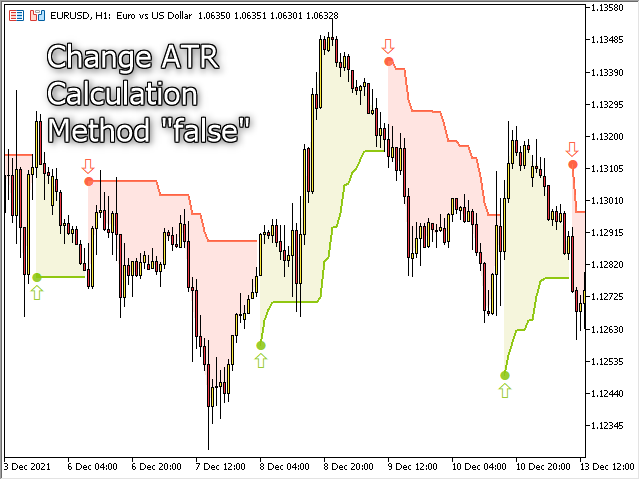
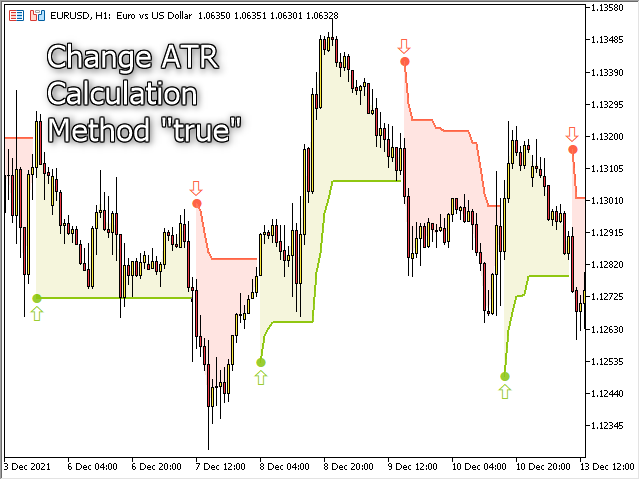
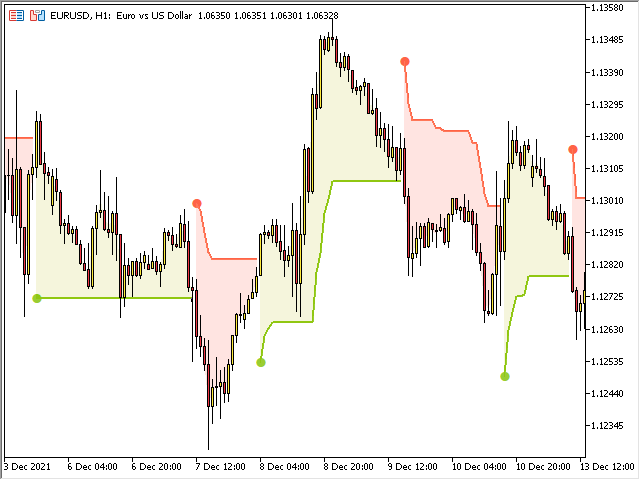
In den Parametern können Sie den Indikatortyp auf 'ATR' oder 'Moving Average' einstellen (dafür ist der Parameter 'Change ATR Calculation Method ?' verantwortlich), Sie können die Signalpfeile 'Buy' und 'Sell' aktivieren/deaktivieren (das 'Show Buy/Sell Signals ? ') und Sie können die Trendfüllung aktivieren/deaktivieren (Parameter 'Highlighter On/Off ?').

Außerdem können Sie im Block „Alerts“ Benachrichtigungen über das Erscheinen von Signalen einrichten (ACHTUNG! Der Indikator arbeitet aktiv am aktuellen Balken und daher kann das Signal am aktuellen Balken entweder erscheinen oder verschwinden).


Empfohlene Produkte
Follow The Line MT5
Oliver Gideon Amofa Appiah
4.42 (31)
This indicator obeys the popular maxim that: "THE TREND IS YOUR FRIEND" It paints a GREEN line for BUY and also paints a RED line for SELL. (you can change the colors). It gives alarms and alerts of all kinds. IT DOES NOT REPAINT and can be used for all currency pairs and timeframes. Yes, as easy and simple as that. Even a newbie can use it to make great and reliable trades. NB: For best results, get my other premium indicators for more powerful and reliable signals. Get them here: https://www.m
FREE
Important Lines
Terence Gronowski
4.88 (26)
Important Lines Indikator (M1 - M15) Dieser Indikator zeigt Pivot-Lines, vortages Hoch und Tief, vortages Close und das Minimum und Maximum der vorherigen Stunde an. Sie müssen nur diesen einzelnen Indikator in das Diagramm ziehen, um alle diese wichtigen Linien zu haben. Sie können sich das Laden vieler einzelnen Indikatoren ersparen. Warum sind bestimmte Linien beim Traden so wichtig? Vortageshoch und -tief: Diese werden von Händlern beobachtet, die in einer Tages-Chart handeln. Sehr of
FREE
What is this indicator? This indicator is the MACD (Moving Average Convergence/Divergence) supporting Virtual Trading mode of  Knots Compositor . When the mode is turned on, the indicator will be recalculated based on the displayed candlesticks. When the mode is turned off, the indicator will be recalculated based on the original chart candlesticks. Types of the applied price - Close - Open - High - Low - Median Price (HL/2) - Typical Price (HLC/3) - Weighted Price (HLCC/4) KC-Indicators
FREE
Are you tired of drawing trendlines every time you're analyzing charts? Or perhaps you would like more consistency in your technical analysis. Then this is for you. This indicator will draw trend lines automatically when dropped on a chart. How it works Works similar to standard deviation channel found on mt4 and mt5. It has 2 parameters: 1. Starting Bar 2. Number of bars for calculation The   starting bar   is the bar which drawing of the trend lines will begin, while the   number of bars for c
FREE
Rainbow MT5
Jamal El Alama
4.33 (3)
Description : Rainbow MT5 is a technical indicator based on Moving Average with period 34 and very easy to use. When price crosses above MA and MA changes color to green, then this is a signal to buy. When price crosses below MA and MA changes color to red, then this is a signal to sell. The Expert advisor ( Rainbow EA MT5 ) based on Rainbow MT5 indicator is now available here . MT4 version is available here .
FREE
LT Donchian Channel
Thiago Duarte
4.75 (4)
Donchian Channel is an indicator created by Richard Donchian. It is formed by taking the highest high and the lowest low of the last specified period in candles. The area between high and low is the channel for the chosen period. Its configuration is simple. It is possible to have the average between the upper and lower lines, plus you have alerts when price hits one side. If you have any questions or find any bugs, please contact me. Enjoy!
FREE
The indicator identifies when a divergence occurs between price and an indicator or oscillator. It identifies both regular and hidden divergences. Combined with your own rules and techniques, this indicator will allow you to create (or enhance) your own powerful system. Features Can detect divergences for the following oscillators/indicators:   MACD, OsMA, Stochastics, RSI, CCI, RVI, Awesome, ADX, ATR, OBV, Composite index, MFI and Momentum. Only one oscillator/indicator can be selected. Draws
FREE
This indicator is especially for the binary trading. Time frame is 1 minutes and exp time 5 or 3 minutes only. You must be use martingale 3 step. So you must put lots size is 10 % at most. You should use Mt2 trading platform to connect with my indicator to get more signal without human working. This indicator wining rate is over 80% but you may get 100% of profit by using martingale 3 step. You should use MT2 Trading Platform to connect meta trader platform and binary platform . You can get mt2
FREE
What is this indicator? This indicator is the RSI (Relative Strength Index) supporting Virtual Trading mode of  Knots Compositor . When the mode is turned on, the indicator will be recalculated based on the displayed candlesticks. When the mode is turned off, the indicator will be recalculated based on the original chart candlesticks. Types of the applied price - Close - Open - High - Low - Median Price (HL/2) - Typical Price (HLC/3) - Weighted Price (HLCC/4) KC-Indicators -   KC-MA   (M
FREE
HMA Color with Alerts MT5
Pavel Zamoshnikov
4.73 (51)
Hull Moving Average (HMA) is well-deservedly popular among traders because of the effective averaging of market noise and a relatively small delay. The current MetaTrader 5 version changes its color when the movement direction changes. Sound and text signals are available. It also supports sending email and push messages. It is possible to trigger a signal on the current incomplete bar, although such a signal may be canceled before completion if conditions are no longer appropriate. One of the p
FREE
Mitimom
Danil Poletavkin
The indicator is based on Robert Miner's methodology described in his book "High probability trading strategies" and displays signals along with momentum of 2 timeframes. A Stochastic oscillator is used as a momentum indicator. The settings speak for themselves period_1 is the current timeframe, 'current' period_2 is indicated - the senior timeframe is 4 or 5 times larger than the current one. For example, if the current one is 5 minutes, then the older one will be 20 minutes The rest of the
FREE
Donchian Channel DC is the indicator of Donchian Channels, that plots maximum and minimum values of a specific period, besides mean value line. It´s possible to configure simple period for analysis and the indicator will plot all three values. You can trade with this indicator as trend or reversal, according to each strategy. Do not let to test others indicators as soon as others expert advisors.
Free automatic Fibonacci is an indicator that automatically plots a Fibonacci retracement based on the number of bars you select on the BarsToScan setting in the indicator. The Fibonacci is automatically updated in real time as new highest and lowest values appears amongst the selected bars. You can select which level values to be displayed in the indicator settings. You can also select the color of the levels thus enabling the trader to be able to attach the indicator several times with differe
FREE
Der Trendfänger: Die Strategie des Trendfängers mit Alarmindikator ist ein vielseitiges technisches Analysewerkzeug, das Händlern hilft, Markttrends und potenzielle Ein- und Ausstiegspunkte zu identifizieren. Sie verfügt über eine dynamische Trendfängerstrategie, die sich den Marktbedingungen anpasst, um eine klare visuelle Darstellung der Trendrichtung zu ermöglichen. Händler können die Parameter an ihre Vorlieben und Risikotoleranz anpassen. Der Indikator hilft bei der Trendidentifikation,
FREE
Reversal Candles MT5
Nguyen Thanh Cong
5 (2)
Introduction Reversal Candles is a cutting-edge non-repainting   forex indicator designed to predict price reversals with remarkable accuracy through a sophisticated combination of signals. Signal Buy when the last closed candle has a darker color (customizable) and an up arrow is painted below it Sell when the last closed candle has a darker color (customizable) and a down arrow is painted above it
FREE
TradeQL
Abdiel Aviles Jimenez
The TradeQL Indicator is a customizable tool that highlights specific trading patterns on candlestick charts. Users can define patterns through TradeQL queries, which the indicator then applies to the chart, visually representing matches and captured groups. Ideal for identifying complex trade setups in real-time. TradeQL queries are specified using the TradeQL Language. See https://github.com/abdielou/tradeql for more details. This language is expressed as a regular expression. The language a
FREE
This indicator is a zero-lag indicator and displays  strength of trend change . True Trend  Oscillator Pro works best in combination with True Trend Moving Average Pro that displays exact trend as is. Oscillator value is exact price change in given direction of the trend. True Trend Moving Average Pro: https://www.mql5.com/en/market/product/103586 If you set PERIOD input parameter to 1 this indicator becomes a sharpshooter for binary options. Developers can use True Trend Oscillator in E
FREE
Multi-timeframe trend indicator based on the ADX / ADXWilder indicator with Fibonacci levels The indicator shows trend areas using ADX or ADXWilder indicator data from multiple timeframes. The impulse mode of the indicator allows you to catch the beginning of a trend, and several "Screens" with different timeframes allow you to filter out market noise. Fibonacci levels are added to the price chart, which have flexible settings. How the indicator works: if PDI is greater than NDI, then   it`
FREE
PZ Penta O MT5
PZ TRADING SLU
4 (6)
The Penta-O is a 6-point retracement harmonacci pattern which usually precedes big market movements. Penta-O patterns can expand and repaint quite a bit. To make things easier this indicator implements a twist: it waits for a donchian breakout in the right direction before signaling the trade. The end result is an otherwise repainting indicator with a very reliable trading signal. The donchian breakout period is entered as an input. [ Installation Guide | Update Guide | Troubleshooting | FAQ | A
FREE
Automatic Trendlines
Pasi Hakamaki
4.63 (49)
Der Indikator zeichnet Trendlinien im Diagramm. Dieser Indikator hat sechs Eingänge. Der Benutzer kann alternative Beschriftungen für beide Zeilen angeben. Wenn mehrere Instanzen des Indikators verwendet werden, müssen sich die Beschriftungen unterscheiden. Der Benutzer kann die Breite und Farbe der Linien und die Tiefe festlegen, um festzulegen, welche signifikanten Peaks verwendet werden sollen. Zum Beispiel setzt Depth = 10 Trendlinien unter Verwendung der aktuellen Spitzen und Täler, die rec
FREE
LT Rainbow Trend
Thiago Duarte
5 (1)
Do you, like me, like to trade with the trend? Then this indicator will help you! Rainbow Trend is a trend indicator, which uses several Moving Averages on the chart. It measures different trend strenght zones for different periods: very long term, long term, mid term, short term and very short term. Each zone has its color, and it is possible to have sound alert when the prices leaves a zone and enters another. Its configuration is very simple. If you find any bug or have any suggestions, co
Cumulative Delta MT5
Evgeny Shevtsov
4.47 (57)
The indicator analyzes the volume scale and splits it into two components - seller volumes and buyer volumes, and also calculates the delta and cumulative delta. The indicator does not flicker or redraw, its calculation and plotting are performed fairly quickly, while using the data from the smaller (relative to the current) periods. The indicator operation modes can be switched using the Mode input variable: Buy - display only the buyer volumes. Sell - display only the seller volumes. BuySell -
FREE
Show Pips for MT5
Roman Podpora
4.61 (18)
This information indicator will be useful for those who always want to be aware of the current situation on the account. - More useful indicators The indicator displays data such as profit in points, percentage and currency, as well as the spread for the current pair and the time until the bar closes on the current timeframe. There are several options for placing the information line on the chart: - To the right of the price (runs behind the price); - As a comment (in the upper left corner
FREE
This indicator is an automated version of the Fibonacci retracement (Fib) indicator. Deciding the best areas to use when drawing the fib can be tricky and this  indicator was made with that in mind. When you drop it on the chart it will automatically choose the best points to draw the fib with, but in case you aren't satisfied with those regions, you can adjust it as you wish.
FREE
Dual RSI
Paul Conrad Carlson
Indicator alerts for Dual Relative strength index rsi. Large rsi preset at 14 is below 30 small rsi preset at 4 is below 10 for buy bullish signals . Large rsi preset are 14 is above 70 small rsi preset at 4 is above 90 for sell bearish signals . Includes mobile and terminal alerts. draws lines when alerts. This indicator can help identify extremes and then the tops or bottoms of those extremes .
FREE
Indicator measures strength of each currency in your list. Main idea: It simply iterates through all combinations of pairs and adds difference between open and close in percent. Parameters: List of currencies - what currencies will be calculated (maximum is 8) Calculation type - from which data will be strength calculated Calculation data input - used as input related to calculation type Symbol suffix - used in case of suffix on symbols, e.g: when your symbols look like EURUSDm, EURUSDmicro et
FREE
Half ma
Artem Svistunov
The Half ma arrow indicator for the MetaTrader 5 trading terminal is a simple but effective tool that gives a signal about a change in the current trend. The Half ma indicator looks like a solid dynamic line that changes color at the points where the trend changes. At these points, the indicator draws arrows of the corresponding color and direction.The Half ma arrow indicator for the MT5 terminal is not an independent source of input signals. It will be most effective to use it as a trend filte
This is a free version of the indicator, the period between the vertical lines is always 30 bars. In the paid version the period can be set by user, so a configuration with many ThreePointsChannel indicators with different periods is possible. The principle of construction - on top of any number of bars set by the user, a channel is constructed with maximum and minimum lines so that the bars touch the maximum and minimum of the channel at exactly three points. The name of the indicator follows
FREE
RenkoExpert
Andrey Goida
3.67 (3)
Renko Expert Advisor based on Renko bar simulation.    The EA has two options for building Renko bars. Classic and ATR. In the classic version, renko bars are marked with areas on the main chart; in the ATR version, renko bars are modeled and drawn in the indicator window. Modeling renko bars inside the EA allows you to optimize the robot better than drawing renko bars offline.      Telegramm channel   Set file Our second robot RENKOTREND Does not use martingale!  Trades opened by the robot co
FREE
DALA Forecast
Grigorii Matsnev
About the indicator: DALA Forecast is a universal tool for predicting the dynamics of time series of any nature. For prediction, modified methods of nonlinear dynamics analysis are used, on the basis of which a predictive model is built using machine learning methods.  To get the trial version of the indicator, you can contact me in private messages. How to use the indicator: Apply the indicator to your chosen financial instrument or indicator with the settings you need. The prediction will b
FREE
Käufer dieses Produkts erwarben auch
Zunächst einmal ist es wichtig zu betonen, dass dieses Handelssystem ein Nicht-Repainting-, Nicht-Redrawing- und Nicht-Verzögerungsindikator ist, was es sowohl für manuelles als auch für automatisches Trading ideal macht. Das "Smart Trend Trading System MT5" ist eine umfassende Handelslösung, die für neue und erfahrene Trader maßgeschneidert ist. Es kombiniert über 10 Premium-Indikatoren und bietet mehr als 7 robuste Handelsstrategien, was es zu einer vielseitigen Wahl für verschiedene Marktbe
Atomic Analyst MT5
Issam Kassas
4.82 (11)
Zunächst einmal ist es erwähnenswert, dass dieser Handelsindikator nicht neu malt, nicht neu zeichnet und keine Verzögerung aufweist, was ihn sowohl für manuellen als auch für Roboterhandel ideal macht. Der Atom-Analyst ist ein PA-Preisaktionsindikator, der die Stärke und das Momentum des Preises nutzt, um einen besseren Vorteil auf dem Markt zu finden. Ausgestattet mit fortschrittlichen Filtern, die helfen, Rauschen und falsche Signale zu entfernen, und das Handelspotenzial zu erhöhen. Durch
FX Volume MT5
Daniel Stein
4.94 (17)
Erhalten Sie Ihr tägliches Marktupdate mit Details und Screenshots über unser Morning Briefing hier auf mql5 und auf Telegram ! FX Volume ist der ERSTE und EINZIGE Volumenindikator, der einen ECHTEN Einblick in die Marktstimmung aus Sicht eines Brokers bietet. Es bietet fantastische Einblicke in die Positionierung von institutionellen Marktteilnehmern, wie z.B. Brokern, auf dem Forex-Markt, viel schneller als COT-Berichte. Diese Informationen direkt auf Ihrem Chart zu sehen, ist der wahre Game
Quantum Trend Sniper
Bogdan Ion Puscasu
5 (37)
Wir stellen vor       Quantum Trend Sniper Indicator   , der bahnbrechende MQL5-Indikator, der die Art und Weise, wie Sie Trendumkehrungen erkennen und handeln, verändert! Entwickelt von einem Team erfahrener Händler mit über 13 Jahren Handelserfahrung,       Quantum Trend Sniper-Indikator       wurde entwickelt, um Ihre Trading-Reise mit seiner innovativen Methode zur Identifizierung von Trendumkehrungen mit extrem hoher Genauigkeit auf ein neues Niveau zu heben. ***Kaufe Quantum Trend Snipe
Gold Stuff mt5
Vasiliy Strukov
4.89 (166)
Gold Stuff mt5-Ein Trendindikator, der speziell für Gold entwickelt wurde, kann auch auf allen Finanzinstrumenten verwendet werden. Der Indikator wird nicht neu gezeichnet und verzögert sich nicht. Empfohlener Zeitrahmen H1. WICHTIG! Kontaktieren Sie mich sofort nach dem Kauf, um Anweisungen und Bonus zu erhalten! DATEN Draw Arrow - inkl.aus. zeichnen von Pfeilen in einem Diagramm. Alerts-inkl.aus.akustische Warnungen. E - mail notification-inkl.aus. benachrichtigungen per E-Mail. Puch-
Trend Screener Pro MT5
STE S.S.COMPANY
4.89 (61)
Nutzen Sie die Macht des Trendhandels mit Trend Screener Indicator: Ihrer ultimativen Trendhandelslösung, die auf Fuzzy-Logik und einem System mit mehreren Währungen basiert! Steigern Sie Ihren Trendhandel mit Trend Screener, dem revolutionären Trendindikator mit Fuzzy-Logik. Es handelt sich um einen leistungsstarken Trendfolgeindikator, der über 13 Premium-Tools und -Funktionen sowie 3 Handelsstrategien kombiniert und ihn zu einer vielseitigen Wahl macht, um Ihren Metatrader in einen Trendanaly
RelicusRoad Pro MT5
Relicus LLC
4.82 (22)
Jetzt 147 US -Dollar (nach ein paar Aktualisierungen auf 499 US -Dollar) - Unbegrenzte Konten (PCs oder MACs) RelicusRoad Benutzerhandbuch + Schulungsvideos + Zugang zur privaten Discord-Gruppe + VIP-Status EINE NEUE ART, DEN MARKT ZU BETRACHTEN RelicusRoad ist der weltweit leistungsstärkste Handelsindikator für Forex, Futures, Kryptowährungen, Aktien und Indizes und gibt Händlern alle Informationen und Tools, die sie benötigen, um profitabel zu bleiben. Wir bieten technische Analysen un
Zunächst einmal ist es wichtig zu betonen, dass dieses Handelstool ein Nicht-Repaint-, Nicht-Redraw- und Nicht-Verzögerungsindikator ist, was es ideal für professionelles Trading macht. Der Smart Price Action Concepts Indikator ist ein sehr leistungsstarkes Werkzeug sowohl für neue als auch erfahrene Händler. Er vereint mehr als 20 nützliche Indikatoren in einem und kombiniert fortgeschrittene Handelsideen wie die Analyse des Inner Circle Traders und Strategien des Smart Money Concepts. Diese
Dies ist ein Indikator für MT5, der genaue Signale für den Einstieg in einen Handel ohne Repainting (Neuzeichnen) liefert. Er kann auf alle Finanzwerte angewendet werden: Forex, Kryptowährungen, Metalle, Aktien, Indizes. Er liefert ziemlich genaue Schätzungen und sagt Ihnen, wann es am besten ist, eine Position zu eröffnen und zu schließen. Sehen Sie sich das Video (6:22) mit einem Beispiel für die Verarbeitung nur eines Signals an, das sich für den Indikator gelohnt hat! Die meisten Händler ver
FX Power MT5 NG
Daniel Stein
5 (4)
Erhalten Sie Ihr tägliches Marktupdate mit Details und Screenshots über unser Morning Briefing hier auf mql5 und auf Telegram ! FX Power MT5 NG ist die nächste Generation unseres langjährig sehr beliebten Währungsstärkemessers FX Power. Und was bietet dieser Stärkezähler der nächsten Generation? Alles, was Sie am ursprünglichen FX Power geliebt haben PLUS GOLD/XAU-Stärkeanalyse Noch präzisere Berechnungsergebnisse Individuell konfigurierbare Analysezeiträume Anpassbares Berechnungslimit für noc
Advanced Supply Demand MT5
Bernhard Schweigert
4.53 (15)
Derzeit 33% Rabatt! Die beste Lösung für jeden Anfänger oder erfahrenen Händler! Dieser Indikator ist ein einzigartiges, qualitativ hochwertiges und erschwingliches Trading-Tool, da wir eine Reihe von proprietären Funktionen und eine neue Formel integriert haben. Mit diesem Update werden Sie in der Lage sein, doppelte Zeitrahmenzonen anzuzeigen. Sie können nicht nur einen höheren TF (Zeitrahmen) anzeigen, sondern sowohl den Chart-TF als auch den höheren TF: SHOWING NESTED ZONES. Alle Supply Dema
Auto Order Block with break of structure based on ICT and Smart Money Concepts Futures Break of Structure ( BoS )             Order block ( OB )            Higher time frame Order block / Point of Interest ( POI )    shown on current chart           Fair value Gap ( FVG ) / Imbalance   ,  MTF      ( Multi Time Frame )    Volume Imbalance     ,  MTF          vIMB Gap’s Equal High / Low’s     ,  MTF             EQH / EQL Liquidity               Current Day High / Low           HOD /
XQ Indicator MetaTrader 5
Marzena Maria Szmit
5 (1)
Step into the realm of Forex trading with confidence and precision using XQ, a cutting-edge Forex indicator designed to elevate your trading game to unprecedented heights. Whether you're a seasoned trader or just stepping into the world of currency exchange, XQ Forex Indicator empowers you with the insights and signals needed to make informed trading decisions. The signal conditions are a combination of three indicators, and XQ Forex Indicator only display  medium and long-term trends . The ind
ICT, SMC, SMART MONEY CONCEPTS, SMART MONEY, Smart Money Concept, Support and Resistance, Trend Analysis, Price Action, Market Structure, Order Blocks, BOS/CHoCH,   Breaker Blocks ,  Momentum Shift,   Supply&Demand Zone/Order Blocks , Strong Imbalance,   HH/LL/HL/LH,    Fair Value Gap, FVG,  Premium  &   Discount   Zones, Fibonacci Retracement, OTE, Buy Side Liquidity, Sell Side Liquidity, BSL/SSL Taken, Equal Highs & Lows, MTF Dashboard, Multiple Time Frame, BigBar, HTF OB, HTF Market Structure
Blahtech Supply Demand MT5
Blahtech Limited
4.57 (14)
Was: $299  Now: $99   Supply Demand uses previous price action to identify potential imbalances between buyers and sellers. The key is to identify the better odds zones, not just the untouched ones. Blahtech Supply Demand indicator delivers functionality previously unavailable on any trading platform. This 4-in-1 indicator not only highlights the higher probability zones using a multi-criteria strength engine, but also combines it with multi-timeframe trend analysis, previously confirmed swings
Werden Sie Breaker Trader und profitieren Sie von Änderungen der Marktstruktur, wenn sich der Preis umkehrt. Der Order Block Breaker Indikator zeigt an, wann sich eine Trend- oder Preisbewegung der Erschöpfung nähert und bereit ist, sich umzukehren. Es weist Sie auf Änderungen in der Marktstruktur hin, die normalerweise auftreten, wenn eine Umkehrung oder ein größerer Rückzug bevorsteht. Der Indikator verwendet eine proprietäre Berechnung, die Ausbrüche und Preisdynamik identifiziert. Jedes
Der Gann Square Indikator ist ein leistungsstolles Marktanalyse-Tool, das auf dem Artikel "Mathematische Formel für Marktvorhersagen" von W.D. Gann basiert. Dieses Tool verwendet mathematische Konzepte und Gann-Theorien für eine präzise Marktanalyse. Es beinhaltet Quadratwerte von 144, 90, 52 und auch das Quadrat von 9. Darüber hinaus integriert es die Methode von  zur Quadratwurzel von 9 und deren Beziehung zu Kanälen und dem Sternmuster. Benutzerhandbuch und Anwendung: Vor der Verwendung diese
AW Trend Predictor MT5
AW Trading Software Limited
4.76 (54)
Die Kombination von Trend- und Aufschlüsselungsebenen in einem System. Ein fortschrittlicher Indikatoralgorithmus filtert Marktrauschen, bestimmt den Trend, Einstiegspunkte sowie mögliche Ausstiegsniveaus. Indikatorsignale werden in einem Statistikmodul aufgezeichnet, das es Ihnen ermöglicht, die am besten geeigneten Tools auszuwählen, die die Wirksamkeit der Signalhistorie zeigen. Der Indikator berechnet Take-Profit- und Stop-Loss-Marken. Handbuch und Anleitung ->   HIER   / MT4-Version ->   H
The Volume by Price Indicator for MetaTrader 5 features Volume Profile and Market Profile TPO (Time Price Opportunity). Get valuable insights out of currencies, equities and commodities data. Gain an edge trading financial markets. Volume and TPO histogram bar and line charts. Volume Footprint charts. TPO letter and block marker charts including split structures. Versatile segmentation and compositing methods. Static, dynamic and flexible ranges with relative and/or absolute visualizations. Lay
TrendLine PRO MT5
Evgenii Aksenov
4.78 (49)
The Trend Line PRO indicator is an independent trading strategy. It shows the trend change, the entry point to the transaction, as well as automatically calculates three levels of Take Profit and Stop Loss protection Trend Line PRO is perfect for all Meta Trader symbols: currencies, metals, cryptocurrencies, stocks and indices Advantages of Trend Line PRO Never redraws its signals The possibility of using it as an independent strategy It has three automatic levels Take Profit and Stop Loss lev
MetaBands M5
Vahidreza Heidar Gholami
4.67 (3)
MetaBands verwendet leistungsstarke und einzigartige Algorithmen, um Kanäle zu zeichnen und Trends zu erkennen, sodass es Tradern potenzielle Punkte für den Einstieg und Ausstieg aus Trades bieten kann. Es ist ein Kanalindikator sowie ein leistungsstarker Trendindikator. Es umfasst verschiedene Arten von Kanälen, die einfach durch Verwendung der Eingabeparameter zusammengeführt werden können. MetaBands verwendet alle Arten von Warnmeldungen, um Benutzer über Marktereignisse zu informieren. Funkt
Wir stellen vor       Quantum Breakout PRO   , der bahnbrechende MQL5-Indikator, der die Art und Weise, wie Sie mit Breakout-Zonen handeln, verändert! Entwickelt von einem Team erfahrener Händler mit über 13 Jahren Handelserfahrung,       Quantum Breakout PRO       ist darauf ausgelegt, Ihre Handelsreise mit seiner innovativen und dynamischen Breakout-Zone-Strategie auf ein neues Niveau zu heben. Der Quantum Breakout Indicator zeigt Ihnen Signalpfeile auf Breakout-Zonen mit 5 Gewinnzielzone
Owl Smart Levels MT5
Sergey Ermolov
4.47 (36)
MT4-Version  |  FAQ Der Owl Smart Levels Indikator ist ein komplettes Handelssystem innerhalb eines Indikators, der so beliebte Marktanalysetools wie die fortschrittlichen Fraktale von Bill Williams , Valable ZigZag, das die richtige Wellenstruktur des Marktes aufbaut, und Fibonacci-Levels , die die genauen Einstiegslevels markieren, enthält in den Markt und Orte, um Gewinne mitzunehmen. Detaillierte Strategiebeschreibung Anleitung zur Verwendung des Indikators Berater-Assistent im Handel Owl H
Gartley Hunter Multi
Siarhei Vashchylka
5 (5)
Gartley Hunter Multi - An indicator for searching for harmonic patterns simultaneously on dozens of trading instruments and on all classic timeframes: (m1, m5, m15, m30, H1, H4, D1, Wk, Mn). Manual (Be sure to read before purchasing) | Version for MT4 Advantages 1. Patterns: Gartley, Butterfly, Shark, Crab. Bat, Alternate Bat, Deep Crab, Cypher 2. Simultaneous search for patterns on dozens of trading instruments and on all classic timeframes 3. Search for patterns of all possible sizes. Fr
Trend Line Map Pro MT5
STE S.S.COMPANY
4.67 (9)
Trend Line Map Indicator ist ein Add-On für Trend Screener Indicator. Es arbeitet als Scanner für alle Signale, die vom Trendscreener (Trendliniensignale) erzeugt werden. Es ist ein Trend Line Scanner basierend auf dem Trend Screener Indicator. Wenn Sie keinen Trend Screener Pro Indicator haben, funktioniert die Trend Line Map Pro nicht. It's a Trend Line Scanner based on Trend Screener Indicator. If you don't have Trend Screener Pro Indicator,     the Trend Line Map Pro will not work .
TrendDecoder Premium MT5
Christophe, Pa Trouillas
5 (1)
Top bewertet auf anderem MarketPlace -  Jetzt verfügbar auf METATRADER Identifizieren Sie Bereiche und die nächsten wahrscheinlichen Bewegungen     |    Erhalten Sie früheste Signale und die Stärke von Trends     |    Klare Ausstiegssignale vor Umkehrung     |    Erkennen Sie die Fibo-Levels, die der Kurs testen wird    |  Indikator, der nicht zurückverfolgt, nicht verzögert - ideal für den manuellen und automatisierten Trading - geeignet für alle Vermögenswerte und Zeiteinheiten - 50% Rabatt  
TPSpro TRENDPRO  - is a trend indicator that automatically analyzes the market and provides information about the trend and each of its changes, as well as giving signals for entering trades without redrawing! The indicator uses each candle, analyzing them separately. referring to different impulses - up or down impulse. Exact entry points into transactions for currencies, crypto, metals, stocks, indices!  -  Version MT4                  DETAILED DESCRIPTION        /       TRADING SETUPS       
Was: $249  Now: $99   Market Profile defines a number of day types that can help the trader to determine market behaviour. A key feature is the Value Area, representing the range of price action where 70% of trading took place. Understanding the Value Area can give traders valuable insight into market direction and establish the higher odds trade. It is an excellent addition to any system you may be using. Inspired by Jim Dalton’s book “Mind Over Markets”, this indicator is designed to suit the
Golden Spikes Detector
Batsirayi L Marango
5 (1)
Golden Spikes Detector This indicator is based on an advanced strategy primarily for trading spikes on Boom and Crash Indices. Complex algorithms were implemented to detect high probability entries only. It alerts on potential Buy and Sell entries. To trade spikes on the Deriv or Binary broker, only take Buy Boom and Sell Cash alerts. It was optimised to be loaded on 5-minute timeframe although multiple timeframe analysis is done in the background. Features ·             Desktop pop up and sound
Matrix Arrow Indicator MT5
Juvenille Emperor Limited
5 (14)
Matrix Arrow Indicator MT5   ist ein einzigartiger 10-in-1-Trend, der zu   100 % nicht neu gezeichnet   werden kann. Multi-Timeframe-Indikator, der für alle Symbole/Instrumente verwendet werden kann:   Forex ,   Rohstoffe ,   Kryptowährungen ,   Indizes ,   Aktien .  Der  Matrix Arrow Indicator MT5  wird den aktuellen Trend in seinen frühen Stadien bestimmen und Informationen und Daten von bis zu 10 Standardindikatoren sammeln, die sind: Durchschnittlicher Richtungsbewegungsindex (ADX) Rohstoff
Weitere Produkte dieses Autors
Die Trendhandelsstrategie „Super Trend Flexible Alert EA“ basiert auf dem gleichnamigen Indikator „Super Trend Flexible Alert“. Der Berater verwendet alle Informationen des Indikators, sodass der Berater nur drei Parameter hat: „Arbeitszeitrahmen“ – gibt den Arbeitszeitraum an, den Zeitrahmen, in dem der Indikator erstellt wird, und auch aus dem die „OHLC“-Daten entnommen werden. „Stop Loss“ ist die konstante Größe des Stop Loss, gemessen in „Punkten“ (Sie können ein Beispiel dafür sehen, was „
Beschreibung: Der Indikator „Marktstruktur HH HL LH LL“ ist ein leistungsstarkes und zugleich einfaches Instrument zur Analyse der Preisdynamik auf den Finanzmärkten. Dieser Indikator hilft Händlern und Investoren, Trendänderungen zu erkennen und wichtige Punkte in Preiszeitreihen zu identifizieren. Hauptbestandteile des Indikators: HH (Higher High): Der Höchststand, an dem der Preis über dem vorherigen Höchststand schließt. HH deutet auf einen sich verstärkenden Aufwärtstrend hin. HL (Hi
Der Trendindikator „   Super Trend Flexible Alert   “ hat ein Minimum an Einstellungen. Dieser Indikator ist so konzipiert, dass er so einfach wie möglich zu verwenden ist. Der Indikator zeigt den Trend mit einer farbigen Hauptlinie an („SuperTrend“-Linie, die Sie im Fenster „Datenfenster“ sehen können). Außerdem zeigt der Indikator an Stellen, an denen sich der Trend ändert, farbige Pfeile (   "STBuy"- und "   STSell"-Symbole, die Sie im Fenster "Datenfenster" sehen können       ). An Orten, an
Der Indikator zeigt eine bullische und bärische Divergenz. Der Indikator selbst (wie die normale Stochastik) wird in einem Unterfenster angezeigt. Grafische Oberfläche   : Im Hauptfenster werden grafische Objekte „Trendlinie“ erstellt – vom „Tief“-Preis zum „Tief“-Preis (für bullische Divergenz) und vom „Hoch“-Preis zum „Hoch“-Preis (für bärische Divergenz). ). Der Indikator zeichnet sein Fenster ausschließlich mit grafischen Puffern: „Main“, „Signal“, „Dot“, „Buy“ und „Sell“. Die Puffer „Kauf“
The Candle Length Indicator Alarm generates a sound alert, sends a push notification and an email when the size of the current candlestick changes. The size of the current candlestick can be measured in two ways: The first method: the size of the candlestick is measured from the beginning of the candlestick (from the OPEN price). The second method: the size of the candlestick is measured from current price. The indicator has the following settings: sound — a sound file from the folder: "...\Meta
The Buy Sell Color Background indicator changes the background color depending on position direction. It has three settings: Background color for BUY - background color for a Buy position Background color for SELL - background color for a Sell position Default background color - background color with no open position After you detach the indicator from a chart, its background color changes to Default background color .
The calculator of signals operates directly from the MetaTrader 5 terminal, which is a serious advantage, since the terminal provides a preliminary selection and sorts out signals. This way, users can see in the terminal only the signals that ensure a maximum compatibility with their trading accounts. The calculator of signals gives the answer to the one of the questions most frequently asked by users of the Signals service: "Will I be able to subscribe to the signal NNN, and what volume of the
Arrow Signal
Vladimir Karputov
Dieser Indikator gehört zur Kategorie "Stochastic". Ich habe versucht, die Anzeigesteuerung so weit wie möglich zu vereinfachen, daher werden die Mindesteinstellungen in den Eingabeparametern angezeigt: Dies ist die Auswahl eines Symbols für die Signalpfeile. Das „Buy“ Signal wird mit dem   ‚Buy Pfeil Code‘   Parameter und die „Sell“ codierte Signal wird mit dem   ‚Verkauf Pfeil Code‘   Parameter codiert. Die Signalpfeil-Codes für Signale (bitte Werte von 32 bis 255) verwenden, sind der Schrifta
Arrow Signal EA
Vladimir Karputov
Ein Expert Advisor basierend auf dem benutzerdefinierten Indikator. Suchen Sie bei jedem Tick nach einem Signal. Positionen werden durch ein entgegengesetztes Signal geschlossen. Kein Nachlaufen. Es gibt keinen Stop-Loss. Es gibt keinen Gewinn. Hat ein Minimum an Einstellungen Geldmanagement: Lot ODER Risiko   - Geben Sie Money Management ein Der Wert für "Money Management"   - Geldverwaltungswert Abweichung   - zulässiger Schlupf Pfeilcode kaufen   (Schriftart Wingdings) - Zeichencode aus der S
Ma Dema Alert
Vladimir Karputov
Der Indikator zeigt drei Linien an und überwacht zwei Arten von Kreuzungen. Drei Zeilen des Indikators: "   MA   " - langsamer Indikator "Moving Average", "   DEMA Slow   " - langsamer Indikator "   Double Exponential Moving Average" und "   DEMA Fast   " - schneller Indikator "Double Exponential Moving Average". Zwei Arten von Kreuzungen       : „   Alert Price MA   “ – der Preis kreuzt die   „MA“-Linie und   „   Alert DEMA DEMA   “ – die Linien kreuzen sich       „DEMA Langsam“ und   „DEMA Sch
Dieser Expert Advisor gehört zur Klasse der Dienstprogramme für den manuellen und halbautomatischen Handel. Die „   Pending Order at the Extremums of the Day   “ EA platziert zwei ausstehende Orders zu den Extremums des Vortages. Parameter "   Pending Orders: ...       " ermöglicht es Ihnen, die Art der Pending Orders auszuwählen: "   Buy Stop and Sell Stop   " oder "   Buy Limit and Sell Limit   "   .       extrem       'Low' versetzt nach unten). "   Neue ausstehende -> vorherige löschen   " a
Das Utility-Panel „Panel Partial Closure“ ist für die schnelle Teilschließung einer Position mit Gewinn gedacht. Es hat nur zwei Parameter: „   Teilschließung #1   “ und „   Teilschließung #2   “. Funktioniert für jedes Symbol und für jede „magische Zahl“ – das heißt, das Dienstprogramm ist hauptsächlich für den manuellen Handel gedacht. Wie es funktioniert: Beispielsweise haben Sie mehrere Positionen auf „EURUSD“, „Jump 100 Index“ und „XAUUSD“ (Gold). Das Dienstprogramm findet die Position mit
MQL5 „Täglicher Widerstand und Unterstützung“ Indikator – zeichnet tägliche Unterstützungs- und Widerstandslinien. Das Zeichnen erfolgt nur mit Hilfe von grafischen Objekten (Trendlinien) - Indikatorpuffer werden in diesem Indikator nicht verwendet. Der Indikator hat keine Einstellungen - die Suche nach Niveaus wird auf den letzten 500 Balken des Zeitrahmens "D1" durchgeführt und dieser Parameter ist im Code fest verdrahtet. Manueller Handel: Beim manuellen Handel wird empfohlen, diesen Indikat
Das Dienstprogramm „   Multi Symbol Trailing   “ verschiebt den Stop Loss für alle Positionen, die derzeit offen sind (Multi Symbol Trailing). Es soll in erster Linie den manuellen Handel unterstützen. Es gibt keine Einschränkungen für das Dienstprogramm, weder durch den Namen des Währungspaares noch durch die individuelle Kennung (Magic-Nummer) - das Dienstprogramm verarbeitet absolut alle Positionen, die derzeit offen sind. Die Maßeinheit für die Parameter „   Trailing Stop   “ und „   Trailin
Der Trendindikator „Trend Two Moving Average“ verwendet zwei Arten von Pfeilen, um Berechnungsergebnisse anzuzeigen – dies sind „Trend UP“ und „Trend DN“.       Pfeile "Trend nach oben"       sind gezogen       Von       Preis       'Niedrig'       Balken   ,       A       Pfeile "Trend-DN" -       Von       Preis       'hoch'. Der Trendsuchalgorithmus basiert auf der Analyse des Preises eines Balkens und der Werte von zwei „Moving Average“-Indikatoren. Die Trendrichtung wird auf dem aktuellen (
Anzeigefeld mit drei Zeitrahmen. Der Indikator wird in Form eines Panels basierend auf der Klasse CAppDialog erstellt. Das Panel kann minimiert oder mit der Maus im aktuellen Diagramm verschoben werden. Der Indikator zeigt drei Zeitrahmen des aktuellen Symbols im Panel. In der aktuellen Version verfügt der Indikator über eine Mindestanzahl an Einstellungen – dies sind die Parameter von drei Zeitrahmen: „Jüngerer Zeitrahmen“, „   Mittlerer   Zeitrahmen   “ und „   Älterer   Zeitrahmen   “. Beim S
Der Indikator „   Market Session Times   “ zeigt die Zeit von vier Handelssitzungen an: Asien, Europa, Amerika und Pazifik. Die Zeit der Handelssitzungen wird   im Format   festgelegt       GMT und ist daher überhaupt nicht vom Handelsserver abhängig. Dabei werden folgende Daten verwendet: Handelssitzung Stadt mittlere Greenwich-Zeit Asien Tokio Singapur Shanghai 00:00–06:00 01:00–09:00 Uhr 01:30–07:00 Uhr Europa London Frankfurt 07:00–15:30 Uhr 07:00–15:30 Uhr Amerika New York Chic
Constant stream
Vladimir Karputov
Handelssystem für eine Vielzahl von Handelsgeschäften. Ermöglicht Ihnen, den Saldo so einzustellen, dass er um Null herum wandert – wird für bestimmte Rabattaufgaben oder ähnliches verwendet. Konfiguriert für die Arbeit mit   Sicherungskonten.   Es kann nicht mehr als eine Position auf dem Markt geben   . Eine allgemeine Einstellung, der Parameter „   Step, Stop Loss, Take Profit   “, wird in Punkten gemessen (Beispiel für EURUSD: 1,00055-1,00045 = 10 Punkte). Der Berater stoppt den Handel (währ
Der Indikator zeigt Fraktale aus dem höheren Zeitrahmen. Es ist möglich, zwei Arten von Fraktalen anzuzeigen: „Normales Fraktal“ und „BW-Fraktal“. Betrachten Sie die Bildung des Fraktals „UP“. „Reguläres Fraktal“ ist ein sehr strenges Fraktal, bei dem jeder nachfolgende „hohe“ Preis (links und rechts vom zentralen Balken) kleiner ist. Im „BW-Fraktal“ hingegen gibt es nur eine Bedingung: Der zentrale Balken (sein „hoher Preis“) muss der höchste sein. Optisch ist der Unterschied zwischen diesen b
KI-Unterstützungswiderstand Dies ist ein Indikator, der nach den Linien „Unterstützung“ und „Widerstand“ sucht. Die Suche erfolgt mithilfe eines Algorithmus zur numerischen Analyse und Datenverarbeitung. Es stehen drei Suchoptionen zur Verfügung („Modus #1“, „Modus #2“ und „Modus #3“). Jede dieser Optionen unterscheidet sich in ihrem internen Algorithmus (im Moment handelt es sich hierbei um vollständig interne Einstellungen, sie stehen dem Benutzer nicht zur Verfügung). Wir können sagen, dass s
Open Time Manager
Vladimir Karputov
Das Dienstprogramm „   Open Time Manager   “ öffnet eine Position zu einem bestimmten Zeitpunkt und aktiviert dann das klassische Trailing. Die Uhrzeit ('   Stunde   ':'   Minute   ') wird immer in der GMT-Zeitzone mit einem GMT-Ofset-Offset eingestellt. Über den Parameter „   Handelsmodus   “ können drei Optionen zum Eröffnen einer Position ausgewählt werden: '   KAUFEN   ' '   VERKAUFEN   ' „   KAUFEN und VERKAUFEN (gleichzeitig)   “ '   OFF (kein Handel, nur Nachlaufarbeiten)   ' Der vierte
Indikator       zeigt „Unterstützungs“- und „Widerstands“-Linien (diese Linien werden mit dem Zeichenstil DRAW_LINE gezeichnet, d. h. sie sind keine grafischen Objekte). Links und rechts des „Signalbalkens“ wird nach neuen Minima und Maxima gesucht – der „Signalbalken“ ist die konventionelle Mitte jeder neuen Konstruktion. Warum ist das Wort „Flexibel“ im Namen des Indikators enthalten? Denn wir haben die Möglichkeit, eine unterschiedliche Anzahl an Balken links ('Left Bars') und rechts ('Right
Das Dashboard scannt die Messwerte von zwei Indikatoren: „MACD“ und „Stochastic“. Zeigt Signale in drei Spalten an: für MACD, für Stochastic und die resultierende Spalte (wenn das Signal für beide Indikatoren gleich ist). Das Scannen kann in einem oder mehreren Zeitrahmen ausgewählt werden. Wenn Sie alle Zeitrahmen deaktivieren, wird das Dashboard weiterhin geladen, jedoch mit Einstellungen speziell für solche Fälle. Signale werden immer auf den Nullbalken (der Nullbalken ist der Balken ganz rec
ATR Bands Alert
Vladimir Karputov
ATR Bands Alert ist ein Kanalindikator, bei dem die Kanalbreite als konstanter Multiplikator („Multiplier“) und dem Wert des Indikators „Average True Range“ berechnet wird. Im Gegensatz zu Bollinger Bands wird die Bandbreite nicht so oft geändert – beim ATR Bands Alert-Indikator haben die Bänder oft lange gerade Linien. Die Interpretation des ATR-Band-Alarms basiert auf der Tatsache, dass sich der Preis die meiste Zeit innerhalb der Bänder befindet. Wenn der Preis eine der Grenzen erreicht, k
Auswahl:
Keine Bewertungen
Antwort auf eine Rezension
Version 1.11 2023.03.05
Small error in the code