• Übersicht
  • Bewertungen
  • Diskussion
  • Neue Funktionen

MTF Precise Price Action Arrow Filtered

Schließlich wurde das Non-Repaint-Price-Action-Trading-Tool offiziell veröffentlicht.

[V1.60] MTF Präziser Preisaktionspfeil gefiltert.
Der MTF Precise Price Action Arrow-Indikator nutzt die Kombination mehrerer Indikatoren, um die Marktrichtung zu stärken.

Das Erkennen von Preisbewegungen und das Messen ihrer Stärke ist eine subjektive Angelegenheit und eine Technik, deren Beherrschung Jahre dauert.

Der Zweck des Indikators besteht darin, die Ablesung der Preisbewegungsrichtung so objektiv wie möglich zu gestalten.

Die Philosophie :

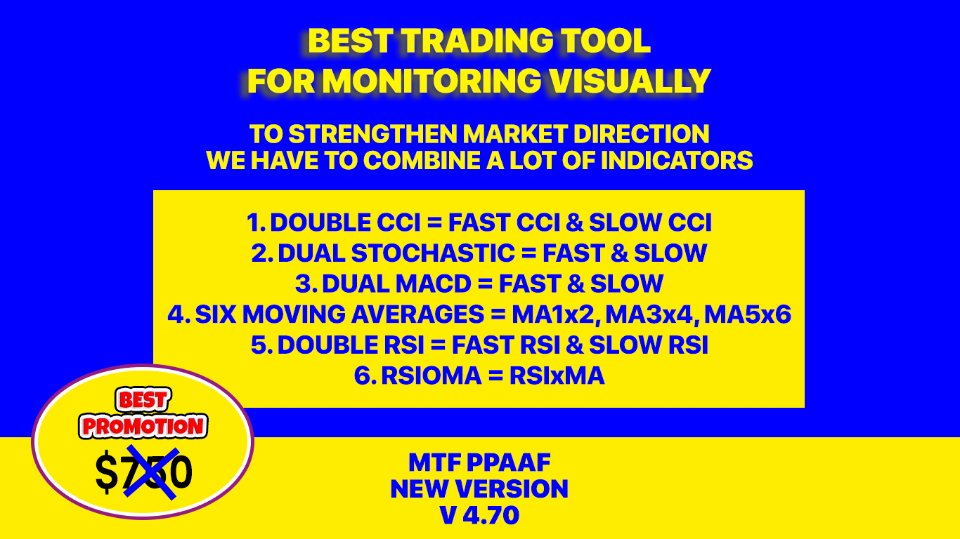
Die Verwendung nur eines Handelsindikators ist nicht sehr überzeugend. Deshalb kombinieren wir mehrere Indikatoren, um unsere Analyse der Marktrichtung zu stärken.

Die Preisaktionsbewegung kann dann mithilfe von 6 Indikatoren gefiltert werden:

RSIMA
Dual MACD (Neue Version 1.3!)
Dual Stochastic (Neue Version 1.3!)
CCI
Vier gleitende Durchschnitte (Neue Version 1.6! Nicht nur zwei MA)
Doppelter RSI (Neue Version 1.2!)
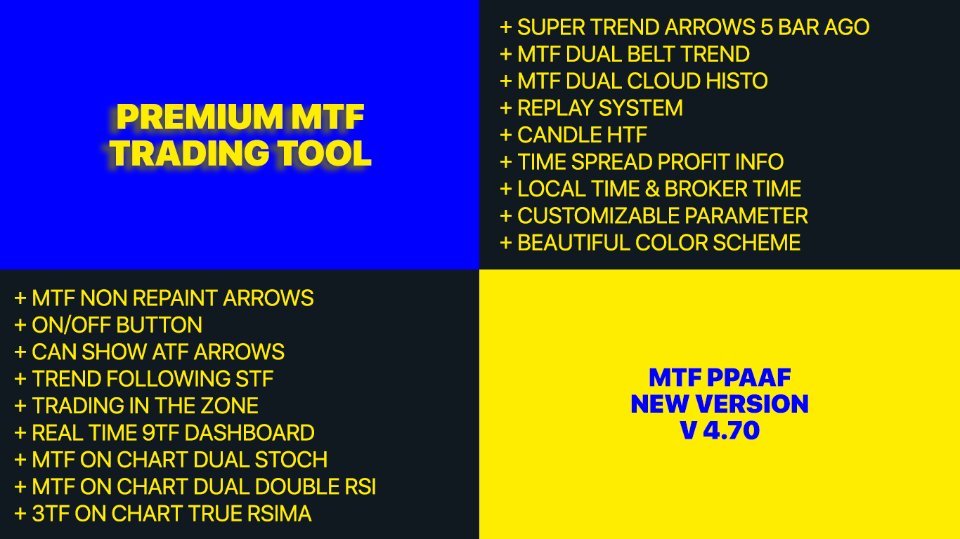
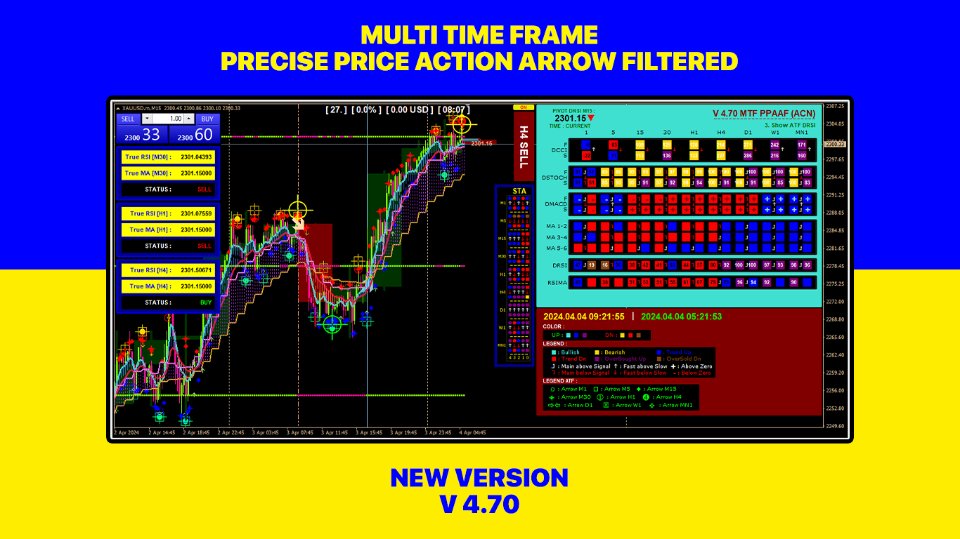
Die Stärke der Richtung der Preisbewegung kann dann durch Überwachung des Echtzeit-9TF-Dashboards ermittelt werden.

Der 9TF-Dashboard-Monitor zeigt uns die Daten von Four Moving Average, RSIMA, Double RSI, Dual MACD, Dual Stochastic und CCI.

Ein-Klick-Schaltfläche, um den Indikator anzuzeigen oder auszublenden
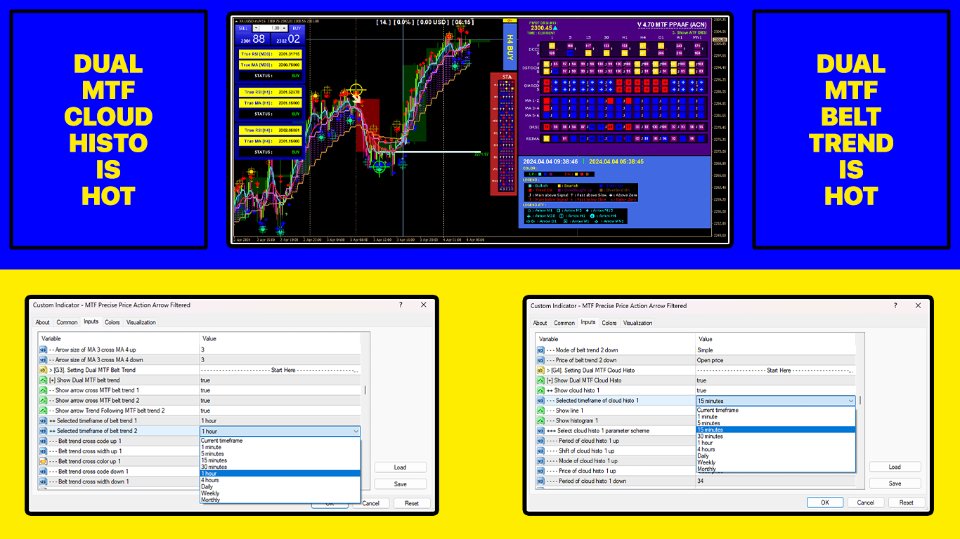
9TF Echtzeit-Dashboard-Monitor
Überwachung von 9TF Four Moving Average, d. h. MA 1x2 und MA 3x4
Überwachung, ob die schnelle MA-Linie über oder unter der langsamen MA-Linie liegt
Überwachung des Winkels von schnellem MA und langsamem MA
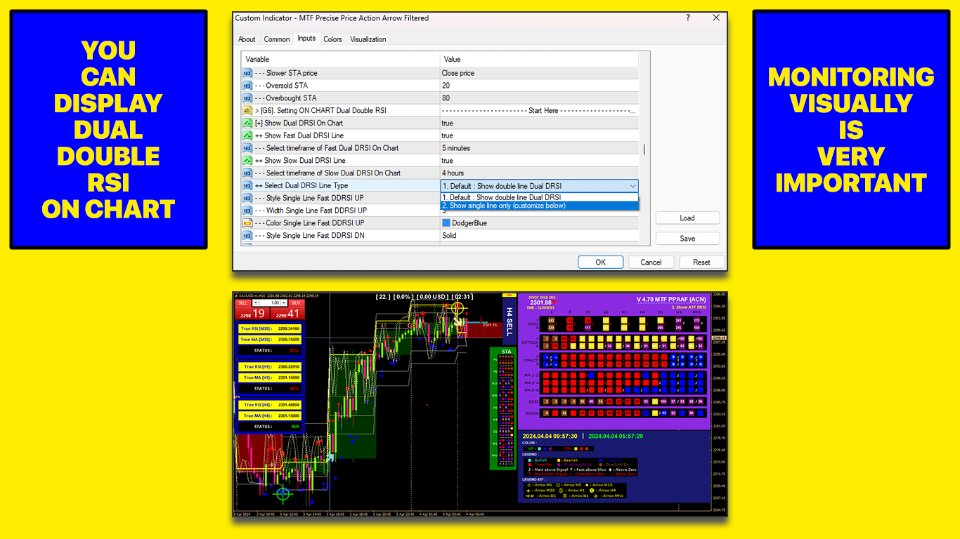
Überwachung von 9TF Double RSI, d. h. Fast RSI und Slow RSI
Überwachung, ob die schnelle RSI-Linie über oder unter der langsamen RSI-Linie liegt
Überwachung von 9TF Dual MACD, d. h. schneller MACD (MACD 1) über oder unter langsamem MACD (MACD 2) und oben oder unten
Überwachung, ob die Haupt-MACD-Linie über oder unter der Signal-MACD-Linie liegt
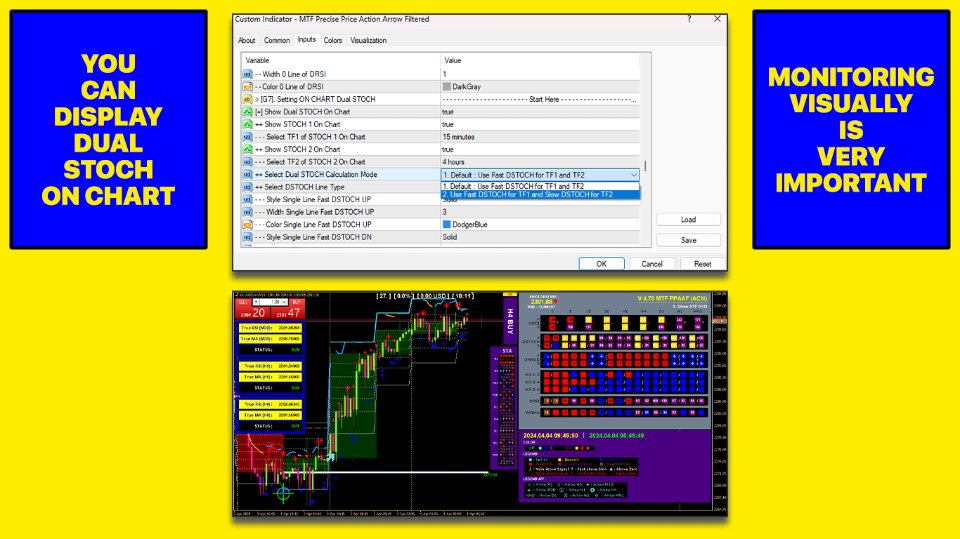
Überwachung von 9TF Dual Stochastic, d. h. Fast Stochastics (Stochastik 1) über oder unter Slow Stochastics (Stochastik 2) und nach oben oder unten
Überwachung, ob die stochastische Hauptlinie über oder unter der stochastischen Signallinie liegt
Überwachung von 9TF CCI, d. h. der Position auf der OBOS-Linie und der aktuellen Bewegung
Überwachung von 9TF RSIOMA, d. h. RSI-Linie oberhalb oder unterhalb der MA-Linie
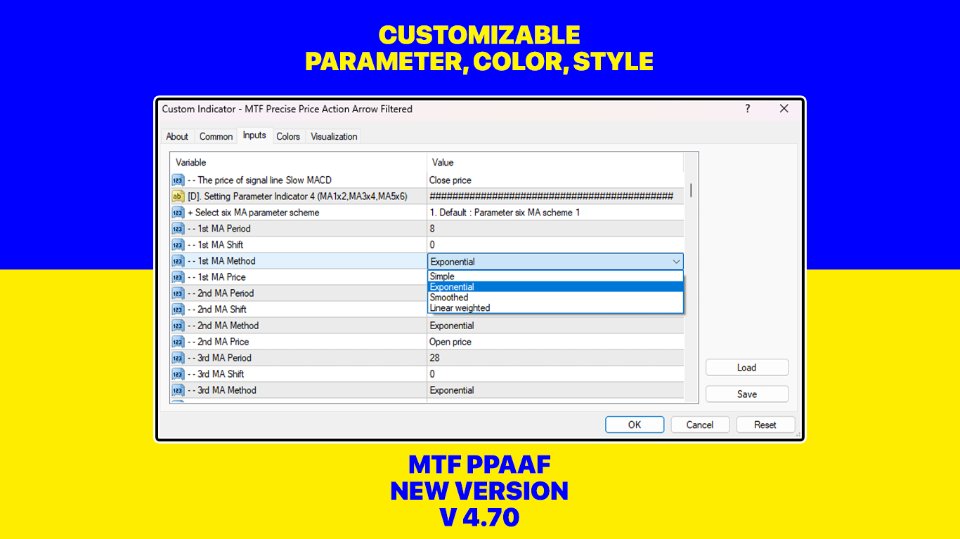
Möglichkeit, Parameter festzulegen und den Zeitrahmen nach Ihren Wünschen auszuwählen
Möglichkeit, Legenden ein-/auszublenden
Möglichkeit, die Anzahl der Balken zu erhöhen/verringern, der Standardwert ist 800 bar
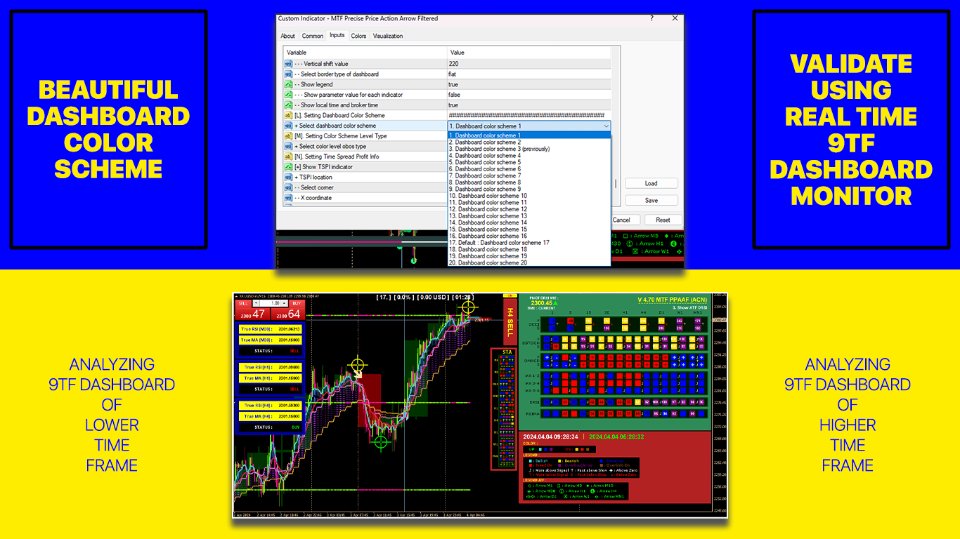
Möglichkeit zur Auswahl von bis zu 10 Dashboard-Farbschemata
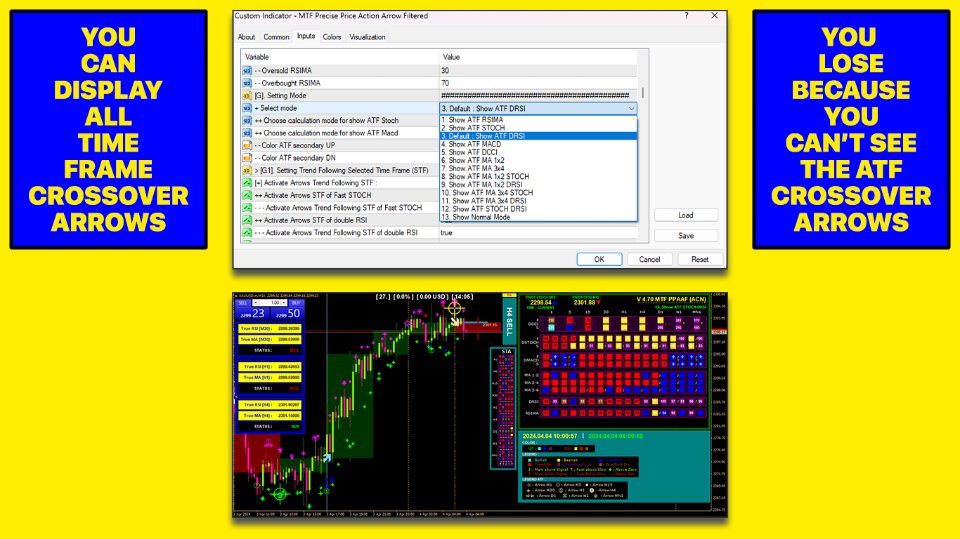
Dieser Indikator kann den RSIMA-Pfeil für den von Ihnen gewählten Zeitrahmen anzeigen
Dieser Indikator kann den MACD-Pfeil für den von Ihnen gewählten Zeitrahmen anzeigen
Dieser Indikator kann den stochastischen Pfeil für den von Ihnen gewählten Zeitrahmen anzeigen
Dieser Indikator kann den MA 1x2- und MA 3x4-Pfeil für den von Ihnen gewählten Zeitrahmen anzeigen
Dieser Indikator kann den Doppel-RSI-Pfeil für den von Ihnen gewählten Zeitrahmen anzeigen
Nicht neu lackierte Pfeile
MTF, d. h. der Zeitrahmen kann geändert werden
Möglichkeit, alle Zeitrahmenpfeile oder nur den ausgewählten Zeitrahmen anzuzeigen
[Neue Funktion 1.60] Möglichkeit, die vier MA-Linien im Diagramm anzuzeigen/auszublenden.
Es stehen insgesamt 27 Modi zur Auswahl:

1. ATF FAST STOCH anzeigen
2. ATF FAST MACD anzeigen
3. ATF MA 1-2 anzeigen
4. ATF DRSI anzeigen
5. ATF RSIMA anzeigen
6. Ausgewählte TF von FAST STOCH anzeigen
7. Ausgewählte TF von FAST MACD anzeigen
8. Ausgewählte TF von MA 1-2 anzeigen
9. Ausgewählte TF von DRSI anzeigen
10. Ausgewählte TF von RSIMA anzeigen
11. Trendfolgendes ATF von FAST STOCH anzeigen
12. Trendfolgendes ATF von FAST MACD anzeigen
13. Zeigen Sie den Trend nach ATF von MA 1-2 an
14. Trendfolgendes ATF von DRSI anzeigen
15. Trendfolgendes ATF von RSIMA anzeigen
16. Trend nach ausgewähltem TF von FAST STOCH anzeigen
17. Trend nach ausgewähltem TF von FAST MACD anzeigen
18. Trend nach ausgewähltem TF von MA 1-2 anzeigen
19. Trend nach ausgewähltem TF von DRSI anzeigen
20. Trend nach ausgewähltem TF von RSIMA anzeigen
21. Ausgewählte TF von STOCH, MACD, MA 1-2, DRSI anzeigen, gefiltert nach Trend nach RSIMA
22. Trend nach ausgewähltem TF von DUAL STOCH anzeigen
23. Trend nach ausgewähltem TF von DUAL MACD anzeigen
24. Trendfolge ATF MA 1-2 anzeigen, gefiltert nach Trendfolge ausgewählter TF von Fast STOCH (Neue Version 1.5!)
25. Trendfolge-ATF-MA 1-2 anzeigen, gefiltert nach Trendfolge ausgewählter TF von Fast MACD (Neue Version 1.5!)
26. Trendfolge-ATF-MA 1-2 anzeigen, gefiltert nach Trendfolge ausgewählter TF von DRSI (Neue Version 1.5!)
27. Trendfolge ATF MA 1-2 anzeigen, gefiltert nach Trendfolge ausgewählter TF von RSIMA (Neue Version 1.5!)
Dieser Indikator hat eine Reihe von Versuchen durchlaufen. Die Programmiercodes wurden mit großer Sorgfalt geschrieben.

Machen Sie sichere Einträge mit dem besten Non Repaint Price Action-Handelsindikator MTF PPAAF.

Holen Sie sich jetzt und handeln Sie wie ein Profi.

Danke schön.
Empfohlene Produkte
Black series MT4
Dmitriy Kashevich
1 (1)
Black series MT4 - The indicator is designed for trading on binary options with Timeframe M1-M5-M15 Multicurrency (Works on cryptocurrency and currency pairs) The signal appears when the candle opens Up to 90% correct signals There is no signal redrawing at all Can be used with other indicators. Good for scalping! In Settings there is: -Indicator working methods -I Allert Arrow color Red signal down Blue signal up Also watch the video how the indicator works and signals
999 USD
Binary Luck
Yaroslav Varankin
A good and reliable tool if you follow the rules of money management Developed according to its own strategy on a unique algorithm The indicator is completely sharpened for binary options Binary Luck is very easy to use, nothing needs to be configured Just add to the chart and you can start trading Perfect for both beginners and experienced traders Signals are simple and straightforward Up arrow buy Down arrow sale Recommended time of expiration and 1 candle For one deal no more than 3% of the d
600 USD
Jeslyn
Justine Kelechi Ekweh
Dabei handelt es sich um ein Mehrzwecksystem, das sowohl für manuelle Forex-Händler geeignet ist, entweder als Scalper-System oder als Strategie für den Einstieg in ein sehr starkes Momentum, für Händler von binären Optionen oder für die Verwendung durch universelle Automate imisisierungshandel. Jeslyn ist eine Strategie, die auf jahrelanger Forschung basiert und sich auf eine bestimmte Preisaktionsstrategie konzentriert. Es mag wie ein einfacher Pfeilindikator aussehen, verfügt aber über
3 500 USD
This indicator is great for trading on the pair  and many more. The indicator itself uses augmented accuracy mathematical strategies, but so far they are optimized for some currency pairs. Many settings can be configured on the working panel. There are two panels on the chart, for visualization and settings. He displays his solution on the graph in the form of icons. There are only two types of icons. In the tester, it works fine by default in the settings. The second panel for counting the res
800 USD
Skalping-Sofortanzeige. Ein Signal zum Kauf oder Verkauf zusammen mit dem Basiswert des Indikators wird durch den Pfeil gegeben. Als starkes Signal gilt, wenn der Pfeil und der Kellerindikator, der vier Zeitrahmen anzeigt, in der Vorhersage übereinstimmen. Dieser Indikator enthält viele Algorithmen und Aufgaben, die auf ein Ergebnis reduziert wurden, das der Skalping-Instant-Indikator liefert, nämlich den Händler über die Richtung des Marktes informiert. So gibt er 1. Scalping-Signal (A
770 USD
BinaryScalping
Andrey Spiridonov
BinaryScalping is a professional indicator for trading binary options and scalping. The algorithm of the indicator is based on the calculation of pivot points for each time period separately, the location of the price of the trading instrument relative to the pivot points is analyzed and the probability of a trading operation is calculated. The indicator has a built-in filter of trading signals based on the global trend. The indicator is installed in the usual way and works with any trading inst
1 200 USD
Trend Indicator This Indicator detects the essential momentum in the market and lets you know when the market has a potential trend Green means we are going higher and Red Means we are going Lower,  You can customise the Line to Any Color.  The alerts come in immediately there is a potential signal Defaults Length : 55 This is the Depth of your averaging calculation. The bigger it is the more noise is filtered.  55 Is the Best Optimum Setting For This Indicator
999 USD
This Indicator is use the ZigZag to calculate the Upper and  Lower Bound and the uptrend and the downtrned. Red for downtrend, Green for uptrend and Yellow is for the horizontal trend this horizontal trend also bookmarked the upper limited and the lower limited the the price swings.  Or in simple the Support and the Resistance level. However, You may use the Heikin Ashi to confirm the trend of the buy sell signal above. I cannot guarantee the win rate, Nevertheless, you must study well the timef
1 000 USD
Three Peaks
Mpendulo Chiliza
Introducing the revolutionary 3 Peaks indicator on MQL5 – your ultimate trend-spotting companion! As an experienced trader and dedicated seller, I am thrilled to offer you a powerful tool that brings unprecedented accuracy and reliability to your trading endeavors. The 3 Peaks indicator boasts an impressive capability: it identifies and alerts you on-screen whenever three consecutive peaks are detected. No matter the representation chart, time-frame, or currency pair/commodity you're trading, t
750 USD
Night Crawler
Maduabuchi Kingsley Agoka
Night Crawler is a moving average trend trading strategy and delivers over 89 to 90% wining ratio when applied and traded properly. It work for all Timeframe and for every currency pairs trading on the MQL4 Platform.  To have a clear trend bias of the market Apply EMA 50 and EMA 21 to your chat to get the best out of this strategy for your overall Trend View.  The Best Timefarme to use is H1 or H4 ENTRY RULES : For Buy trades :  1. Wait for EMA 21 to Cross Above 50 2. When the arrow (Bl
1 000 USD
Diver Hurst
Oleksandr Medviediev
Divergence Formation Hurst (hereinafter "Diver") is based on Hurst exponent used as a measurement of long term memory of time series. Classic (regular) and Reversal (hidden) Divergences - at your choice. Adjustable sizes and all parameters Flexible settings including VOID levels (alert function in place, arrows to show in which direction to trade) No re-paint / No re-draw (must set CalcOnOpenBar =false) "SetIndexBuffer" available for all variables (can be used in EA) Auto-detect 4- and 5-digit p
250 USD
BinaryUniversal
Andrey Spiridonov
BinaryUniversal is a signal indicator for binary options and Forex. In its work, the indicator uses a complex algorithm for generating signals. Before forming a signal, the indicator analyzes volatility, candlestick patterns, important support and resistance levels. The indicator has the ability to adjust the accuracy of the signals, which makes it possible to apply this indicator for both aggressive and conservative trading. The indicator is set in the usual way, it works on any time period and
1 200 USD
Description of ZiqScalping The ZiqScalping indicator is designed to trade both currencies with high volatility and trend-oriented currencies. Recommended time frame for scalping: М5, М15, М30. Recommended timeframe for intraday trading and above: H1, D1. Works on all pairs! Settings : See screenshots. Decision principle! The indicator is based on 2MA, MACDI,OSMA. Arrows with trend directions and 2MA lines are shown graphically. Calculations of volumes by positions are entered into
1 120 USD
Towers
Yvan Musatov
Towers - Trend indicator, shows signals, can be used with optimal risk ratio. It uses reliable algorithms in its calculations. Shows favorable moments for entering the market with arrows, that is, using the indicator is quite simple. It combines several filters to display market entry arrows on the chart. Given this circumstance, a speculator can study the history of the instrument's signals and evaluate its effectiveness. As you can see, trading with such an indicator is easy. I waited for an a
777 USD
Bot DCP
Maryna Shulzhenko
Professional robot Bot DCP, which implements a trading strategy using different indicators and on different time intervals. Goes through the entire history and many currency pairs with one single setting. Unique trading system! You can work on any hourly period, any currency pair and on the server of any broker. It is recommended to work on liquid Forex pairs with a low spread. The lower the commission and spread, the greater the profit. You can start using it with $10,000 and 0.01 lot. The Exp
799 USD
LDS Scalper
Justice Chinemelum Clement
PLEASE LEAVE US A 5-STAR REVIEW   LDS Scalper User Manual+ Extra LDS CSDIF INDICATOR + Training Videos   ABOUT LDS SCALPER INDICATOR STRATEGY Built on  15+ years of trading experience. LDS Scalper is a very powerful  trading indicator for scalping strategy, returns very high accuracy rate in forex, futures, cryptocurrencies, stocks and indices. This indicator displays arrow signals based on price action information with high accuracy. The LDS Scalper Indicator strategy when applied can turn a ne
390 USD
This indicator is created by considering volume divergence with price that is outcome of Bollinger band and Envolpes indicators crossing. It won’t repaint.  It is providing 1 market and three pending orders.  If it is followed with patient, it is providing remarkable profit at the end.  This indicator will be on sale soon on expert advisor. Target is calculated for buy orders as follow 1. 50 pips standard 2. Top Bollinger band 3. Sell Signal Target is calculated for buy orders as follow 1. 50
2 799 USD
Der Indikator Silver STO (eine der Versionen, analog zu Gold STO) - STABLE TRADE OPTION ist für den automatischen Handel mit binären Optionen bestimmt.  LESEN SIE SORGFÄLTIG!!!!! WICHTIG Gewinnrate: 71% in den letzten 5 Jahren Geldverwaltung: 0,3% der Einlage Diese Version des Indikators ist nur für den Handel um 18:01 Uhr Moskauer Zeit mit Ablaufzeiten von 1 bis 15 Minuten eingerichtet. Das Signal erscheint innerhalb der Kerze und sofort ein Geschäft zu öffnen, wenn Sie Stecker setze
1 600 USD
Infinity Trend Pro
Yaroslav Varankin
1 (1)
This is a trend indicator without redrawing Developed instead of the binary options strategy (by the color of the Martingale candlestick) Also works well in forex trading When to open trades (binary options) A signal will appear in the place with a candle signaling the current candle It is recommended to open a deal for one candle of the current timeframe M1 and M5 When a blue dot appears, open a deal up When a red dot appears, open a trade down. How to open trades on Forex. When a signal is rec
1 000 USD
NostradamusMT4
Andrey Spiridonov
1 (1)
NostradamusMT4 is a powerful indicator from the set of professional trader. The indicator is based on Andrei Spiridonov's original price calculation method (ESTIMATED PRICE) for the current candle price. Advantages The indicator does not redraw. It works on any timeframes. Works with any trading instruments. Perfectly suitable for scalping and trading binary options. Parameters Color - color of the ESTIMATED PRICE FUTURE line. How to work with the indicator The indicator forms the ESTIMATE
1 800 USD
This system never paints.   This system created by using Envolpes bands and reverse bar count.   This indicator is only working in M5 period.   This system is for long term and profitable.   Signals are shown as arrows. as an optional limit orders.   You can set a voice alarm or email notification.   You can fins our other products from link : https://www.mql5.com/en/users/drbastem/seller   Also, you can ask all your questins from email : haskayafx@gmail.com or mobile : +90 530 867 5076 or @Meh
2 799 USD
Manuscript is a time-tested indicator, many tests have been conducted in its use, I will tell all buyers my recommendations on using forex, cryptocurrency or binary options This indicator gives a signal exactly at the close of the candle of the selected period The arrow does not disappear after the signal, you can set up email notifications I recommend using it on the period H1,H4,daily If you are aware of its work, you will be able to trade in a plus In the future I will give you my re
266 USD
2 Copies left.. Royal Trend Indicator will close for public from 01 September 2022. Royal Trend Indicator   This is a Trend Indicator for MT4 Providing Signal To Enter The Position At The Best Time    It can be applied to any financial assets:  F orex, Cryptocurrencies, Metals, Stocks, Indices .    Benefits of the Royal Trend Indicator Entry Signals At The Best Possible Level The indicator algorithms allow you to find the ideal moments to enter a deal (buy or sell an asset), which increa
999 USD
Binary Eye
Yaroslav Varankin
the indicator is designed only for binary options settings are not brought to ideal at the moment different parameters are being tested at the moment the tool gives quite accurate and good results for newbies in binary options may not be a bad start for professionals a good addition to the existing strategy and experience signals. blue dot from below buy. red dot on top sale.
500 USD
Entfesseln Sie die Kraft des Gewinns im Bereich binärer Optionen mit dem "Eagle Eye Indicator" für MT4 Machen Sie sich bereit für eine revolutionäre Reise in die Welt der binären Optionen mit dem beeindruckenden "Eagle Eye Indicator" für MetaTrader 4 (MT4). Dieses revolutionäre Werkzeug steht bereit, um Ihr Trading-Erlebnis zu verändern und mit chirurgischer Präzision und beispiellosen Gewinnmöglichkeiten zu bereichern. Tauchen Sie ein in eine Welt, in der die Grenzen des Potenzials überwunden u
450 USD
Smooth price for Monarch MT4
Konstantin Gruzdev
3.67 (3)
The Smooth Price technical indicator is used for plotting a smoothed line as close to the price of the financial instrument as possible, and serves to eliminate its noise components. The indicator is part of the Monarch trading system, but here it is presented as an independent technical analysis tool. The indicator is based on the cluster digital filter , which, unlike the ClusterSMA , is applied directly to the price time series. Smooth Price does not redraw (except the very last, zero bar) an
999 USD
GeoWprPro
Georgij Komarov
WPR by Profile, or WPR for Professionals Geo_WprPro is one of the well-known currency profile indicators. It simultaneously displays two WPR indicators with different parameters in the matrix form on all timeframes of multiple currency pairs forming the currency profile . As follows from the description, " WPR is a leading indicator that often goes ahead of the price chart. The oscillator frequently reaches extreme values before the price reversal as if anticipating that event: it almost always
30 USD
This indicator allows you to see the strength of the trend on all timeframes. It can be used for all currency pairs. The indicator can be displayed in the form of a column (from left to right): status buy / sell / strong buy / strong sell, strength of the trend in percentage, pips last candle, body candle now, remaining time, and the timeframe of M1 to MN. Information contained below (from left to right): total trend percent, sell percent, buy percent.
500 USD
ReboltP
David Theodore Caro-greene
Rebalance Overlay Technology (Rebolt) enables the trader to visualize the flow of money from one chart to another chart. Rebolt Probability indicates the probability that money has flowed from one chart to another chart for a specified length of time over a number of intervals specified by the user. When Rebolt reads Cyan or Blue these are buying signs good for the length of time specified by the user or until a conflicting signal arises. When Rebolt reads Violet or Red there are selling signs
1 415.69 USD
**Vorstellung des Binary Smart Systems: Ihr ultimativer Handelsbegleiter** Das Binary Smart System ist nicht nur ein Indikator; es ist ein ausgeklügeltes Handelswerkzeug, das sorgfältig entwickelt wurde, um Händlern eine punktgenaue Genauigkeit und rechtzeitige Signale in verschiedenen Märkten zu bieten. Aufgebaut auf einer Grundlage aus hochmodernen Algorithmen und einer umfassenden Sammlung von technischen Indikatoren ist dieses System der Schlüssel, um Handelserfolg zu entfesseln. **Best
450 USD
Käufer dieses Produkts erwarben auch
Shepherd Harmonic Pattern
Abdullah Alrai
4.45 (33)
Dieser Indikator erkennt harmonische Muster, die manuell oder automatisch auf dem Chart gezeichnet wurden. Sie können das Benutzerhandbuch unter diesem Link einsehen: Fügen Sie Ihre Bewertung hinzu und kontaktieren Sie uns, um es zu erhalten. Es gibt eine kostenlose Version, um dieses Produkt auf MT4 auszuprobieren. Sie können es verwenden, um Gartley- und Nenstar-Muster zu erkennen: https://www.mql5.com/en/market/product/30181 Sie können die vollständige MT4-Version von kaufen: https://www.mql5
1 250 USD
Natürlich, hier ist die Übersetzung in Deutsch: Vorstellung des Astronomie-Indikators für MT4: Dein ultimativer himmlischer Trading-Begleiter Bist du bereit, deine Trading-Erfahrung auf himmlische Höhen zu heben? Suche nicht weiter als unseren revolutionären Astronomie-Indikator für MT4. Dieses innovative Tool übertrifft herkömmliche Trading-Indikatoren und nutzt komplexe Algorithmen, um dir unvergleichliche astronomische Einblicke und präzise Berechnungen zu bieten. Ein Universum an Information
1 250 USD
Wir stellen Ihnen ON Trade Waves Patterns Harmonic Elliot Wolfe vor, einen fortschrittlichen Indikator, der entwickelt wurde, um verschiedene Markt-Muster mithilfe sowohl manueller als auch automatischer Methoden zu erkennen. Hier ist, wie er funktioniert: Harmonische Muster: Dieser Indikator kann harmonische Muster erkennen, die auf Ihrem Chart erscheinen. Diese Muster sind für Trader, die die Theorie des harmonischen Handels praktizieren, wie sie in Scott Carney's Buch "Harmonic Trading vol 1
800 USD
Diamond Grail
Dmitriy Kashevich
The universal indicator Diamond Grail which received such a name is not so simple! The indicator has been tested for over a year by our experts! One of the best arrow indicators that is perfect for binary options and forex trading, If you trade on binary options, the best ragtime for it is from 3 minutes to a maximum of 5 minutes An arrow appears on the previous candle. If you trade forex, then the opening time from candle to candle Forex result From 40 To 1324 pips! Profitability
800 USD
Bei diesem Indikator handelt es sich um eine Marktanalysemethode, die auf dem Artikel "Mathematische Formel für Marktprognosen" von W.D. Gann basiert, der auf Quadrat-von-Neun- und Quadrat-von-44-Methoden basiert. Benutzerhandbuch: Add Your review And contact us to get it Sie können die vollständige MT5-Version kaufen von: https://www.mql5.com/en/market/product/28669 Sie können auf MT4 kostenlos testen: https://www.mql5.com/en/market/product/15320?source=Site +Profile+Seller#!tab=re
1 250 USD
Target Striking
Dmitriy Kashevich
Target Striking - One of the best binary options trading tools! It is set up so powerfully that you can trade not only on currency pairs, but also on raw gold oil! You can also try on cryptocurrency! Ideal for trading on currency pairs, the percentage of reliable transactions is more than + 75% The trading tool is already set for the best profit! Only Target Striking can unlock the potential of the trading market for you! With it, the signals are even and accurate without redrawing,
1 650 USD
Displays the readings of the Moving Average indicator on the older timeframe. Wishes for other types of Moving Average are accepted (however, the possibility of implementation depends on the type of algorithm). It doesn't make sense to apply it to the current timeframe - there are free indicators for this. Does not redraw the readings starting from the first bar. It is very important to have and match the history of the timeframes on which it is installed and set in the settings. A simple built-
1 000 USD
Automatic, live & interactive picture of all trendlines. Assign push, email and sound alerts to the lines of your choice and be informed about price rollback, breakout, rollback after breakout, number of rollbacks, line expiration by double breakout. Correct, drag or delete the lines and interactively tune the line system. https://youtu.be/EJUo9pYiHFA . Chart examples https: //www.mql5.com/en/users/efficientforex Price Interaction Events All events are effective immediately and only after on
1 000 USD
The indicator displays the probable ( Support and resistance ) levels. The indicator draws horizontal and trend levels of support and resistance. The indicator settings: Trends - the mode for displaying trend lines or horizontal lines of support and resistance Yes - display trend lines only No - display horizontal lines only UseResource - use the resources built into the indicator. Yes - use the ZigZag indicator from the resources of the product. No - use a custom ZigZag indicator. HistoryBar -
3 800 USD
The indicator of a Professional Trader is an arrow indicator for predicting the direction of price movement. I have been working on this indicator since 2014. You can use this indicator as your main indicator, use its entry signals, and use it as your only indicator to find entry points. About the product: Recommended TF [H4-D1-W1]   . The indicator predicts the direction of the next candle. Fits a variety of tools; Flexibility in settings for different instruments and intervals through the
3 000 USD
The [GRAFF] III manual trading system is based on multiple MetaTrader (MT4) indicators. Together, the entire PACK of GRAFF III indicators makes an advanced trading tool. The system consists of over 20 different custom-built indicators which have been carefully selected and tested in the long term to produce strong and efficient trading signals. The particular indicators are based on different mathematical formulas, so the entire system is calibrated to remove false signals from its own indicator
5 990 USD
You can fins our other products from link : https://www.mql5.com/en/users/drbastem/seller   Also, you can ask all your questins from email : haskayafx@gmail.com or mobile : +90 530 867 5076 or @MehmetBastem    on telegram application This indicator is used to determine the trend. Standard Osma indicator is used. It has the indicator warning system: beep, e-mail and has three types of alerts, including messages to mobile phone. It shows the best performance on the chart of 5 minutes. When the
1 000 USD
You can fins our other products from link : https://www.mql5.com/en/users/drbastem/seller   Also, you can ask all your questins from email : haskayafx@gmail.com or mobile : +90 530 867 5076 or @MehmetBastem    on telegram application This indicator is used to determine the trend. Standard Three Moving Average and ADX indicators are used. It has the indicator warning system (audio, e-mail) and three types of alerts, including messages to mobile phone. It shows the best performance on M5. When
2 799 USD
This indicator is used to determine the trend. Standard Three Moving Average and ADX indicators are used. It has the indicator warning system (audio, e-mail) and three types of alerts, including messages to mobile phone. It shows the best performance on M5. When the trend value reaches the value set, the warning system is activated. This indicator works only with Forex symbols. Inputs SoundAlarm = true - Sound Alert Sendmail=true - Send an e-mail in case of a buy or sell signal Sendnotificatio
2 799 USD
You can fins our other products from link : https://www.mql5.com/en/users/drbastem/seller   Also, you can ask all your questins from email : haskayafx@gmail.com or mobile : +90 530 867 5076 or @MehmetBastem    on telegram application This indicator is used to determine the trend. Standard MACD indicator is used. It has the indicator warning system: beep, e-mail and has three types of alerts, including messages to mobile phone. It shows the best performance on the chart of 5 minutes. When the
2 799 USD
Regression Channel Tools" basiert. Durch die Nutzung dieses Tools können Trader eine außergewöhnliche Kontrolle über ihren Chart-Regression-Kanal erlangen und fundiertere Handelsentscheidungen treffen. Das Regression Channel Tool ist ein leistungsstarkes Instrument im Werkzeugkasten eines Traders. Es soll wertvolle Einblicke in Preisentwicklungen und potenzielle Unterstützungs- und Widerstandsniveaus bieten. Das Tool eignet sich besonders gut zur Visualisierung von Korrekturwellen innerhalb eine
1 000 USD
Golden Monowave
Ahmed Mohamed Ali
Golden Monowave is monowave indicator, the monowave theory is one of Elliott wave approach and one of most complicate and accurate method. Golden Monowave can shortcut many major steps to identify and describe the monowave. It works on any timeframe and with any trading instrument, including currencies, indices, futures, etc. Input Parameters initial_Bars - set the initial number of bars to calculate. wave_color - select the color of the wave. label_color - select the color of labels. temp_lab
1 000 USD
Ticks Size
Viktor Kolmakov
This indicator displays in a separate window the difference between the number of points which increased the price, and the number of points that decreased the price during the time interval specified in the settings. The time interval for calculation is expressed as the number of bars of the chart the indicator is attached to. This approach allows you to evaluate the movement direction (growth or fall) of the instrument's price, the strength of the movement and the size of the movement in point
1 200 USD
About... This is a binary options indicators, works on M5 charts MT4 platforms. Expiry is always 5 minutes. Works on most of pairs. Has a optimilzated settings for each of pair. Need only aply indicator on chart and settings will be applied automatically. Trading hours are only on closed market at 4pm London time. For example if your broker has a time +2 GMT please set trading hours from 18.00 to 18.05. How it works? This product will make your trading very simple. It's take only few minute
5 000 USD
BinaryIndicator
Andrey Spiridonov
BinaryIndicator is a highly accurate indicator for trading binary options. It shows excellent results in scalping. This indicator is based in multifactor analysis of trend indicators, as well as confirmation oscillators, which in the end gives an increased accuracy of signals. Advantages of the indicator Increased accuracy of signals. Excellent results when trading binary options with a short expiration time from M30 to M1 . It works on any timeframes. Works with any trade symbols. Parameter
1 200 USD
Primus Trading Engine is a trading system that combines price action,ratio based indicators & custom indicators to create this leading indicator with a multi-timeframe approach to give you high probability trade setups for forex,CFD cash/futures,metals & binary option to assist in making predictions on what is MOST likely to happen in the market Main Chart Features Price Action Signal-Arrow displayed on a specific bar;NOT buy/sell arrow;DOES NOT repaint;Bullish arrow on a bullish bar,price is l
1 250 USD
This is the FXTraderariel PowerTrend . It compute a trendfollowing system based on it own algorithm. It gives you a buy or sell signal based on the trend. It based on the Supertrend, but our Version is not repainting. Furthermoore we added some Improvements and you can get an Arrow, Push or Alert when the trend changes. Depending on the settings it and trading style, it can be used for scalping or long-term trading . The indicator can be used on every time frame , but we advise to use it on H1
1 000 USD
This is the complete REX package. It consists of the lite, pro and ULTRA version.  Perfect for beginners and intermediates. REX complete is 100% non repaint. The strategy is based on a mix of different strategies, statistics, including pivot points, oscillators and patterns.  As the trading idea consists of a variety of some classic indicators like Momentum, Williams Percent Range, CCI, Force Index, WPR, DeMarker, CCI, RSI and Stochastic, it is clear that the fundamental indicators have being
1 800 USD
This is the FXTraderariel TrendTrader .It analysis the trend and displays it, due to changing the changing the candle color. It took me over 12 Year to develop this system. But it shows the market perfect. Very easy to follow, even for beginners. It works on all Pairs and all Timeframes (however we advice only pro traders to trade smaller Timeframes, novice traders should stick to higher TF like H4 and D1). Depending on the settings it and trading style, it can be used for scalping or long-t
1 000 USD
Sweet Waffle
Christophe Godart
The arrows are calculated with: -     2 Parabolic  parameters -     2 ADX parameters -     4 Stochastic parameters We recommend to combine it with Parabolic, ZigZag or Elliot waves indicator. Always trade the trend! If you make sure to draw your trend lines and support/resistance zones you will just have to wait for the signal to appear. Take the trade. For Binary Options it is advisable to set the expiry time to 5-15 min in M1 chart. THIS INDICATOR IS ZERO REPAINT Best assets to trade: -
3 027 USD
Let´s try to make some real money! Call me profit addicted. I thought why not try to make THE dream come reality. With discipline, a clear strategy and this indicator I focus on entering the perfect trades. This indicator is very easy to use as you will get perfect entry points for Put or Call trades. The arrows are calculated with: -     Momentum  parameters -     Candle stick patterns -     Fundamental Price action We recommend to combine it with Parabolic, ZigZag or Elliot waves indic
9 800 USD
SystemPro
Andrey Spiridonov
SystemPro - a professional indicator, is a full-fledged, self-sufficient author's strategy for working in the Forex market. A unique algorithm for analyzing the foreign exchange market is based on the calculation of reference points for three different time periods. Thus, the indicator simultaneously analyzes the long-term, medium-term and short-term price behavior before issuing a signal. The indicator is set in the usual way and works with any trade symbols. Advantages of the indicator It i
1 200 USD
Floating Nest
Dzmitry Chentsou
1. What is Floating Nest? This indicator is designed to automate the construction of decision zones (can act as support-resistance levels) according to the Floating Socket strategy. The same indicator allows you to significantly reduce the time when analyzing the behavior of prices in decision areas on historical data. It works on any currency pairs. Time frame: M1-H1. The NEST trading system (Nest) is notable for its simplicity and efficiency when trading currencies, stocks, indice
1 000 USD
Dark Sniper
Dmitriy Kashevich
Dark Sniper arrow indicator. complete lack of redrawing percentage of correct indicator predictions from 80 85% The arrow indicates the direction of the next candle and the possible direction of the trend in the future.  suitable for small m1 timeframes. It is recommended to open deals from 1 to 2 candles. The signal appears on the last candle advantages of the indicator: 1. leading signals. 2.complete lack of redrawing 3. high signal accuracy.
820 USD
Weitere Produkte dieses Autors
[V 1.00] MTF NRPA 5 RSI RTD wurde veröffentlicht! Pfeil-Echtzeit-Dashboard ohne Neulackierung. Wenn Sie es satt haben, verschiedene RSI-Indikatoren zu verwenden, aber feststellen, dass diese ungenau sind, dann probieren Sie dieses eine Tool aus. Normalerweise installieren Leute nur 1 RSI, um den OBOS-Level in einem bestimmten Zeitraum zu bestimmen. Die schlechte Nachricht ist, dass Sie die OBOS-Werte und -Trends nicht in verschiedenen Zeiträumen gleichzeitig sehen können. Deshalb habe ich d
150 USD
Die Analyse mehrerer Zeitrahmen eines Währungspaares in einem Fenster kann Sie verwirren. Um mehrere Zeiträume zu analysieren, benötigen Sie zuverlässige Indikatoren. Einer von ihnen verwendet die 9TF-MACD-Kurve. Ich habe Tag und Nacht daran gearbeitet, Code zu erstellen, der einfach, aber zuverlässig ist und alle neun Zeitrahmen in nur einem Indikator abdeckt. Schauen wir uns einige der Vorteile dieses Indikators an: Buntes Histogramm. Die Farbe der Kurve in jedem Zeitrahmen untersch
62.50 USD
Die Analyse mehrerer Zeitrahmen eines Währungspaares in einem Fenster kann Sie verwirren. Um mehrere Zeiträume zu analysieren, benötigen Sie zuverlässige Indikatoren. Einer von ihnen verwendet 9TF STOCH RSI. Ich habe Tag und Nacht daran gearbeitet, Code zu erstellen, der einfach, aber zuverlässig ist und alle neun Zeitrahmen in nur einem Indikator abdeckt. Schauen wir uns einige der Vorteile dieses Indikators an: Buntes Histogramm. Die Farbe der Kurve in jedem Zeitrahmen unterscheidet
62.50 USD
Analyzing multiple time frames of a currency pair in one window can make you confused. To analyze multiple time frames, you need reliable indicators. One of them is using 9TF RSI MA . I've been working day and night to create code that is simple but reliable and covers all nine time frames in just one indicator .  Let's look at some of the advantages of this indicator: Colorful histogram . The color of the curve in each timeframe is different from one another.  Arrows indicating the crossing of
62.50 USD
Analyzing multiple time frames of a currency pair in one window can make you confused. To analyze multiple time frames, you need reliable indicators. One of them is using 9TF MACD Limited Bar . I've been working day and night to create code that is simple but reliable and covers all nine time frames in just one indicator .  Attention! When first installed, the indicator does not look intact. Changing the timeframe will solve the problem. Let's look at some of the advantages of this indicator: C
62.50 USD
Analyzing multiple time frames of a currency pair in one window can make you confused. To analyze multiple time frames, you need reliable indicators. One of them is using 9TF STOCH RSI LIMITED BAR . I've been working day and night to create code that is simple but reliable and covers all nine time frames in just one indicator .  Attention! When first installed, the indicator does not look intact. Changing the timeframe will solve the problem. Let's look at some of the advantages of this indicat
62.50 USD
Die Analyse mehrerer Zeitrahmen eines Währungspaares in einem Fenster kann Sie verwirren. Um mehrere Zeiträume zu analysieren, benötigen Sie zuverlässige Indikatoren. Einer von ihnen verwendet 9TF Double RSI Double MA. Ich habe Tag und Nacht daran gearbeitet, Code zu erstellen, der einfach, aber zuverlässig ist und alle neun Zeitrahmen in nur einem Indikator abdeckt. Schauen wir uns einige der Vorteile dieses Indikators an: Doppeltes RSI, d.h. RSI schneller & RSI langsamer. Doppelter
81.25 USD
Die Analyse mehrerer Zeitrahmen eines Währungspaares in einem Fenster kann Sie verwirren. Um mehrere Zeiträume zu analysieren, benötigen Sie zuverlässige Indikatoren. Einer von ihnen verwendet 9TF Double CCI Double MA. Ich habe Tag und Nacht daran gearbeitet, Code zu erstellen, der einfach, aber zuverlässig ist und alle neun Zeitrahmen in nur einem Indikator abdeckt. Schauen wir uns einige der Vorteile dieses Indikators an: Doppeltes CCI, d.h. CCI schneller & CCI langsamer. Doppelter
81.25 USD
Ein genauer CCI-Indikator ist verfügbar. Dashboard Trendleiste Smart Level 9TF Double CCI. Doppelter CCI, d.h. Fast CCI & Slow CCI Warum brauchen Sie ein zweites CCI? Die Verwendung zusätzlicher Indikatoren wird uns im Live-Handel mehr überzeugen 9TF Fast CCI-Kurve 9TF Langsame CCI-Kurve 9TF Echtzeit-CCI-Winkel 9TF Echtzeit-CCI-Wert 9TF Echtzeit-CCI-Richtung/Phase 9TF Trendleiste Neuer Algorithmus bei der Berechnung des Trendbalkens An / aus Schalter. Sehr nützlich, um den Indikator mit nur e
93.75 USD
Ein genauer RSI-Indikator ist verfügbar. Dashboard Trendleiste Smart Level 9TF Double RSI. Doppelter RSI, d.h. schneller RSI & langsamer RSI Warum brauchen Sie einen zweiten RSI? Die Verwendung zusätzlicher Indikatoren wird uns im Live-Handel mehr überzeugen 9TF Schnelle RSI-Kurve 9TF Langsame RSI-Kurve 9TF Echtzeit-RSI-Winkel 9TF Echtzeit-RSI-Wert 9TF Echtzeit RSI Richtung/Phase 9TF Trendleiste Neuer Algorithmus bei der Berechnung des Trendbalkens An / aus Schalter. Sehr nützlich, um den Ind
93.75 USD
Ein genauer MACD-Indikator ist verfügbar. Dashboard Trend Bar Smart Level 9TF Double MACD. Dual MACD, d.h. schnell (MACD 1) & langsam (MACD 2) Warum brauchen Sie einen zweiten MACD? Die Verwendung zusätzlicher Indikatoren wird uns im Live-Handel mehr überzeugen 9TF Fast MACD 1-Kurve 9TF Langsame MACD 2-Kurve 9TF MACD-Winkel in Echtzeit 9TF MACD-Wert in Echtzeit 9TF-Echtzeit-MACD-RichtungEin genauer MACD-Indikator ist verfügbar. Dashboard Trend Bar Smart Level 9TF Double MACD. Dual MACD, d.h
93.75 USD
Ein genauer stochastischer Indikator ist verfügbar. Dashboard Trend Bar Smart Level 9TF Dual Stochastic. Dual Stochastic, d. h. Fast Stochastic & Slow Stochastic Warum brauchen Sie die zweite Stochastik? Die Verwendung zusätzlicher Indikatoren wird uns im Live-Handel mehr überzeugen 9TF Fast Stochastic-Kurve 9TF Langsame stochastische Kurve 9TF Stochastischer Winkel in Echtzeit 9TF Echtzeit-Stochastikwert 9TF Echtzeit Stochastische Richtung/Phase 9TF Trendleiste Neuer Algorithmus bei der Bere
93.75 USD
[V 1.00] MTF NRPA 5 Moving Average RTD wurde veröffentlicht! Pfeil-Echtzeit-Dashboard ohne Neulackierung. Wenn Sie nach dem besten Indikator für den gleitenden Durchschnitt suchen, sind Sie hier genau richtig. Im Allgemeinen werden zwei gleitende Durchschnitte festgelegt, da der Schnittpunkt der beiden gleitenden Durchschnitte (der Crossover) die Richtung des nächsten Preistrends bestimmt. Wenn sich der schnelle gleitende Durchschnitt mit dem langsam gleitenden Durchschnitt schneidet und sc
125 USD
Analyzing multiple time frames of a currency pair in one window can make you confused. To analyze multiple time frames, you need reliable indicators. One of them is using Strong All Time Frame Stochastic RSI Filtered . I've been working day and night to create trading tool that is simple but reliable and covers all nine time frames Stochastic RSI in just one indicator .  This indicator can be filtered by : Trend following selected time frame of Stochastic (by default is H1) Trend following sele
500 USD
Auswahl:
Keine Bewertungen
Antwort auf eine Rezension
Version 3.10 2023.09.25
In this new Version 3.10 :
- Reduce total mode to only 8, i.e show all time frame crossover arrows and trading in the zone
- Modifying parameter setting
- Can show all time frame crossover arrows of fast CCI and slow CCI, i.e DCCI
- Modify the status for mode 8
- Can show trend following selected time frame of fast stochastic, RSI 1x2, CCI 1x2, fast macd and RSIxMA outside the modes.
Version 3.0 2023.09.06
In this new Version 3.00 :
- Modifying STA algorithm both for calculation mode 1 and mode 2
- Modifying dashboard color scheme
- Modifying parameter setting
Version 2.90 2023.09.04
In this new Version 2.90, I added new features :
- Adding Mode 29 : Show ATF Fast Stoch DRSI. With this feature monitoring all time frame arrows of stochastic and RSI is easy.
- Adding STA Calculation Mode. The first mode is based on crossover of RSI & MA and the second mode is based on crossover of fast RSI & slow RSI.
Version 2.80 2023.08.30
In this new Version 2.80, I added new feature :
- Adding Time Spread Profit Info (TSPI) indicator
Version 2.70 2023.08.21
In this new Version 2.70, I make monitoring visually Stoch RSI easy :
- Modifying on chart dual stochastic
- Modifying on chart double rsi
- Modifying on chart rsioma
- Modifying color level
Version 2.60 2023.08.13
In this new Version 2.60, I added new feature :
- Adding STF belt trend
- Fixing on chart range
- Changing arrow code DRSI and DCCI
Version 2.50 2023.07.31
In this new Version 2.50, I added new feature :
- Adding confluence of 3TF MA 1x2
- Changing arrow code for trend following double CCI
- Changing arrow code for trend following double RSI
Version 2.40 2023.07.25
In this new Version 2.40, I added new features :
- Adding confluence of 3TF Fast DSTOCH
- adding confluence of 3TF Fast DMACD
- Adding trend following STF of DRSI
- Adding STA monitor, i.e (from top to bottom) H1,H4,D1,W1,MN1
Version 2.30 2023.07.18
In this new Version 2.30, I added new features :
- Added mode 28 : show trading in the zone
- Added 9TF double CCI dashboard monitor
- Added selected timeframe of double CCI crossover arrows
- Added STA monthly arrows
- Added three new dashboard color scheme
- Fixing STA, dual stochastic & dual MACD algorithm
Version 2.20 2023.07.11
In this new Version 2.20, I added new features :
- Added upper bound 100 & lower bound 0 for on chart dual stochastic
- Added upper bound 100 & lower bound 0 for on chart double rsi
- Fixing trading in the zone four MA
- Added timeframe scheme for four MA
- Fixing RSIMA dashboard
Version 2.10 2023.07.04
In this new Version 2.10 :
- Fixing DRSI arrow TF MN1
- Fixing color super trend arrows
- Fixing arrow MA 3 x MA 4
- Added timeframe scheme D1,W1,MN1 for conflux DRSI
Version 2.0 2023.07.03
In this new Version 2.00, I added new features :
- Added confluence arrows of 3 timeframe double RSI
- Added 12 timeframe scheme to choose from for confluence of double RSI
- Fixing algorithm for trend following dual stoch and dual macd
Version 1.90 2023.06.26
In this new Version 1.90, I added new features :
- Added super trend arrows higher timeframe
- Added MACD above or below zero level into dashboard
- Fixing MTF feature
Version 1.80 2023.06.20
In this new Version 1.80, I've made a lot of changes :
- Change the appearance of the dashboard from a circle to a square shape.
- Fixing color OBOS of slow stochastic and slow drsi.
- Added feature on chart slow stochastic.
- Added feature pivot value of all time frame of Fast Stoch.
- Added feature pivot value of all time frame of Fast MACD.
- Added feature pivot value of all time frame of MA 1,2.
- Added feature pivot value of all time frame of Double RSI.
- Added feature pivot value of all time frame of RSIMA.
- Added feature MTF candle high time frame.
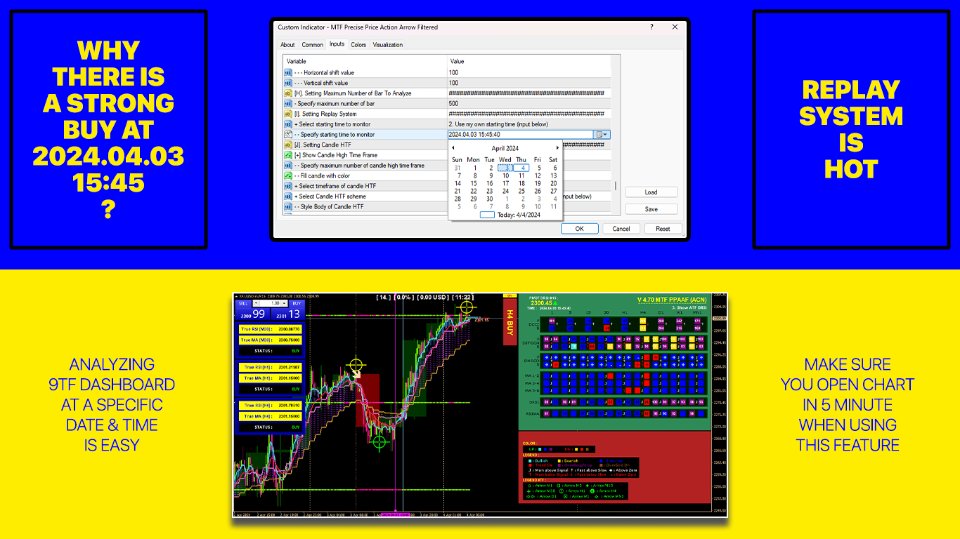
- Ability to change/shift the starting time to monitor in real time 9TF dashboard.
Version 1.70 2023.06.02
In this new Version 1.70, I've added the ability to monitor visually :
- On chart stochastic makes it easy for us to observe the movement of stochastic main line and stochastic signal line along the OBOS channel.
- On chart four MA makes it easy for us to observe the movement of MA 1 cross MA 2 and MA 3 cross MA 4.
- On chart double RSI makes it easy for us to observe the movement of RSI fast line and RSI slow line along the OBOS channel.
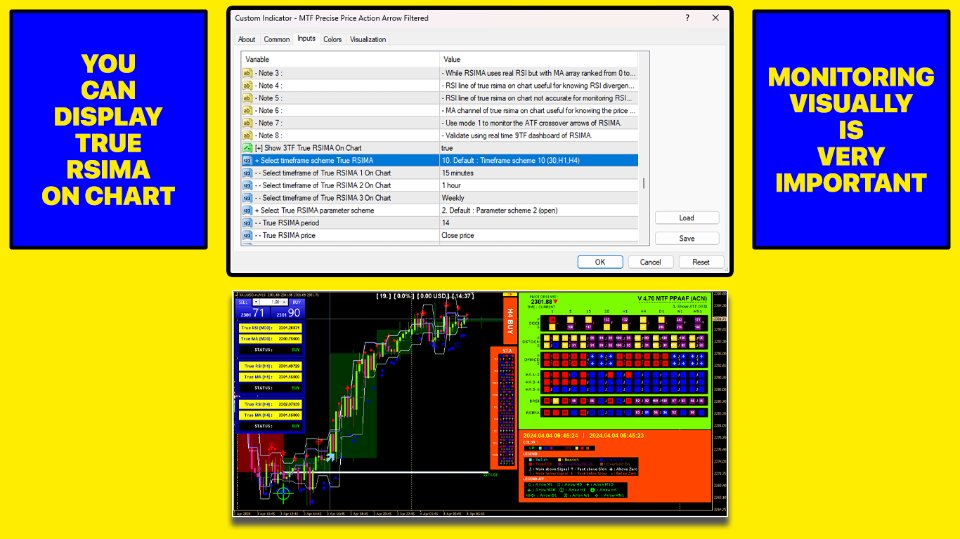
- On chart true RSIMA makes it easy for us to observe the movement of RSI line and MA line along the OBOS channel.
This on chart double RSI or on chart true RSIMA will make monitoring RSI divergence much more accurate than installing RSIMA on sub window.
And also I changed the appearance of the 10 dashboard color scheme to be more attractive.
Version 1.60 2023.05.23
In this new Version 1.60, I've made trading in the zone much more easy :
- Added four MA dashboard monitor (not just two MA!)
- Added four MA lines on chart (by default : MA 1x2 on current timeframe and MA 3x4 on M30)
- Customizable four MA lines
- Button can be located on sub window
Version 1.50 2023.05.03
In this new Version 1.50, I've made a lot of reconstruction :
- Total mode up to 27
- New feature : Show Trend Following ATF TWOMA Filtered By Trend Following Selected TF of FAST STOCH
- New feature : Show Trend Following ATF TWOMA Filtered By Trend Following Selected TF of FAST MACD
- New feature : Show Trend Following ATF TWOMA Filtered By Trend Following Selected TF of DRSI
- New feature : Show Trend Following ATF TWOMA Filtered By Trend Following Selected TF of RSIMA
- Trend following = non repaint arrows!
- Fixing algorithm of button
- Adding color level type
Version 1.40 2023.04.11
In this new Version 1.40, I've made a lot of reconstruction :
- Total mode up to 23
- New feature : Show Trend Following All Timeframe of Two MA
- New feature : Show Trend Following All Timeframe of Double RSI
- New feature : Show Trend Following All Timeframe of RSIMA
- New feature : Show Trend Following Selected Timeframe of Two MA
- New feature : Show Trend Following Selected Timeframe of Double RSI
- New feature : Show Trend Following Selected Timeframe of RSIMA
- New feature : Show Trend Following Selected Timeframe of Dual Stoch
- New feature : Show Trend Following Selected Timeframe of Dual MACD
- Trend following = non repaint arrows!
- Fixing algorithm of mode 21 : Show Selected TF of STOCH,MACD,TWOMA,DRSI Filtered By Trend Following RSIMA
- Parameter values can be hide/show
Version 1.30 2023.03.30
In this new Version 1.30, I've made a lot of reconstruction :
- Added dual stochastics dashboard monitor (fast stoch = stochastic 1 and slow stoch = stochastic 2)
- Added dual macd dashboard monitor (fast macd = macd 1 and slow macd = macd 2)
- Fixing MA Phase of RSIMA
- Change arrow code
- New feature : showing trend following arrows of stochastics and macd
- Dashboard monitor can be hide
Version 1.20 2023.03.12
In this new Version 1.20, I've made a lot of reconstruction :
- Fixing daily arrow of MACD
- Fixing arrow of RSIMA
- New algo in determining the up and down arrows
- New feature : showing arrows of Stochastic, MACD, Two MA and RSIMA at once
- Adding the RSIMA 9TF dashboard monitor
- Beautify the dashboard monitor
Version 1.10 2023.02.27
New version 1.10 with new feature available:
- Adding the ability to filter price action by all time frame (ATF) Two Moving Average
- Adding the ability to filter price action by all time frame (ATF) Double RSI
- Adding the value of Stochastic on all time frame
- Adding the value of CCI on all time frame