MTF Precise Price Action Arrow Filtered
- Indicators
- Anon Candra N
- Version: 5.10
- Updated: 20 September 2024
- Activations: 20
If you are looking for a trading tool that combines various indicators, then you are on the right page.
Why do we need to combine different indicators?
The answer is to strengthen the signal.
It is possible that the RSI is rising at that time but is the moving average also rising?
Is the stochastic also rising? Is the CCI also rising?
Sometimes RSI keeps going up even though it is already in the overbought area. Even at 100 it is still going up. Is it safe for us to take a sell position when RSI is in the overbought area?
Likewise, sometimes RSI keeps going down even though it is already in the oversold area. Even at 0 it is still going down. Is it safe for us to take a buy position when RSI is in the oversold area?
We need another indicator to convince us that the signal is strong to buy/sell.
Sometimes stochastic H4 buy but in M30 is sell. Then what do we do? Is there a change in trend? Is the market trend still buy or is it good to sell?
For that, you need a multi-time frame trading tool that can monitor market movements starting from the M1 to MN1 timeframe.
And if you are looking a trading tool that can show on chart Double RSI, on chart Stochastic and on chart Moving average lines of for example H1 timeframe while you open the chart on lower timeframe M5, then yes, this trading tool is what you are looking for!
Because we all agree that monitoring higher timeframe while opening the chart on lower timeframe is very important.
Whether you are a scalper, intraday or day trader or even an investor, you need this awesome MTF trading tools.
Whether you are a forex trader, gold trader, crypto trader or stock trader, you need this awesome MTF trading tools.
I present to you a powerful trading tool that you should buy right now:
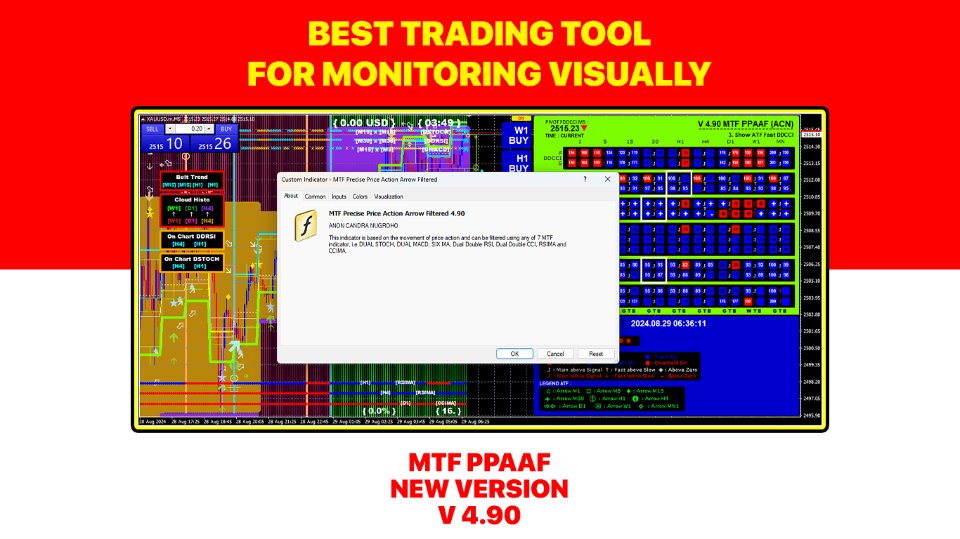
MTF Precise Price Action Arrow Filtered
New Version
V 5.10
This means that this trading tool has been updated 50 times.
I have worked very hard to continuously observe and research market movements using this tool.
The following are the features available in this tool:
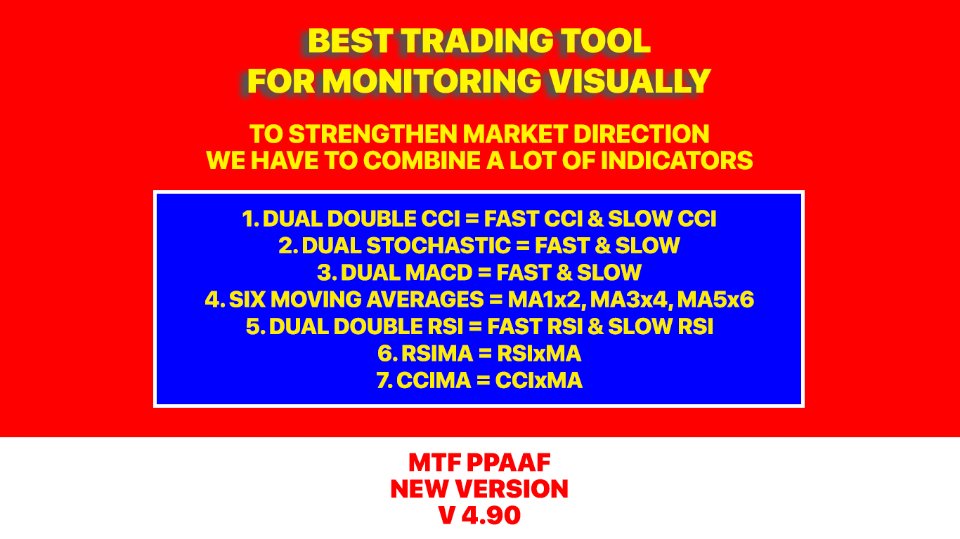
1. This trading tool uses 7 indicators to strengthen the direction of market movement.
a. The first indicator is Dual Double CCI, namely Fast Double CCI and Slow Double CCI
b. The second indicator is Dual Stochastic, namely Fast Stochastic and Slow Stochastic
c. The third indicator is Dual MACD, namely Fast MACD and Slow MACD
d. The fourth indicator is Six MA, namely MA 1x2, MA 3x4 and MA 5x6
e. The fifth indicator is Dual Double RSI, namely Fast Double RSI and Slow Double RSI
f. The sixth indicator is RSIMA, namely RSI x MA
g. The seventh indicator is CCIMA, namely CCI x MA
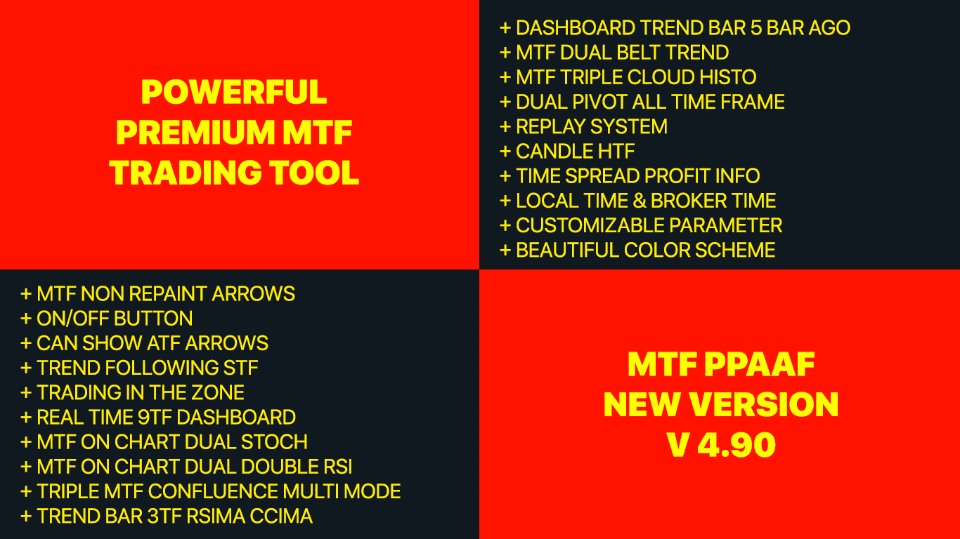
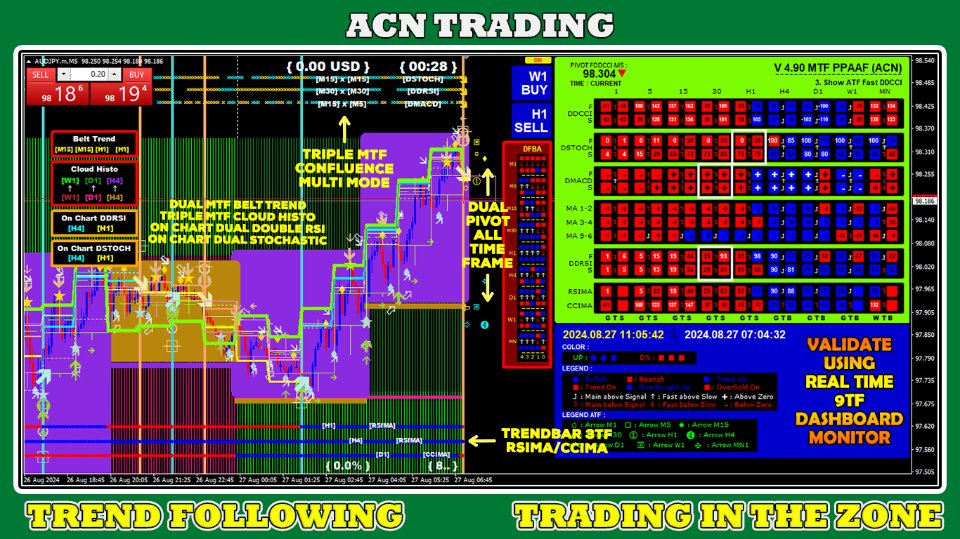
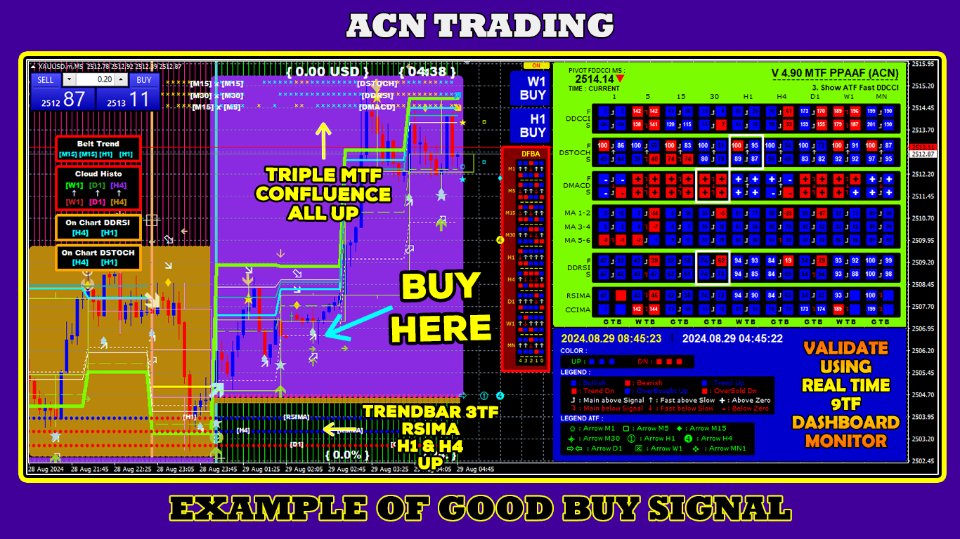
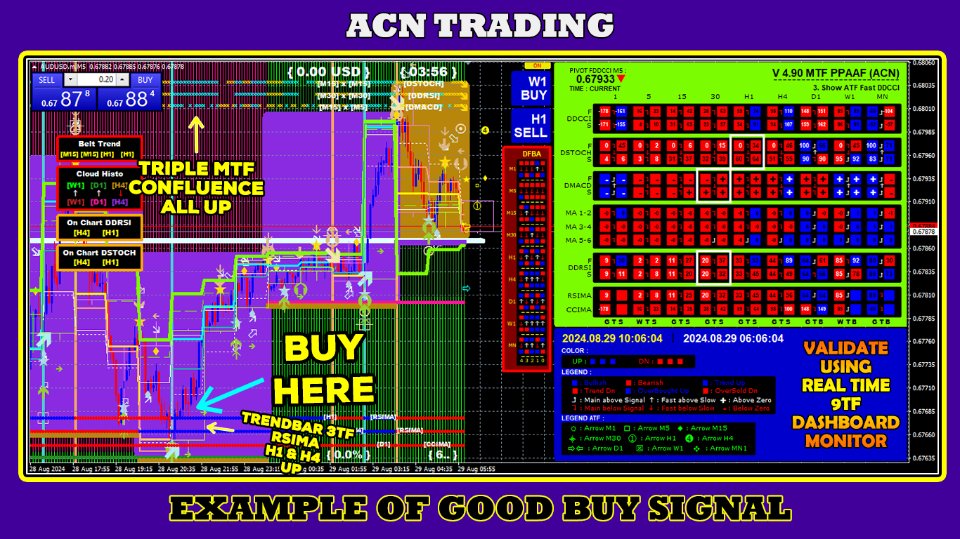
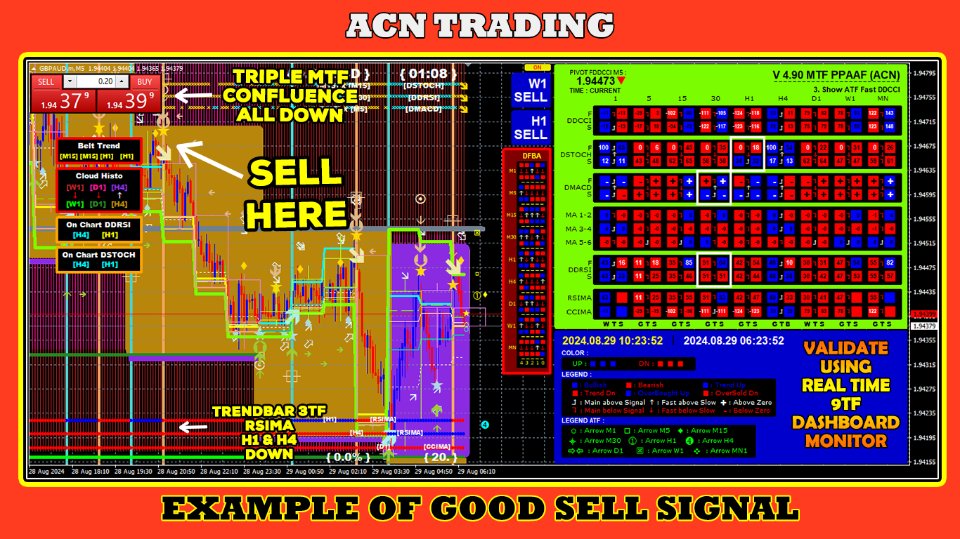
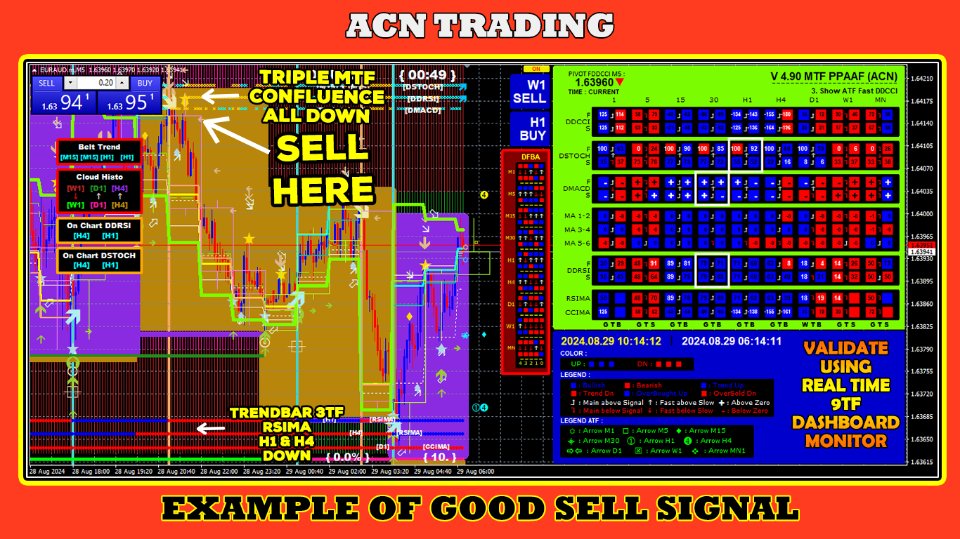
2. Real time 9TF dashboard monitor. With this feature, you can monitor market movements in real time starting from the 1 minute time frame to the MN1 time frame. In the dashboard you will be able to see whether the main line is greater than the signal line or not, whether the fast RSI line is greater than the slow RSI line or not, whether the RSI line is all up or not, etc. You can also see whether the Stochastic, RSI and CCI levels are overbought or oversold. Knowing the OBOS (overbought oversold) level is very important.
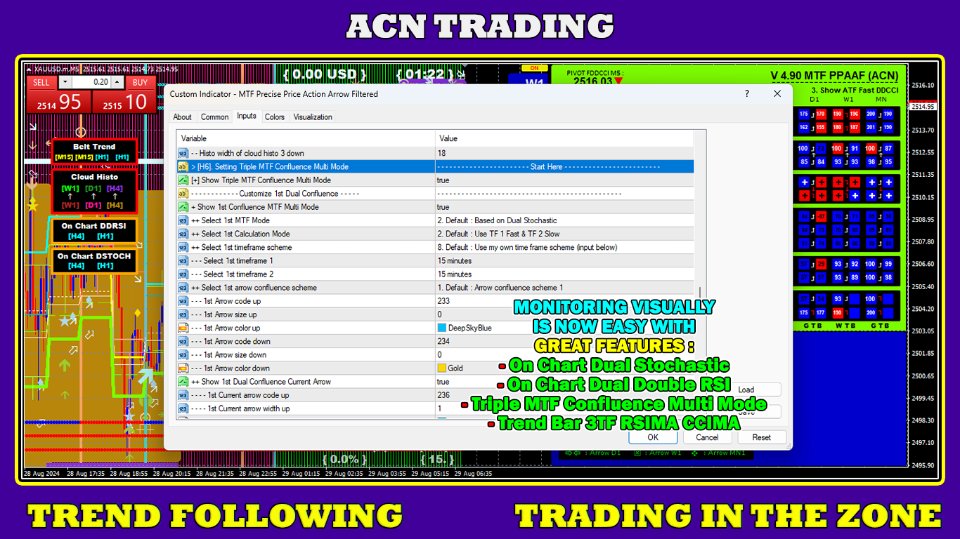
3. On chart features. Monitoring visually is important. For this reason, I added the On chart Dual Stochastic, On chart Four MA and On chart Dual Double RSI features. For your information, placing stochastics in the chart window is more accurate than placing stochastics in the sub window. Observing the intersection of the main line and signal line in real time in the chart window will make you confident in determining entry points and exit points. My principle is buy low sell high. Please remember that principle.
4. Can display ATF (all time frame) crossover arrows :
- Show ATF DCCI, namely Fast CCI x Slow CCI
- Show ATF Stochastic, namely Stochastic main line x Stochastic signal line
- Show ATF MACD, namely MACD main line x MACD signal line
- Show ATF MA 1x2, namely moving average 1 x moving average 2
- Show ATF MA 3x4, namely moving average 3 x moving average 4
- Show ATF MA 5x6, namely moving average 5 x moving average 6
- Show ATF DRSI, namely Fast RSI x Slow RSI
- Show ATF RSIMA, namely RSI x MA
- Show ATF CCIMA, namely CCI x MA
5. Dashboard Trend Bar 5 Bar Ago (DFBA). There are five trend bars that you can observe. The rightmost trend bar is the latest real time trend bar (0). Followed by the previous trend bar (1,2,3,4). This trend bar is useful for observing changes in the direction of market trends from the previous time frame to the current time frame.
6. Trend Following STF (selected time frame). Here you can choose the time frame according to your wishes. If two lines cross each other, an arrow appears. Plus the trend following arrow will appear if the angles of the two lines are all positive (UP) or all negative (Down).
7. Replay System. With this feature you can go back in time, observing the condition of the 9TF dashboard on a certain day and time. Suppose you want to analyze why at 2023.10.11 14:21:30 the market sells. To use this feature, open your Meta Trader 4 chart in a lower timeframe, for example M5.
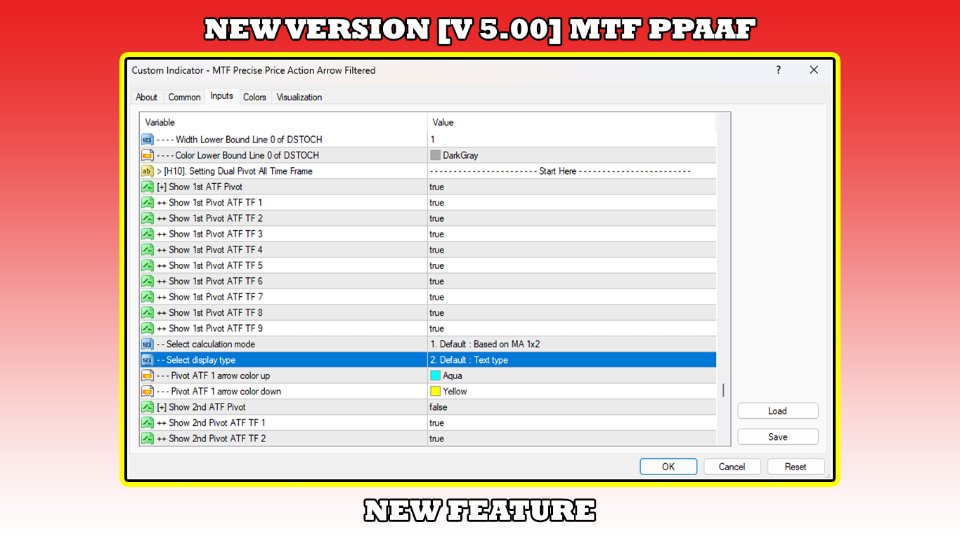
8. Dual Pivot All Time Frame. Pivot levels act like S & R, namely Support and Resistance. The good news is that in this new version, V 5.00 the replay system also works on Dual Pivot ATF. This is really an amazing feature. Now you can analyze buy/sell on a certain day and time vertically (know the time) or horizontally (know the price).
9. Candle HTF (High Time Frame). With this feature you can see market movements in the high time frame (for example H1) when you open the chart in the lower time frame (I like opening it at M5).
10. TSPI (Time Spread Profit Info). With this feature you can see in real time the current time, spread, profit/loss and percentage of profit/loss.
11. On/off button feature. With this feature you can show or hide this trading tool with just one click. Interesting right?
12. 20 dashboard color schemes that you can choose from. With this feature, you can choose a dashboard color that matches the color of your chart.
13. Customizable line, color, arrows, parameter. All parameters used in calculating indicators can be adjusted according to your wishes. You can use stochastic parameters 14,3,3 or 5,3,3 etc. Or you use the default settings.
14. MTF, namely Multi Time Frame. You can set a time frame according to your wishes. For example, you want to activate the dual stochastic on chart feature on the M5 and H1 time frames. You can!
15. Non Repaint Arrows (NRPA). If two lines intersect at any time then the crossover arrow will appear. Very often, because of high volatility, in the following seconds and minutes, the two lines do not intersect. As a result, the arrow that appeared earlier then disappeared. This is a very important feature. Remember that during high volatility, the arrow that was previously up can become down. The arrow that had previously appeared could disappear in an instant. That's why my message is to validate using the real time 9TF dashboard monitor!
16. Dual MTF Belt Trend. Belt Trend is based on crossover of moving averages. You can set a time frame according to your wishes.
17. Triple MTF Cloud Histo. Cloud Histo is based on crossover of moving averages. You can set a time frame according to your wishes.
18. Triple MTF Confluence Multi Mode. Confluence means intersection between two timeframes. For example, if fast stochastic H4 and slow stochastic M5 are all up then up arrow will appear.
19. Trend Bar 3TF RSIMA/CCIMA. Coding RSIMA/CCIMA is hard. But, I have successfully made this tool work accurately for RSIMA/CCIMA.
20. Trading in the zone.
Using only one trading indicator is not very convincing. That's why we combine several indicators to strengthen our analysis on market direction.
🟡 Learn old version here :
▶️ V 5.00 ▶️ V 4.90 ▶️ V 4.40 ▶️ V 4.10 ▶️ V 4.00 ▶️ V 3.90 ▶️ V 3.80 ▶️ V 3.70 ▶️ V 3.60 ▶️ V 3.50 ▶️ V 3.40 ▶️ V 3.30 ▶️ V 3.20 ▶️ V 3.10 ▶️ V 3.00 ▶️ V 2.90 ▶️ V 2.80 ▶️ V 2.70 ▶️ V 2.60 ▶️ V 2.50 ▶️ V 2.40 ▶️ V 2.30 ▶️ V 2.20 ▶️ V 2.10 ▶️ V 2.00 ▶️ V 1.90 ▶️ V 1.80 ▶️ V 1.70 ▶️ V 1.60 ▶️ V 1.50 ▶️ V 1.40 ▶️ V 1.30 ▶️ V 1.20 ▶️ V 1.10There are 14 total modes to chose:
- 1. Show ATF RSIMA
- 2. Show ATF CCIMA
- 3. Show ATF FDDCCI
- 4. Show ATF SDDCCI
- 5. Show ATF FDSTOCH
- 6. Show ATF SDSTOCH
- 7. Show ATF FDMACD
- 8. Show ATF SDMACD
- 9. Show ATF MA 1x2
- 10. Show ATF MA 3x4
- 11. Show ATF MA 5x6
- 12. Show ATF FDRSI
- 13. Show ATF SDRSI
- 14. Show Normal Mode
This indicator has gone through a series of trials. The programming codes have been written with great care.
Make confident entries with the best Non Repaint Price Action trading indicator MTF PPAAF.
Get now and trade like a pro.
Thank you.
#StochasticRSI #marketstructure #priceaction #bestrsi #rsima #rsitradingstrategy #stochrsicci #stochrsi #movingaveragedashboard
#rsidashboard #stochasticdashboard #ccidashboard #macddashboard #priceactionindicator #macd
