• Übersicht
  • Bewertungen
  • Diskussion

UR Vortex MT5

UR Vortex MT5
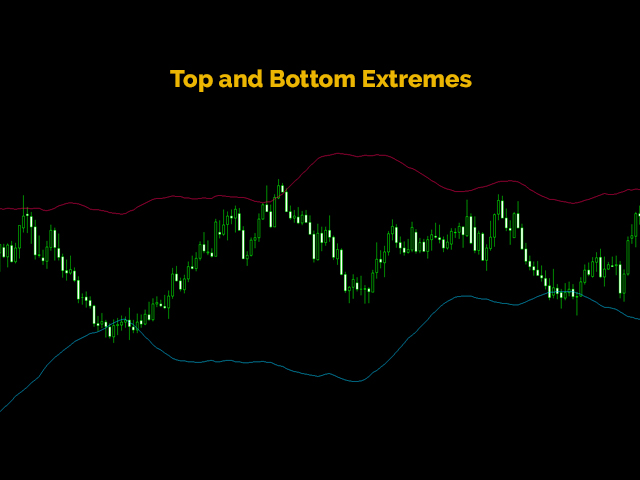
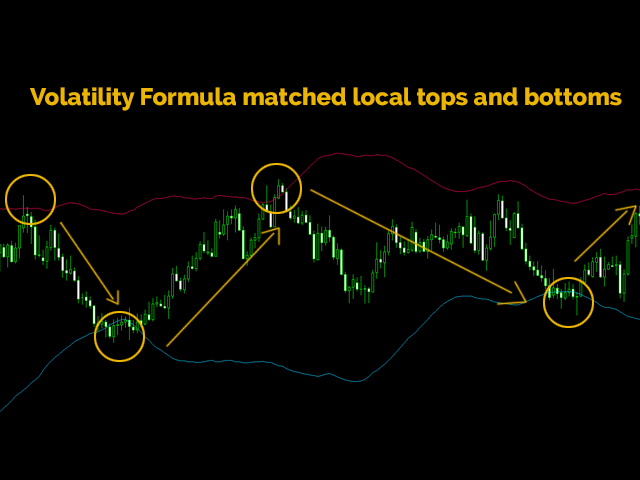
The Probabilistic UR Vortex Formula: An Accurate System for Predictive Market Analysis using Volatility and Standard Deviation Calculations.

The UR Vortex MT5 indicator is a technical analysis tool that uses volatility and standard deviation calculations to predict potential tops and bottoms in a market. It measures the strength of a trend by calculating the distance between the current price and a moving average, and then standardizing this distance by dividing it by the average true range (ATR) of the market. The result is a normalized value that represents the volatility of the market.

Advantages of using UR Vortex MT5 :

  1. Visually easy to understand and use
  2. Highly Accurate <<<
  3. No settings
  4. Adjusted to every kind of asset
  5. Perfect addition to any strategy <<<

There is a special telegram chat on which you can stay up-to-date with the tools updates and also send request if you feel there is something missing!


Why UR 
Vortex MT5 
?

The UR Vortex Formula has been developed based on years of experience and price action observation. It is a proven to work tool used by many professional traders. This formula, combining the power of volatility and standard deviation calculations with advanced probability analysis, provides traders with an accurate and reliable tool for predicting market tops and bottoms. Say goodbye to guesswork and missed opportunities, and take control of your financial future with the UR Vortex system.

How to use UR Vortex MT5 ?

  • Track the price action until it gets exhausted (crosses any line). At first show of weakness - a potential reversal may surge starting a new trend.
  • Highly suggested using multi-timeframe setups for better accuracy of entry


DISPLAY

  • Two sided Lines: Show levels of volatility exhaustion - predicted with the probabilistic formula based on Volatility and Price Action

WWW -> https://urtradingcoder.carrd.co

Twitter -> https://twitter.com/URTradingCoder

Facebook -> https://www.facebook.com/profile.php?id=61559349091899

YouTube -> https://www.youtube.com/channel/UCihthoKQYrhj91jkUO8B1kg

MQL Store -> https://www.mql5.com/en/users/youreacoder/seller


Empfohlene Produkte
Renko Plus
Eadvisors Software Inc.
With Renko Plus you can use the features in the Indicator functionality, just add it to the Metatrader5 chart.             The Renko chart is a type of chart, developed by the Japanese, that is constructed using price movement rather than standardized prices and time intervals like most charts. It is believed to be named after the Japanese word for bricks, "renga", as the graphic looks like a series of bricks.             A new brick is created when the price moves a specified p
Introduction to Smart Renko The main characteristics of Renko Charting concern price movement. To give you some idea on its working principle, Renko chart is constructed by placing a brick over or below when the price make the movement beyond a predefined range, called brick height. Therefore, naturally one can see clear price movement with less noise than other charting type. Renko charting can provide much clearer trend direction and it helps to identify important support and resistance level
Gino Renko
Stephane, Andr Valette
1 (1)
Another renko-based indicator. It returns different usable values ​​for an EA, and is directly displayed on the main chart. Its setting is very simple: The size of the renko The number of bars taken into account The falling color The color on the rise Returned values: Buffer 0 : Value of the middle Buffer 1 : Value of the Top Buffer 2 : Value of the Bottom Buffer 3 : Direction of renko (0.0 for top ; 1.0 for bottom) Buffer 4 : Ratio of the renko, for example, if it is twice, 3 times, ro more of
Market Imbalance MT5
Scott Edward Merritt
What Is Market Imbalance? Market Imbalance, also known as "IPA" or Improper Price Action, is when price moves so quick in one direction with no orders on the other side of the market to mitigate the price movement. We all know Big Banks, or "Smart Money", can move the market by placing huge orders which in turn can move price significantly. They can do this because Big Banks are the  top 10 Forex traders in the world . But unfortunately, the Big Banks cannot leave these orders in drawdown and mu
All about time and price by ICT. This indicator provides a comprehensive view of ICT killzones, Silver Bullet times, and ICT Macros, enhancing your trading experience.  In those time windows price either seeks liquidity or imbalances and you often find the most energetic price moves and turning points. Features: Automatic Adaptation: The ICT killzones intelligently adapt to the specific chart you are using. For Forex charts, it follows the ICT Forex times: In EST timezone: Session: Asia: 20h00-0
Your Pointer is no ordinary Forex channel. This corridor is built on the basis of the analysis of several candles, starting from the last one, as a result of which the extremes of the studied interval are determined. They are the ones who create the channel lines. Like all channels, it has a middle line as well as a high and low line. This channel is worth watching for its unusual behavior. The use of the Your Pointer indicator allows the trader to react in time to the price going beyond the bo
VI Vortex
Fernando Lahude Ritter
4.67 (3)
Description : Enhance Your Trading Strategy with the Advanced Vortex Indicator for MT5! Discover the power of the Vortex Indicator (VI), a robust technical analysis tool now available for MetaTrader 5. This custom-built indicator is designed to help traders identify trends and reversals, offering a critical edge in the dynamic Forex market. Key Features: Dynamic Trend Identification : With the VI's unique calculations of VI+ (positive) and VI- (negative) lines, you can easily spot trend strength
FREE
Based on the trading model/strategy/system of gold double-position hedging and arbitrage launched by Goodtrade Brokers, problems encountered in daily operations: 1. Account B immediately places an order immediately following account A. 2: After account A places an order, account B will automatically copy the stop loss and take profit. 3: Account A closes the position of Account B and closes the position at the same time. 4: When account B closes the position, account A also closes the position.
Advanced 4xZeovo MT5 Indicator (MetaTrader 5)   Product Description  4xZeovo is a powerful trading indicator system monitoring 24/7 financial markets. Metatrader5 tool designed to find the best buying/selling opportunities and notifies the user.    Making life easy for traders in helping with the two most difficult decisions with the use of advanced innovate trading indicators aiming to encourage users to hold the winning positions and take profit at the best times.    Equipped with a unique tra
This indicator uses a mathematical calculation algorithm . This algorithm calculates the remainder between the updated model and the actual values and produces the possible progress of the graph on the graph. It is not a super prophet in trading, but it is very good for the trader when entering the market and to analyze it before entering. Applicable for all currencies. Данный индикатор использует алгоритм математических вычислений . Данный алгоритм вычисляет остаток между обновленной моделью и
Trading patterns on Forex is considered to be the highest level of trading, since it usually requires years of mastering various patterns (shapes and candle combinations) and the ways they affect the price. Patterns are different combinations of Japanese candles on a chart, shapes of classical technical analysis, as well as any regularities of the market behavior repeating many times under the same conditions. After the patterns appear on a chart, the price starts behaving in a certain way allow
Auto Channel Trader
Ross Adam Langlands Nelson
The Auto Channel Trader creates a channel by plotting a line along the high points and low points of the chart, the EA then makes long trades near the bottom of the channel and short trades near the top of the channel. The channel is created by finding high points for the top line and low points for the bottom line, these points are shown with arrows. A line of best fit is then plotted through these points and extended until the end of the chart.  The length of the channel is determined by the M
PZ Trend Trading MT5
PZ TRADING SLU
3.67 (3)
Trend Trading ist ein Indikator, der so weit wie möglich von den Markttrends profitiert, indem er Pullbacks und Breakouts zeitlich festlegt. Sie findet Handelsmöglichkeiten, indem sie analysiert, was der Preis während etablierter Trends tut. [ Installationsanleitung | Update-Anleitung | Fehlerbehebung | FAQ | Alle Produkte ] Handeln Sie mit Zuversicht und Effizienz an den Finanzmärkten Profitieren Sie von etablierten Trends, ohne ins Wanken zu geraten Profitable Pullbacks, Ausbrüche und vor
Renko Chart
Marcin Konieczny
4.27 (11)
This indicator allows to display Renko charts in the indicator window. Renko charts show only price movements that are bigger than the specified box size. It helps to eliminate noise and allows to focus on main trends. Time is not a factor here. Only price movements are taken into account. That's why Renko chart is not synchronized with the main chart it is attached to. Indicator works in two modes: CLOSE - only close prices are taken into account while building the chart HIGH_LOW - only high/
FREE
Bands are a form of technical analysis that traders use to plot trend lines that are two standard deviations away from the simple moving average price of a security. The goal is to help a trader know when to enter or exit a position by identifying when an asset has been overbought or oversold. This indicator will show upper and lover bands. You can change input parameters nPeriod and  nMethod to calculate those bands for each timeframe. Aqua clouds represent up or down trends.
Trend Direction ADX indicator Trend Direction ADX is part of a serie of indicators used to characterize market conditions. Almost any strategy only work under certain market conditions. Therefore it is important to be able to characterize market conditions at any time: trend direction, trend strength, volatility, etc.. Trend Direction ADX is an indicator to be used to characterize trend direction: trending up trending down ranging Trend Direction ADX is based on ADX standard indicator.
PipFinite Strength Meter MT5
Karlo Wilson Vendiola
5 (1)
How To Determine If The Market is Strong Or Weak? Strength Meter uses an Adaptive Algorithm That Detect Price Action Strength In 4 Important Levels! This powerful filter gives you the ability to determine setups with the best probability. Features Universal compatibility to different trading systems Advance analysis categorized in 4 levels Level 1 (Weak) - Indicates us to WAIT. This will help avoid false moves Weak Bullish - Early signs bullish pressure Weak Bearish - Early signs bearish pre
The indicator is designed to work on any trading platform. The program is based on proprietary algorithms and W.D.Ganna's mathematics, allowing you to calculate target levels of price movement based on three points with the highest degree of certainty. It is a great tool for stock trading. The indicator has three buttons: NEW - call up a triangle for calculation. DEL - delete the selected triangle. DELS - completely remove all constructions. The probability of achieving the goals is more than 80
KT Renko Live Charts MT5
KEENBASE SOFTWARE SOLUTIONS
KT Renko Live Chart utility creates the Renko charts on MT5 that can be further used for speculation or live trading. The Renko chart created by this utility supports most of the custom indicators and automated Expert Advisors. Fully compatible with our Renko Patterns indicator and Renko Patterns EA . Features A simple and straightforward Renko utility that provides the Renko chart on MT5 without any complicated settings. It supports most of the custom indicators and Expert Advisors for 100%
https://youtu.be/JJanqcNzLGM ,  https://youtu.be/l70MIHaQQa4 ,  https://youtu.be/pg0oiT5_8y0   Automated Supply and Demand Trading Edge MT5. These videos demonstrate how we apply the supply and demand system to our latest trading review and market analysis Enhance your Trading Strategy with the Supply and Demand Trading Edge MT5. Gain a competitive market advantage with the Supply and Demand Trading Edge MT5 indicator, a powerful tool that combines MACD signals with supply and demand zones. B
KT ROC Divergence MT5
KEENBASE SOFTWARE SOLUTIONS
KT ROC divergence shows the regular and hidden divergences build between the price and Rate of change oscillator. Rate of change (ROC) is a pure momentum oscillator that calculates the change of percentage in price from one period to another. It compares the current price with the price "n" periods ago. ROC = [(Close - Close n periods ago) / (Close n periods ago)] * 100 There is an interesting phenomenon associated with ROC oscillator. In ROC territory there is no upward limit, but there is a do
Gekko MACD Plus
Rodrigo Galeote
3 (3)
Type: Oscillator This is Gekko's Cutomized Moving Average Convergence/Divergence (MACD), a customized version of the famous MACD indicator. Use the regular MACD and take advantage of several entry signals calculations and different ways of being alerted whenever there is potential entry point. Inputs Fast MA Period: Period for the MACD's Fast Moving Average (default 12); Slow MA Period: Period for the MACD's Slow Moving Average (default 26); Signal Average Offset Period: Period for the Signal
TradeMirror ist ein Handelskopierer EA für die MT4/MT5 Plattform. Warum TradeMirror Wir wissen, wie wichtig Sicherheit, Stabilität und Datenschutz für eine Finanzsoftware sind, deshalb haben wir uns die Mühe gemacht, diese drei Elemente bis ins Detail zu sichern: Bietet eine benutzerfreundliche grafische Schnittstelle, die einfach zu bedienen ist Fokus auf Datenschutz und Sicherheit, geeignet für verschiedene Finanzszenarien mit Datenschutzanforderungen bei der Auftragsverteilung Präzise Replik
Dieser indikator zeigt eine kerze kombination basierend auf dodge, dodge und pin bar. Die Logik des Musters besteht darin, nach der Unsicherheit auf der Seite der Macht zu sein. Der Indikator ist universell und nützlich für den Handel mit binären Optionen, Forex, ETF, Kryptowährung, Aktien. Der Indikator unterstützt Zeitrahmen von M5 bis MN einschließlich Nicht-Standard-TF in MT5 vorgestellt.(M5,M6,M10,M12, M15, M20, M30, H1, H2, H3, H4, H6, H8, H12, D1, W1, MN). Realisiert die Möglichkeit, akti
Golden Spikes Detector
Batsirayi L Marango
5 (1)
Golden Spikes Detector This indicator is based on an advanced strategy primarily for trading spikes on Boom and Crash Indices. Complex algorithms were implemented to detect high probability entries only. It alerts on potential Buy and Sell entries. To trade spikes on the Deriv or Binary broker, only take Buy Boom and Sell Cash alerts. It was optimised to be loaded on 5-minute timeframe although multiple timeframe analysis is done in the background. Features ·             Desktop pop up and sound
Double HMA MTF for MT5
Pavel Zamoshnikov
5 (2)
This is an advanced multi-timeframe version of the popular Hull Moving Average (HMA) Features Two lines of the Hull indicator of different timeframes on the same chart. The HMA line of the higher timeframe defines the trend, and the HMA line of the current timeframe defines the short-term price movements. A graphical panel with HMA indicator data from all timeframes at the same time . If the HMA switched its direction on any timeframe, the panel displays a question or exclamation mark with a tex
Vortex MT5
KEENBASE SOFTWARE SOLUTIONS
The Vortex Indicator was first presented by Douglas Siepman and Etienne Botes in January 2010 edition of Technical Analysis of Stocks & Commodities. Despite its based on a complex implosion phenomenon, the vortex is quite simple to interpret. A bullish signal is generated when +VI line cross above the -VI line and vice versa. The indicator is mostly used as a confirmation for trend trading strategies. The Vortex was inspired by the work of Viktor Schauberger, who studied the flow of water in tur
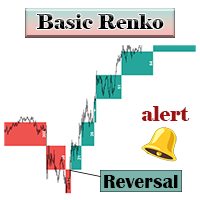
Basic Renko MT5
Mehran Sepah Mansoor
Der Basic Renko-Indikator zeigt die Renko-Boxen im Hauptdiagramm an. MT4-Version Der Vorteil besteht darin, dass Sie gleichzeitig Zugriff auf das Hauptdiagramm und das Renko-Diagramm haben. Darüber hinaus können Sie herausfinden, wie viele Barren für die Bildung jeder Renko-Box benötigt wurden. Wenn eine Umkehr eintritt, benachrichtigt Sie der Indikator per Popup-, Push- und E-Mail-Benachrichtigung. Dieser Indikator verfügt über keine komplizierten Einstellungen und kann sowohl von Anfä
FREE
For a trader, trend is our friend. This is a trend indicator for MT5, can be used on any symbol. just load it to the terminal and you will see the current trend. green color means bullish trend and red means bearlish trend. you can also change the color by yourself when the indicator is loaded to the MT5 terminal the symbol and period is get from the terminal automaticly. How to use: I use this trend indicator on 2 terminals with different period  for the same symbol at same time. for example M5
A machine translation from English product description was used. We apologies for possible imprecisions. Es wurde eine maschinelle Übersetzung der englischen Produktbeschreibung verwendet. Eventuelle Ungenauigkeiten bitten wir zu entschuldigen. Ein Visualisierungssystem für beliebte Candlestick-Preisaktionsmuster. Nach dem Anbringen markiert der Indikator automatisch die nächsten Muster auf dem Diagramm: Pinocchio Bar – ein kleiner Körperriegel mit einer langen „Nase“, einem sehr bekannten umgek
Käufer dieses Produkts erwarben auch
Atomic Analyst MT5
Issam Kassas
5 (12)
Zunächst einmal ist es erwähnenswert, dass dieser Handelsindikator nicht neu malt, nicht neu zeichnet und keine Verzögerung aufweist, was ihn sowohl für manuellen als auch für Roboterhandel ideal macht. Benutzerhandbuch: Einstellungen, Eingaben und Strategie. Der Atom-Analyst ist ein PA-Preisaktionsindikator, der die Stärke und das Momentum des Preises nutzt, um einen besseren Vorteil auf dem Markt zu finden. Ausgestattet mit fortschrittlichen Filtern, die helfen, Rauschen und falsche Signale z
Zunächst einmal ist es wichtig zu betonen, dass dieses Handelssystem ein Nicht-Repainting-, Nicht-Redrawing- und Nicht-Verzögerungsindikator ist, was es sowohl für manuelles als auch für automatisches Trading ideal macht. Online-Kurs, Handbuch und Vorlagen herunterladen. Das "Smart Trend Trading System MT5" ist eine umfassende Handelslösung, die für neue und erfahrene Trader maßgeschneidert ist. Es kombiniert über 10 Premium-Indikatoren und bietet mehr als 7 robuste Handelsstrategien, was es zu
Wir stellen vor       Quantum Breakout PRO   , der bahnbrechende MQL5-Indikator, der die Art und Weise, wie Sie mit Breakout-Zonen handeln, verändert! Entwickelt von einem Team erfahrener Händler mit über 13 Jahren Handelserfahrung,       Quantum Breakout PRO       ist darauf ausgelegt, Ihre Handelsreise mit seiner innovativen und dynamischen Breakout-Zone-Strategie auf ein neues Niveau zu heben. Der Quantum Breakout Indicator zeigt Ihnen Signalpfeile auf Breakout-Zonen mit 5 Gewinnzielzone
FX Volume MT5
Daniel Stein
4.94 (17)
Erhalten Sie Ihr tägliches Marktupdate mit Details und Screenshots über unser Morning Briefing hier auf mql5 und auf Telegram ! FX Volume ist der ERSTE und EINZIGE Volumenindikator, der einen ECHTEN Einblick in die Marktstimmung aus Sicht eines Brokers bietet. Es bietet fantastische Einblicke in die Positionierung von institutionellen Marktteilnehmern, wie z.B. Brokern, auf dem Forex-Markt, viel schneller als COT-Berichte. Diese Informationen direkt auf Ihrem Chart zu sehen, ist der wahre Game
Quantum Trend Sniper
Bogdan Ion Puscasu
5 (39)
Wir stellen vor       Quantum Trend Sniper Indicator   , der bahnbrechende MQL5-Indikator, der die Art und Weise, wie Sie Trendumkehrungen erkennen und handeln, verändert! Entwickelt von einem Team erfahrener Händler mit über 13 Jahren Handelserfahrung,       Quantum Trend Sniper-Indikator       wurde entwickelt, um Ihre Trading-Reise mit seiner innovativen Methode zur Identifizierung von Trendumkehrungen mit extrem hoher Genauigkeit auf ein neues Niveau zu heben. ***Kaufe Quantum Trend Snipe
A key element in trading is zones or levels from which decisions to buy or sell a trading instrument are made. Despite attempts by major players to conceal their presence in the market, they inevitably leave traces. Our task was to learn how to identify these traces and interpret them correctly. Reversal First Impulse levels (RFI)   -  Version MT4                  INSTRUCTIONS                 RUS                 ENG                         R ecommended to use with an indicator   -  TREND PRO  
RelicusRoad Pro MT5
Relicus LLC
4.82 (22)
Jetzt 147 US -Dollar (nach ein paar Aktualisierungen auf 499 US -Dollar) - Unbegrenzte Konten (PCs oder MACs) RelicusRoad Benutzerhandbuch + Schulungsvideos + Zugang zur privaten Discord-Gruppe + VIP-Status EINE NEUE ART, DEN MARKT ZU BETRACHTEN RelicusRoad ist der weltweit leistungsstärkste Handelsindikator für Forex, Futures, Kryptowährungen, Aktien und Indizes und gibt Händlern alle Informationen und Tools, die sie benötigen, um profitabel zu bleiben. Wir bieten technische Analysen un
TPSpro TRENDPRO  - is a trend indicator that automatically analyzes the market and provides information about the trend and each of its changes, as well as giving signals for entering trades without redrawing! The indicator uses each candle, analyzing them separately. referring to different impulses - up or down impulse. Exact entry points into transactions for currencies, crypto, metals, stocks, indices!  -  Version MT4                  DETAILED DESCRIPTION        /       TRADING SETUPS       
FX Power MT5 NG
Daniel Stein
5 (5)
Erhalten Sie Ihr tägliches Marktupdate mit Details und Screenshots über unser Morning Briefing hier auf mql5 und auf Telegram ! FX Power MT5 NG ist die nächste Generation unseres langjährig sehr beliebten Währungsstärkemessers FX Power. Und was bietet dieser Stärkezähler der nächsten Generation? Alles, was Sie am ursprünglichen FX Power geliebt haben PLUS GOLD/XAU-Stärkeanalyse Noch präzisere Berechnungsergebnisse Individuell konfigurierbare Analysezeiträume Anpassbares Berechnungslimit für noc
Dies ist ein Indikator für MT5, der genaue Signale für den Einstieg in einen Handel ohne Repainting (Neuzeichnen) liefert. Er kann auf alle Finanzwerte angewendet werden: Forex, Kryptowährungen, Metalle, Aktien, Indizes. Er liefert ziemlich genaue Schätzungen und sagt Ihnen, wann es am besten ist, eine Position zu eröffnen und zu schließen. Sehen Sie sich das Video (6:22) mit einem Beispiel für die Verarbeitung nur eines Signals an, das sich für den Indikator gelohnt hat! Die meisten Händler ver
Gartley Hunter Multi
Siarhei Vashchylka
5 (7)
Gartley Hunter Multi - An indicator for searching for harmonic patterns simultaneously on dozens of trading instruments and on all classic timeframes: (m1, m5, m15, m30, H1, H4, D1, Wk, Mn). Manual (Be sure to read before purchasing) | Version for MT4 Advantages 1. Patterns: Gartley, Butterfly, Shark, Crab. Bat, Alternate Bat, Deep Crab, Cypher 2. Simultaneous search for patterns on dozens of trading instruments and on all classic timeframes 3. Search for patterns of all possible sizes. Fr
Dies ist wahrscheinlich der vollständigste Indikator für die automatische Erkennung der harmonischen Preisbildung, den Sie für die MetaTrader-Plattform finden können. Es erkennt 19 verschiedene Muster, nimmt Fibonacci-Projektionen genauso ernst wie Sie, zeigt die potenzielle Umkehrzone (PRZ) an und findet geeignete Stop-Loss- und Take-Profit-Werte. [ Installationsanleitung | Update-Anleitung | Fehlerbehebung | FAQ | Alle Produkte ] Es erkennt 19 verschiedene harmonische Preisbildungen Dar
Advanced Supply Demand MT5
Bernhard Schweigert
4.53 (15)
Derzeit 33% Rabatt! Die beste Lösung für jeden Anfänger oder erfahrenen Händler! Dieser Indikator ist ein einzigartiges, qualitativ hochwertiges und erschwingliches Trading-Tool, da wir eine Reihe von proprietären Funktionen und eine neue Formel integriert haben. Mit diesem Update werden Sie in der Lage sein, doppelte Zeitrahmenzonen anzuzeigen. Sie können nicht nur einen höheren TF (Zeitrahmen) anzeigen, sondern sowohl den Chart-TF als auch den höheren TF: SHOWING NESTED ZONES. Alle Supply Dema
Was: $249  Now: $99   Market Profile defines a number of day types that can help the trader to determine market behaviour. A key feature is the Value Area, representing the range of price action where 70% of trading took place. Understanding the Value Area can give traders valuable insight into market direction and establish the higher odds trade. It is an excellent addition to any system you may be using. Inspired by Jim Dalton’s book “Mind Over Markets”, this indicator is designed to suit the
Blahtech Supply Demand MT5
Blahtech Limited
4.57 (14)
Was: $299  Now: $99   Supply Demand uses previous price action to identify potential imbalances between buyers and sellers. The key is to identify the better odds zones, not just the untouched ones. Blahtech Supply Demand indicator delivers functionality previously unavailable on any trading platform. This 4-in-1 indicator not only highlights the higher probability zones using a multi-criteria strength engine, but also combines it with multi-timeframe trend analysis, previously confirmed swings
IX Power MT5
Daniel Stein
5 (2)
IX Power   bringt die unschlagbare Präzision von FX Power endlich auch zu Nicht-Forex-Symbolen. Es bestimmt präzise die Intensität von kurz-, mittel- und langfristigen Trends in Ihren Lieblingsindizes, Aktien, Rohstoffen, ETFs und sogar Kryptowährungen. Sie können   alles analysieren, was   Ihr Terminal zu bieten hat. Probieren Sie es aus und erleben Sie, wie   sich Ihr Timing   beim Handel   deutlich verbessert . IX Power Hauptmerkmale 100% präzise, nicht nachpinselnde Berechnungsergebni
XQ Indicator MetaTrader 5
Marzena Maria Szmit
5 (1)
Step into the realm of Forex trading with confidence and precision using XQ, a cutting-edge Forex indicator designed to elevate your trading game to unprecedented heights. Whether you're a seasoned trader or just stepping into the world of currency exchange, XQ Forex Indicator empowers you with the insights and signals needed to make informed trading decisions. The signal conditions are a combination of three indicators, and XQ Forex Indicator only display  medium and long-term trends . The ind
Quantum Heiken Ashi PRO MT5
Bogdan Ion Puscasu
4.5 (8)
Wir stellen den   Quantum Heiken Ashi PRO   vor Die Heiken-Ashi-Kerzen wurden entwickelt, um klare Einblicke in Markttrends zu geben und sind bekannt für ihre Fähigkeit, Rauschen herauszufiltern und falsche Signale zu eliminieren. Verabschieden Sie sich von verwirrenden Preisschwankungen und begrüßen Sie eine glattere, zuverlässigere Diagrammdarstellung. Was den Quantum Heiken Ashi PRO wirklich einzigartig macht, ist seine innovative Formel, die traditionelle Candlestick-Daten in leicht lesbare
77% discount for the next 10 buyers (original price $605): 1 left 3 Indicators in 1 indicator Strategy based on price action Made specifically for the best forex currency pairs Can be used in the best time frame of the market at a very reasonable price This indicator is basically 3 different indicatos . But we have combined these 3 indicators in 1 indicator so that you can use 3 indicators at the lowest price. All three strategies are based on price action. But based on different trends.
Matrix Arrow Indicator MT5
Juvenille Emperor Limited
5 (14)
Matrix Arrow Indicator MT5   ist ein einzigartiger 10-in-1-Trend, der zu   100 % nicht neu gezeichnet   werden kann. Multi-Timeframe-Indikator, der für alle Symbole/Instrumente verwendet werden kann:   Forex ,   Rohstoffe ,   Kryptowährungen ,   Indizes ,   Aktien .  Der  Matrix Arrow Indicator MT5  wird den aktuellen Trend in seinen frühen Stadien bestimmen und Informationen und Daten von bis zu 10 Standardindikatoren sammeln, die sind: Durchschnittlicher Richtungsbewegungsindex (ADX) Rohstoff
Introducing the South African Sniper indicator created by a small group of traders with a few years trading trading the financial market profitably . This is a plug and play indicator that provides you with  BUY and SELL (SNIPER ENTRY) signals with TARGET and trail stops. The indicator Works with all MT5 trading instruments. The indicator uses previous  chart data as receipt to speculate on future market moves.
Golden Gate Algo MT5
James David Lane
4 (6)
40% RABATT ZU WEIHNACHTEN! PREISERHÖHUNG AUF $250 AM 1. JANUAR! Vorstellung von GoldenGate Entries: Eine hochmoderne Handelslösung! Entdecken Sie einen revolutionären Ansatz zum Handel mit GoldenGate Entries (GGE), einem fortschrittlichen Indikator, der entwickelt wurde, um Ihr Handelserlebnis zu verbessern. GGE bietet eine umfassende Palette von Funktionen, um Benutzer mit Präzision und Vertrauen in ihren Handelsentscheidungen auszustatten. Paare: Beliebig (FX - Rohstoffe - Aktien - Akti
FxaccurateLS
Shiv Raj Kumawat
WHY IS OUR FXACCCURATE LS MT5 THE PROFITABLE ? PROTECT YOUR CAPITAL WITH RISK MANAGEMENT Gives entry, stop and target levels from time to time. It finds Trading opportunities by analyzing what the price is doing during established trends. POWERFUL INDICATOR FOR A RELIABLE STRATEGIES We have made these indicators with a lot of years of hard work. It is made at a very advanced level. Established trends provide dozens of trading opportunities, but most trend indicators completely ignore them!
The Volume by Price Indicator for MetaTrader 5 features Volume Profile and Market Profile TPO (Time Price Opportunity). Get valuable insights out of currencies, equities and commodities data. Gain an edge trading financial markets. Volume and TPO histogram bar and line charts. Volume Footprint charts. TPO letter and block marker charts including split structures. Versatile segmentation and compositing methods. Static, dynamic and flexible ranges with relative and/or absolute visualizations. Lay
Wolfe Waves sind natürlich vorkommende Handelsmuster, die an allen Finanzmärkten vorhanden sind und einen Kampf um einen Gleichgewichtspreis darstellen. Diese Muster können sich über kurze und lange Zeiträume entwickeln und sind eines der zuverlässigsten prädiktiven Umkehrmuster, die es gibt und die normalerweise starken und langen Kursbewegungen vorausgehen. [ Installationsanleitung | Update-Anleitung | Fehlerbehebung | FAQ | Alle Produkte ] Klare Handelssignale Erstaunlich einfach zu handeln
MetaForecast M5
Vahidreza Heidar Gholami
5 (2)
MetaForecast prognostiziert und visualisiert die Zukunft eines beliebigen Marktes basierend auf den Harmonien in den Preisdaten. Obwohl der Markt nicht immer vorhersehbar ist, kann MetaForecast, wenn es ein Muster im Preis gibt, die Zukunft so genau wie möglich voraussagen. Im Vergleich zu ähnlichen Produkten kann MetaForecast durch die Analyse von Markttrends genauere Ergebnisse erzeugen. Eingabeparameter Past size (Vergangene Größe) Gibt an, wie viele Balken MetaForecast verwendet, um ein Mo
VJ Sniper MT5
Vijayaratna Kumar Boda
VJ Sniper - MT5 Buy / Sell Indicator:   This Indicator is as simple as Buy in Up Trend & Sell in Down Trend.                                                           There are Support / Resistance Graphic levels for choosing the best Entries. Background:   Any in-built indicator of MT5 does not work as stand alone such as Stochastic, CCI or DeMarker etc. But combination of them with trend projection work & give the best results for Trading entries. So this Indicator is blended to give the best
TrendMaestro5
Stefano Frisetti
note: this indicator is for METATRADER4, if you want the version for METATRADER5 this is the link:  https://www.mql5.com/it/market/product/108106 TRENDMAESTRO ver 2.4 TRENDMAESTRO recognizes a new TREND in the bud, he never makes mistakes. The certainty of identifying a new TREND is priceless. DESCRIPTION TRENDMAESTRO identifies a new TREND in the bud, this indicator examines the volatility, volumes and momentum to identify the moment in which there is an explosion of one or more of these data a
The TimeCycleCaptor indicator is an innovative tool for accurately visualizing the market trend and generating buy and sell signals. The market trend plays a key role in making trading decisions, and our indicator provides a reliable tool for determining it. We have made traders' dream of non-lagging moving averages come true in our indicator. TimeCycleCaptor is capable of predicting future values ​​and is designed to both identify the underlying trend and identify short-term buy or sell si
Price Action Finder MT5
Siarhei Vashchylka
5 (11)
The Price Action Finder indicator is an indicator of entry points, which is designed to search and display patterns of the Price Action system on a price chart. The indicator is equipped with a system of trend filters, as well as a system of alerts and push notifications. Manual (Be sure to read before purchasing) | Version for MT4 Advantages 1. Patterns: Pin bar, Outside bar, Inside bar, PPR, Power bar, Hanging man, Inverted hammer 2. Pattern filtering system. Removes countertrend patterns fro
Weitere Produkte dieses Autors
UR TradeManager MT5
Krzysztof Jan Debski
UR_TradeManager für MetaTrader 5 Maximieren Sie Ihr Handelspotenzial mit dem UR_TradeManager, dem ultimativen Werkzeug zur Verbesserung des Handels, das speziell für die MetaTrader 4-Plattform entwickelt wurde. Dieses präzise und funktionale, umfassende Werkzeug ist unerlässlich für Händler, die ihre Fähigkeiten in Marktanalyse, Ausführung und Verwaltung verbessern möchten. Hauptmerkmale: Visuelles Handels-Dashboard : Verwalten Sie Ihre Trades direkt von einem ausgeklügelten Dashboard, das in Ih
UR Control Panel
Krzysztof Jan Debski
5 (2)
UR-Systemsteuerung   UR Control Panel ist ein Tool, das ich KOSTENLOS mit Ihnen teilen möchte. Es ist ein interaktives Panel, das mir beim Trading geholfen und mein tägliches Marktscannen verbessert hat. Hoffe, es entspricht auch Ihren Bedürfnissen! Wie verwende ich das UR Control Panel? Es ist ein bewegliches, in der Größe anpassbares Doppelpanel, von dem: - Einer von ihnen zeigt die Währungsstärke im angegebenen Zeitrahmen - Der andere ermöglicht Optionen, sich viel schneller zwischen S
FREE
UR Basket
Krzysztof Jan Debski
UR-Korb   Das Beste, was Sie tun können, ist, Ihre Aufträge davor zu schützen, dass sie zu Verlusten werden. Sie können sich jetzt entspannen und UR Basket sich darum kümmern lassen. Vorteile der Verwendung von UR Basket: Alle Parameter sind im grafischen Bedienfeld Ihres Diagramms dynamisch änderbar - Sie müssen den EA NICHT neu starten, um die Parameter zu ändern oder die verwendeten Einstellungen abzurufen! Sie können Ihre Bestellungen verfolgen über:   - Magische Zahl   - EA-Kommentar
UR DivergenceSpotter
Krzysztof Jan Debski
UR DivergenceSpotter   UR DivergenceSpotter ist das Ergebnis langjähriger Erfahrung und manchmal sind die einfachsten Wege die besten. Es gibt eine gute Korrelation zwischen einigen Indikatoren, aber wenn sie nicht übereinstimmen – versucht der Preis, sich „neu anzupassen“ – und in diesem Moment erhalten wir ein Signal mit UR DivergenceSpotter. Vorteile der Verwendung von UR Divergence Spotter: Keine Parameter Wird nicht neu gezeichnet, nachdem die Kerze erstellt wurde Signale, wenn das S
UR VolumeTrend
Krzysztof Jan Debski
UR VolumenTrend   UR VolumeTrend ist der deutlichste Volumenindikator, der den anhaltenden Trend in Bezug auf das Volumen anzeigt. Funktioniert perfekt mit anderen Indikatoren wie UR TrendExhaustion, um lokale Hochs und Tiefs zu signalisieren. Begrenzt auf nur 2 Parameter – je höher die Werte, desto länger werden die Trends angezeigt. Gradientenextreme zeigen mögliche Volumenerschöpfungen an, um eine potenzielle Trendwende abzufangen. Zwei Linien – Der Volumentrend und der Durchschnitt. Der
UR TrendExhaustion
Krzysztof Jan Debski
UR TrendErschöpfung   UR TrendExhaustion ist die beste Lösung für Trader, die sich nicht mit Parameterwerten oder anderen Einstellungen auseinandersetzen wollen – es ist sowohl einfach als auch visuell für jeden verständlich. Vorteile der Verwendung von UR TrendExhaustion: Keine Parameter Sie haben 3 Linien, die am besten beschreiben, was auf dem Chart vor sich geht: Trend-Erschöpfungslinie, Whale-Money-Linie und Retail-Money-Linie. Die Benutzeroberfläche zeigt die Erschöpfung beider Lini
UR HighsAndLows
Krzysztof Jan Debski
UR-Hochs und -Tiefs   UR Highs&Lows führt eine eingehende Analyse der Preisbewegung und ihrer Volatilität durch und erstellt einen Kanal, innerhalb dessen sich der Preis bewegt. Dieser Kanal bewegt sich jetzt als Oszillator und wird mit der Abweichung des Preises überlagert, um potenzielle Erschöpfungen und mögliche Umkehrungen anzuzeigen. Vorteile der Verwendung von UR Highs&Lows: Keine Parameter Sie haben 3 Linien, die die Preisbewegung beschreiben – die weiße Linie, die einen Durchschn
UR Momenter
Krzysztof Jan Debski
UR-Momenter   UR Momenter berechnet perfekt das Momentum des Preises in Korrelation zur Erschöpfung der als Oszillator dargestellten Preisbewegung. Daher gibt uns dies sehr frühe Signale für potenzielle Umkehrungen oder Retracements. Diese Formel wurde 2018 entdeckt, nachdem die Marktblase geplatzt war. Vorteile der Verwendung von UR Momenter: Keine Parameter Sie haben 2 Linien, die die Preisbewegung beschreiben - Weiße Linie, die das Momentum des Preises in Korrelation zur gleitenden Dur
UR FrontEndBackEnd
Krzysztof Jan Debski
UR FrontEndBackEnd   UR FrontEndBackEnd ist meine Lieblingsformel, um die genauesten Unterstützungs- und Widerstandsniveaus zu finden. Ich habe diese auch in verschiedene Kategorien (gestrichelte Linien, durchgezogene Linien und Bereiche) aufgeteilt, um zu markieren, wie stark sie sind. Alles wird in Puffern gespeichert, sodass sie leicht zugänglich sind und in anderen Tools implementiert werden können. Ergänzung: Das Tool muss möglicherweise an das Asset angepasst werden, auf das es angewe
UR Gamma
Krzysztof Jan Debski
UR-Gamma (unterstützt durch ähnliche Berechnungen, die in maschinellen Lernsystemen zu finden sind) UR Gamma ist ein hochmodernes Finanzanalysetool, das eine neue und verbesserte Interpretation des klassischen WaveTrend-Indikators bietet. Durch die Integration fortschrittlicher digitaler Signalverarbeitungstechniken adressiert UR Gamma einige der Einschränkungen traditioneller WaveTrend-Algorithmen und bietet einen genaueren, robusteren und dynamischeren Ansatz zur Identifizierung und Messung
UR Bands
Krzysztof Jan Debski
UR-Bänder (mit einer Formel, die in maschinellen Lernsystemen verwendet wird) UR Bands ist ein Indikator, der durch eine Formel abgeleitet wird, die die Marktvolatilität berücksichtigt und im Prinzip denen ähnelt, die in maschinellen Lernsystemen verwendet werden. Diese mathematische Darstellung der Marktbedingungen bietet eine präzise Analyse von Preistrends und -dynamiken unter Berücksichtigung der inhärenten Volatilität der Finanzmärkte. Durch die Einbeziehung der Volatilität als Variable
UR Vortex
Krzysztof Jan Debski
UR Vortex The Probabilistic UR Vortex Formula: An Accurate System for Predictive Market Analysis using Volatility and Standard Deviation Calculations. The   UR Vortex   indicator is a technical analysis tool that uses volatility and standard deviation calculations to predict potential tops and bottoms in a market. It measures the strength of a trend by calculating the distance between the current price and a moving average, and then standardizing this distance by dividing it by the average true
UR PulseScalp
Krzysztof Jan Debski
UR PulseScalp  Ein kalibrierter Handelsindikator für Scalper, die den ultimativen Vorteil in schnelllebigen Märkten suchen UR PulseScalp ist eine hochmoderne Handelslösung für Scalper, die den ultimativen Vorteil in schnelllebigen Märkten suchen. Dieser innovative Indikator basiert auf einer wissenschaftlich kalibrierten Formel, die die Kraft von Volatilität, MoneyFlow und Relative Strength kombiniert, um ein hochpräzises und zuverlässiges Signal zu erzeugen. Vorteile der Verwendung von UR
UR TradeManager
Krzysztof Jan Debski
UR_TradeManager für MetaTrader 4 Maximieren Sie Ihr Handelspotenzial mit dem UR_TradeManager, dem ultimativen Werkzeug zur Verbesserung des Handels, das speziell für die MetaTrader 4-Plattform entwickelt wurde. Dieses präzise und funktionale, umfassende Werkzeug ist unerlässlich für Händler, die ihre Fähigkeiten in Marktanalyse, Ausführung und Verwaltung verbessern möchten. Hauptmerkmale: Visuelles Handels-Dashboard : Verwalten Sie Ihre Trades direkt von einem ausgeklügelten Dashboard, das in Ih
UR Basket MT5
Krzysztof Jan Debski
UR-Korb   Das Beste, was Sie tun können, ist, Ihre Aufträge davor zu schützen, dass sie zu Verlusten werden. Sie können sich jetzt entspannen und UR Basket sich darum kümmern lassen. Vorteile der Verwendung von UR Basket: Alle Parameter sind im grafischen Bedienfeld Ihres Diagramms dynamisch änderbar - Sie müssen den EA NICHT neu starten, um die Parameter zu ändern oder die verwendeten Einstellungen abzurufen! Sie können Ihre Bestellungen verfolgen über:   - Magische Zahl   - EA-Kommentar
UR DivergenceSpotter   UR DivergenceSpotter ist das Ergebnis langjähriger Erfahrung und manchmal sind die einfachsten Wege die besten. Es gibt eine gute Korrelation zwischen einigen Indikatoren, aber wenn sie nicht übereinstimmen – versucht der Preis, sich „neu anzupassen“ – und in diesem Moment erhalten wir ein Signal mit UR DivergenceSpotter. Vorteile der Verwendung von UR Divergence Spotter: Keine Parameter Wird nicht neu gezeichnet, nachdem die Kerze erstellt wurde Signale, wenn das S
UR VolumeTrend MT5
Krzysztof Jan Debski
UR VolumenTrend   UR VolumeTrend ist der deutlichste Volumenindikator, der den anhaltenden Trend in Bezug auf das Volumen anzeigt. Funktioniert perfekt mit anderen Indikatoren wie UR TrendExhaustion, um lokale Hochs und Tiefs zu signalisieren. Begrenzt auf nur 2 Parameter – je höher die Werte, desto länger werden die Trends angezeigt. Gradientenextreme zeigen mögliche Volumenerschöpfungen an, um eine potenzielle Trendwende abzufangen. Zwei Linien – Der Volumentrend und der Durchschnitt. Der
UR TrendErschöpfung   UR TrendExhaustion ist die beste Lösung für Trader, die sich nicht mit Parameterwerten oder anderen Einstellungen auseinandersetzen wollen – es ist sowohl einfach als auch visuell für jeden verständlich. Vorteile der Verwendung von UR TrendExhaustion: Keine Parameter Sie haben 3 Linien, die am besten beschreiben, was auf dem Chart vor sich geht: Trend-Erschöpfungslinie, Whale-Money-Linie und Retail-Money-Linie. Die Benutzeroberfläche zeigt die Erschöpfung beider Lini
UR HighsAndLows MT5
Krzysztof Jan Debski
UR-Hochs und -Tiefs   UR Highs&Lows führt eine eingehende Analyse der Preisbewegung und ihrer Volatilität durch und erstellt einen Kanal, innerhalb dessen sich der Preis bewegt. Dieser Kanal bewegt sich jetzt als Oszillator und wird mit der Abweichung des Preises überlagert, um potenzielle Erschöpfungen und mögliche Umkehrungen anzuzeigen. Vorteile der Verwendung von UR Highs&Lows: Keine Parameter Sie haben 3 Linien, die die Preisbewegung beschreiben – die weiße Linie, die einen Durchschn
UR Momenter MT5
Krzysztof Jan Debski
UR-Momenter   UR Momenter berechnet perfekt das Momentum des Preises in Korrelation zur Erschöpfung der als Oszillator dargestellten Preisbewegung. Daher gibt uns dies sehr frühe Signale für potenzielle Umkehrungen oder Retracements. Diese Formel wurde 2018 entdeckt, nachdem die Marktblase geplatzt war. Vorteile der Verwendung von UR Momenter: Keine Parameter Sie haben 2 Linien, die die Preisbewegung beschreiben - Weiße Linie, die das Momentum des Preises in Korrelation zur gleitenden Dur
UR FrontEndBackEnd   UR FrontEndBackEnd ist meine Lieblingsformel, um die genauesten Unterstützungs- und Widerstandsniveaus zu finden. Ich habe diese auch in verschiedene Kategorien (gestrichelte Linien, durchgezogene Linien und Bereiche) aufgeteilt, um zu markieren, wie stark sie sind. Alles wird in Puffern gespeichert, sodass sie leicht zugänglich sind und in anderen Tools implementiert werden können. Ergänzung: Das Tool muss möglicherweise an das Asset angepasst werden, auf das es angewe
UR Gamma MT5
Krzysztof Jan Debski
UR-Gamma (unterstützt durch ähnliche Berechnungen, die in maschinellen Lernsystemen zu finden sind) UR Gamma ist ein hochmodernes Finanzanalysetool, das eine neue und verbesserte Interpretation des klassischen WaveTrend-Indikators bietet. Durch die Integration fortschrittlicher digitaler Signalverarbeitungstechniken adressiert UR Gamma einige der Einschränkungen traditioneller WaveTrend-Algorithmen und bietet einen genaueren, robusteren und dynamischeren Ansatz zur Identifizierung und Messung
UR Bands MT5
Krzysztof Jan Debski
UR-Bänder (mit einer Formel, die in maschinellen Lernsystemen verwendet wird) UR Bands ist ein Indikator, der durch eine Formel abgeleitet wird, die die Marktvolatilität berücksichtigt und im Prinzip denen ähnelt, die in maschinellen Lernsystemen verwendet werden. Diese mathematische Darstellung der Marktbedingungen bietet eine präzise Analyse von Preistrends und -dynamiken unter Berücksichtigung der inhärenten Volatilität der Finanzmärkte. Durch die Einbeziehung der Volatilität als Variable
UR PulseScalp MT5
Krzysztof Jan Debski
UR PulseScalp MT5 Ein kalibrierter Handelsindikator für Scalper, die den ultimativen Vorteil in schnelllebigen Märkten suchen UR PulseScalp MT5 ist eine hochmoderne Handelslösung für Scalper, die den ultimativen Vorteil in schnelllebigen Märkten suchen. Dieser innovative Indikator basiert auf einer wissenschaftlich kalibrierten Formel, die die Kraft von Volatilität, MoneyFlow und Relative Strength kombiniert, um ein hochpräzises und zuverlässiges Signal zu erzeugen. Vorteile der Verwendung
Auswahl:
Keine Bewertungen
Antwort auf eine Rezension