Pivot classic woodie camarilla fibonacci demark
- Indikatoren
- Emin Ulucanli
- Version: 1.10
- Aktualisiert: 28 Januar 2023
Pivot Classic, Woodie, Camarilla, Fibonacci and Demark
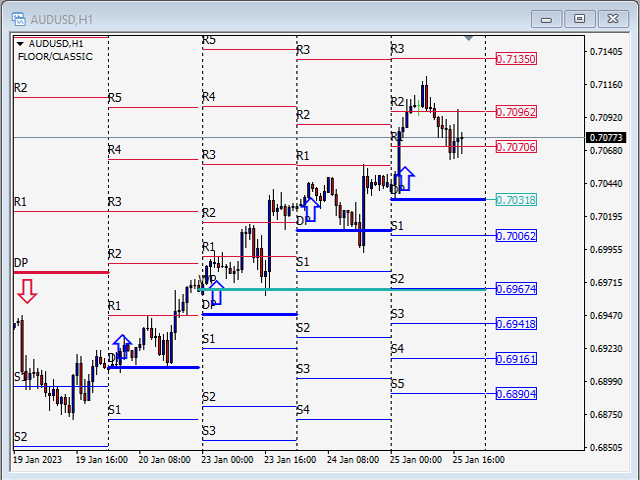
Floor/Classic
Pivot-Punkte oder einfach Pivots sind nützlich, um potenzielle Unterstützungs-/Widerstandsniveaus, Handelsspannen, Trendumkehrungen und die Marktstimmung zu identifizieren, indem sie die Höchst-, Tiefst- und Schlusswerte eines Vermögenswerts untersuchen. Die Floor/Classic Pivot Points können wie folgt berechnet werden.
Pivot Point (P) = (High + Low + Close)/3
S1 = P * 2 - High
S2 = P - (High - Low)
S3 = Low – 2*(High - P)
R1 = P * 2 - Low
R2 = P + (High - Low)
R3 = High + 2*(P - Low)
Woodie
Es unterscheidet sich von der Standardmethode zur Berechnung des Drehpunkts. Es verwendet die Differenz zwischen dem Hoch und Tief des Vortages, auch als Spanne bekannt, um Unterstützungs- und Widerstandsniveaus zu berechnen. Einige Händler ziehen es vor, die Woodie-Formeln zu verwenden, da sie dem Schlusskurs der Vorperiode mehr Gewicht verleihen. Die Woodie Pivot Points können wie folgt berechnet werden.
R2 = P + (H - L)
R1 = (2 * P) - LOW
P = (HIGH + LOW + (CLOSE * 2)) / 4
S1 = (2 * P) - HIGH
S2 = P - (H - L)
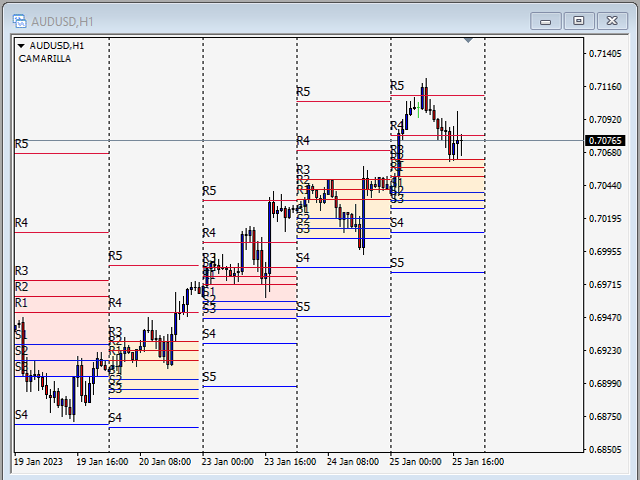
Camarilla
Die Camarilla-Formeln ähneln der Woodie-Formel. Seine Grundidee ist, dass der Preis dazu neigt, zu seinem Durchschnitt zurückzukehren. Die Camarilla-Ebenen helfen dabei, genaue Stop-Loss- und Gewinn-Orders anzuvisieren. Die wichtigsten Ebenen sind S3, S4 und R3, R4. Die Camarilla Pivot Points können wie folgt berechnet werden.
R4 = ((High - Low) * 1.1) / 2 + Close
R3 = ((High - Low) * 1.1) / 4 + Close
R2 = ((High - Low) * 1.1) / 6 + Close
R1 = ((High - Low) * 1.1) / 12 + Close
S1 = Close - ((High - Low) * 1.1) / 12
S2 = Close - ((High - Low) * 1.1) / 6
S3 = Close - ((High - Low) * 1.1) / 4
S4 = Close - ((High - Low) * 1.1) / 2
Fibonacci
Fibonacci-Pivotpunkt-Ebenen werden bestimmt, indem zuerst der Pivotpunkt berechnet wird, wie bei der Standardmethode. Dann multiplizieren Sie die Range des Vortages mit dem entsprechenden Niveau von Fibonacci. Die meisten Händler verwenden 38,2 %, 61,8 % und 100 % Korrekturen in ihren Berechnungen. Der Grund dafür ist, dass viele Händler Fibonacci-Quoten verwenden. Die Fibonacci Pivot Points können wie folgt berechnet werden.
Pivot Point (P) = (High + Low + Close)/3
Support 1 (S1) = P - (0.382 * (High - Low))
Support 2 (S2) = P - (0.6182 * (High - Low))
Support 3 (S3) = P - (1 * (High - Low))
Resistance 1 (R1) = P + (0.382 * (High - Low))
Resistance 2 (R2) = P + (0.6182 * (High - Low))
Resistance 3 (R3) = P + (1 * (High - Low))
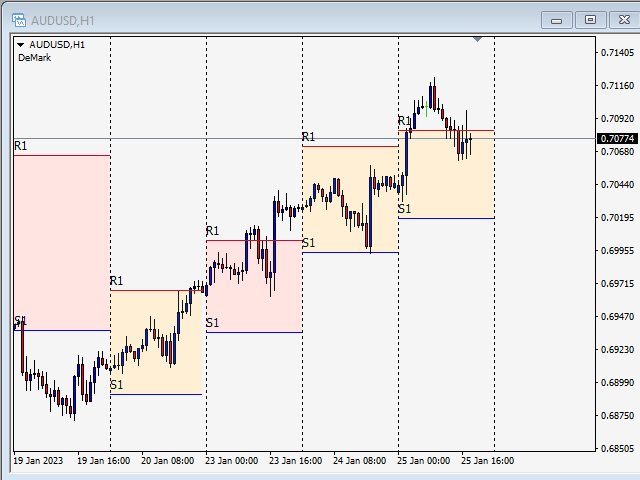
Demark
Diese Pivot-Punkte haben einen bedingten Charakter, der mehr Gewicht auf die jüngsten Kursbewegungen legt, basierend auf der Beziehung zwischen dem Eröffnungskurs und dem Schlusskurs. Die Demark Pivot Points können wie folgt berechnet werden.
If Close < Open, then X = High + (2 * Low) + Close
If Close > Open, then X = (2 * High) + Low + Close
If Close = Open, then X = High + Low + (2 * Close)
Support 1 (S1) = X/2 - High
Resistance 1 (R1) = X/2 - Low
gayet güzel olmuş. teşekkürler