• Übersicht
  • Bewertungen (6)
  • Diskussion (11)
  • Neue Funktionen

React Fibonacci Chart

5

Funktionen


  • Indikator für Fibonacci-Retracement-Handel
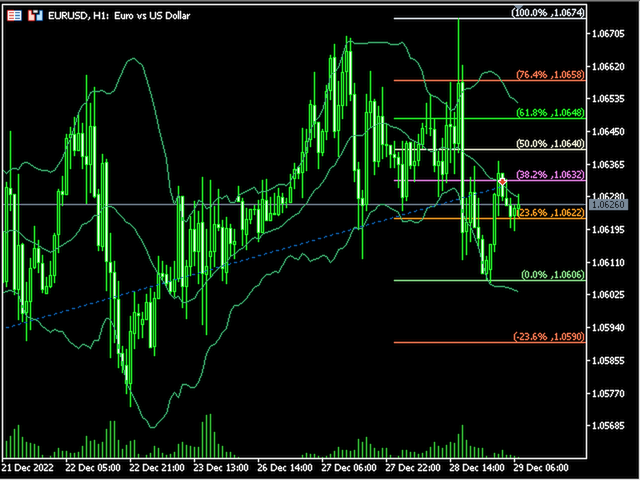
  • Ein Fibonacci-Diagramm wird basierend auf der vorherigen ausgewählten Kerze von 1H, 4H, 1D und 1W gezeichnet.
  • Wenn der Marktpreis das Fibonacci-Niveau berührt, ändert sich die Farbe und die Berührungszeit wird angezeigt.
  • Das Fibonacci-Diagramm wird bei den Niveaus -23.6, 0, 23.6, 38.2, 50, 61.8, 76.4, 100 und 123.6 gezeichnet und das Diagramm wird aktualisiert, wenn die Kerze aktualisiert wird.


Variablen


  • Zeitrahmen: Ein Fibonacci-Diagramm wird mit dem ausgewählten Zeitrahmen von 1H, 4H, 1D und 1W gezeichnet.
  • FiboWidth: Bestimmt die Dicke der Ebene.
  • FiboStyle: Legt den Stil der Pivot-Ebene fest.
  • TouchedColor: Farbe, die sich bei Berührung ändert.


Bitte kommentieren Sie, wenn Sie Fehler finden oder Verbesserungen wünschen.

Bewertungen sind eine große Hilfe für Entwickler. Wenn Sie zufrieden sind, geben Sie uns bitte 5 Sterne.


Bewertungen 6
August Tetteh
1208
August Tetteh 2024.04.25 12:21 
 

good

Calogero Vella
400
Calogero Vella 2024.03.21 09:25 
 

Thank you for this. i can make good use of it.

mynlife73
28
mynlife73 2023.11.23 08:51 
 

A very cool indicator, I would take money for it

Empfohlene Produkte
AliPivot Points is a Meta Trader 5 Indicator that draws you the latest pivot points. You can choose from timeframes ranging from 1 Minute to 1 Month. Calculation methods for pivot points includes: Classic Pivot Points Camarilla Pivot Points Fibonacci Pivot Points Woodie Pivot Points You can personalize the line colors, style, and width to suit your preference. The indicator displays values on the right side of the chart. AliPivot Points values can also be utilized by developers for creating Expe
FREE
Vertical Volume
Kim Yonghwa
5 (2)
Merkmal Indikator zur Überprüfung des Volumens nach Preis. Funktioniert hauptsächlich für EURUSD, bei anderen Währungspaaren kann es nicht funktionieren oder die Berechnung kann lange dauern. Für reibungslose Verwendung aktivieren Sie die Option "Ende der Diagrammgrenze vom rechten Rand verschieben", wie im Screenshot dargestellt. Wenn eine neue Balken-Daten erscheint, werden die Daten zurückgesetzt. Variablen COlOR: Einstellung der Farbe des Indikators WIDTH: Einstellung der Breite des I
FREE
Camarilla Swing Trade Indicator is an Indicator. Support and resistance points are calculated from the High Low Close of the previous TF Week's price. What are Camarilla Pivot Points? 1.Camarilla Pivot Points is a modified version of the classic Pivot Point. 2.Camarilla Pivot Points was launched in 1989 by Nick Scott, a successful bond trader. 3.The basic idea behind Camarilla Pivot Points is that price tends to revert to its mean until it doesn't. 4.Camarilla Pivot Points is a mathematical
FREE
Fair Value Gap Scanner
Usiola Oluwadamilol Olagundoye
The Fair Value Gap Detector is a MetaTrader 5 indicator designed to identify and draw rectangles on the chart wherever fair value gaps (FVGs) are detected. Fair value gaps occur when there is a significant disparity between the current price and the fair value of an asset. These gaps can provide valuable insights into potential trading opportunities, as they often indicate overbought or oversold conditions in the market. Key Features: FVG Detection: The indicator utilizes a proprietary algorith
FREE
Swiss VWAPsimple
Terence Gronowski
5 (4)
Swiss VWAPsimple Motivation Ich fand keinen zuverlässigen gratis VWAP Indikator für MT5. VWAP ist ein sehr wichtiger Indikator. Aber Vorsicht, er ist unpräzise, insbesondere am Abend, falls die Summen schon sehr gross sind. Um den Computer zu schonen und Abstürze zu vermeiden wird der VWAP nur immer von Mitternacht aus gezeichnet. Bei geschlossenen Märkten wird nichts angezeigt, ausser man deaktiviert useBarsSinceMidnight. Was ist VWAP, wie wird er angewandt?  VWAP steht für Volume Weighed Ave
FREE
Whether you're an analyst looking for a Fibonacci charting platform for Fibonacci Ratio analysis, or a trader looking for an advanced Fibonacci trading tool, Ultimate Fibonacci  has what you need. Ultimate Fibonacci   has the most advanced and full-featured Fibonacci charting and trading software on the market. GIVE ME A GOOD RATING! Ultimate Fibonacci  measures and calculates Fibonacci projections and Retracement levels for you, as well as Price projections (like Wave 2 vs. 1 or Wave 4 vs. 2
FREE
The selective pin bar is designed to identify reversals. To use the selective pin bar effectively, traders typically look for Strong Rejection: The tail of the pin bar should extend significantly beyond the surrounding price action. It indicates that there was a sharp rejection of higher or lower prices during the trading period. A strong rejection suggests that the market sentiment may be changing.
FREE
Der Trendfänger: Die Strategie des Trendfängers mit Alarmindikator ist ein vielseitiges technisches Analysewerkzeug, das Händlern hilft, Markttrends und potenzielle Ein- und Ausstiegspunkte zu identifizieren. Sie verfügt über eine dynamische Trendfängerstrategie, die sich den Marktbedingungen anpasst, um eine klare visuelle Darstellung der Trendrichtung zu ermöglichen. Händler können die Parameter an ihre Vorlieben und Risikotoleranz anpassen. Der Indikator hilft bei der Trendidentifikation,
FREE
Gatotkaca Support Resistance Trendline Indicator is a simple indicator that detects support, resistance and trendlines. It will helps you find breakout momentum based on lines calculated by this indicator. This is conceptually based on fractals, but with customizable periods.  Compatible for any timeframes. You can customize how this indicator work by setting up the period input.
FREE
Get ALERTS for break of your TRENDLINES, SUPPORT LINES, RESISTANCE LINE, ANY LINE!! 1. Draw a line on the chart (Trend, support, resistance, whatever you like) and give it a name (e.g. MY EURUSD line) 2. Load the Indicator and input the Line Name the same name in Indicator INPUT so system knows the name of your line (= MY EURUSD line) 3. Get Alerts when Price breaks the line and closes Works on All Time frames and charts LEAVE A COMMENT AND IF THERE IS ENOUGH INTEREST I WILL WRITE AN EA WHICH
FREE
This indicator is stand alone version from  MP Pivot Levels  (All in one) containing Demark's Pivots. Calculations:     PP = X / 4     R1 = X / 2 - LOWprev     S1 = X / 2 - HIGHprev Uses: When the pair currency price may change the direction of movement. Possible constraints of support and resistance that creates plateaus for the currency pair prices. Tendency identification by comparing the present prices according to current day's pivot point and also the prior day's pivot points. ___________
FREE
Large Price MT5
Nino Guevara Ruwano
For traders, monitoring price movements is a constant activity, because each price movement determines the action that must be taken next. This simple indicator will helps traders to display prices more clearly in a larger size. Users can set the font size and choose the color that will be displayed on the chart. There are three color options that can be selected to be displayed on the chart.
FREE
FaU fibo
Aleksandr Dementev
The indicator draws actual Fibonacci levels for your trading activity. The levels are redrawn every time after the price touches the low (0%) or the 100% fibonacci level. In the parameters, select the trading activity: Long term investor Medium term investor Medium-term investor active Short term investor Short-term investor active Speculator Speculator active Scalper Scalper active Try this indicator in action, and you will no longer have to look for coordinates for drawing fibonacci level
FREE
The   Pivot Point indicator   automatically calculates and displays the pivot point line and support and resistance levels. Pivot can be calculated according to the Classic, Floor, Fibonacci, Woodie, Camarilla or DeMark formula. It is also possible to select the period for calculating the indicator. A trader can choose from daily, weekly, monthly, or user-defined periods. Types of pivots Classic Floor Fibonacci Woodie Camarilla DeMark Main features The indicator shows the current and histor
FREE
Engulfing Candle Detector Detectable pattern Double Candlestick Patterns Bullish Engulfing The first candle is black candle. The second candle opens with a gap below the real body of the black candle but rallies upwards to close above the real body of the black candle. In other words, the second candle's real body completely engulfs the first candle's real body Bearish Engulfing The first candle is white candle. The second candle opens with a gap above the real body of the white candle but
FREE
Value Chart Candlesticks
Flavio Javier Jarabeck
4.67 (9)
The idea of a Value Chart indicator was presented in the very good book I read back in 2020 , " Dynamic Trading Indicators: Winning with Value Charts and Price Action Profile ", from the authors Mark Helweg and David Stendahl. The idea is simple and the result is pure genius: Present candlestick Price analysis in a detrended way! HOW TO READ THIS INDICATOR Look for Overbought and Oversold levels. Of course, you will need to test the settings a lot to find the "correct" one for your approach.
FREE
Free automatic Fibonacci is an indicator that automatically plots a Fibonacci retracement based on the number of bars you select on the BarsToScan setting in the indicator. The Fibonacci is automatically updated in real time as new highest and lowest values appears amongst the selected bars. You can select which level values to be displayed in the indicator settings. You can also select the color of the levels thus enabling the trader to be able to attach the indicator several times with differe
FREE
White Weis Volume Ticks
Ricardo Almeida Branco
5 (3)
White Weis Volume This indicator shows the sum of the volume in each wave, bulish or bearish, as idealized by David Weis , but it brings an important addition , which is the marking of the bar with the highest volume of the wave (White Bar)! In coding the indicator, it was sought to optimize the code to require minimal processing during use and not to overload mt5. The indicator can be used for pre-trading analysis and study, where the trader analyzes possible points of support and resi
Die Supply and Demand Order Blocks: Der Indikator "Supply and Demand Order Blocks" ist ein anspruchsvolles Tool, das auf den Konzepten des Smart Money basiert und für die technische Analyse im Devisenhandel unerlässlich ist. Er konzentriert sich darauf, Angebot und Nachfrage Zonen zu identifizieren, entscheidende Bereiche, in denen institutionelle Händler deutliche Spuren hinterlassen. Die Angebotszone, die Verkaufsaufträge anzeigt, und die Nachfragezone, die Kaufaufträge anzeigt, helfen Händ
FREE
One of the simplest Pivot Point indicator, easy to operate, and most complete for a single chart in determining    Resistance   and   Support  level lines. In single chart,  it will show R&S Level Line with 5 popular types of Pivot Point, Highest&Lowest of closing price Include the Trend and up to 3 Time Frames. Five   types   (Floor, Woodie, Camarilla, DeMark, & Fibonacci)   of popular   Pivot Points   in determining   Resistance   and   Support   levels. With just using simple button on th
FREE
Institutionelle Ebenen / Bankebenen ... Psychologische Ebenen / Quartierstheorie. Dieser Indikator zeichnet automatisch die Ebenen „000, 200, 500 und 800“, was ich als „institutionelle Ebenen“ kenne, ODER kann auch die Ebenen „000, 250, 500 und 750“ auf das Diagramm zeichnen. Je nachdem, wo Sie den Handel auf institutioneller Ebene / die Theorie der Quartale gelernt haben, kennen Sie diese möglicherweise als unterschiedliche Namen. Die Kernidee besteht im Wesentlichen darin, dass diese Ebe
FREE
TickChart Indicator plots tick line on the main window of MetaTrader. In the Lite version, the number of ticks is limited to 20 and the alert function described below is omitted.  The tick-line shows the most detailed, fastest and real-time activities of the market, which are usually hidden in bars or candles longer than 1 minute. Usually, several new tick-line segments appear while a bar of M1 time frame is completed. After the release of an important economic indicator, the number of ticks pe
FREE
A countdown timer for the  Volume bar chart generator  and  Tick chart generator  products, which are available for download from the MQL5 Market: Tick chart generator: https://www.mql5.com/en/market/product/29215 Volume bar chart generator: https://www.mql5.com/en/market/product/47197 The counter conveniently displays the number of ticks or transactions (depending on the chart) that need to pass for a new bar to start printing. The user can set the following indicator inputs. Volume type
FREE
Easy Trend MQL5
David Jumbo
4.75 (4)
PLEASE HELP REVIEW/ SUPPORT/ SHARE THIS OTHER INDICATOR  HERE  https://www.mql5.com/en/market/product/51637  AS YOU DOWNLOAD THIS ONE FOR FREE. THANKS. This Indicator is based on four moving averages and the PIVOT points. The indicator provides clarity to trading, especially in ranging markets when price is very slow and tight. You can trade intensively daily, every day with this indicator. You may decide to trade with this indicator alone and get the maximum out of the market. The indicator
FREE
Levels of Pivots
Nikolay Mitrofanov
The utility draws reversal levels using the formulas for each of the selected number of candles: Pivot = (high + close + low) / 3 R1 = ( 2 * Pivot) - low S1 = ( 2 * Pivot) - high R2 = Pivot + (R1 -S1) R3 = high + ( 2 * (Pivot - low)) S2 = Pivot - (R1 - S1) S3 = low - ( 2 * (high - Pivot)) H = high L = low U = if the candle is bullish, then close. Otherwise - open D = if the candle is bullish, then open. Otherwise - close On any timeframe. After a new candle closes on the calculated timefr
FREE
Central Pivot Tool MT5
Conor Stephenson
5 (8)
Die Ebenen des zentralen Pivot-Bereichs werden um einen zentralen Pivot-Punkt herum gebildet. Diese Niveaus in Bezug auf den zentralen Pivot können verwendet werden, um zahlreiche Marktverhalten und mögliche Ergebnisse zu bestimmen. Die Entfernung vom zentralen Pivot und der Preis, den sich neue Niveaus im Verhältnis zu den Niveaus des Vortages bilden, können verwendet werden, um die Trendrichtung und -stärke der folgenden Tage zu bestimmen. Central Pivot Ranges können als Unterstützung u
FREE
Drawing Parabolic Channels
BeeXXI Corporation
5 (6)
Convenient drawing of parabolic channels by four points (two lower and two upper extremums). Additional control keys: N (New) - Start drawing a new channel. C (Clear) - Deletes the current channel. By default, the current channel is the last channel. But you can click on the line of any channel to make it current. Click on the gear in the upper right corner to set some parameters for all channels or the current channel. All work is visible from the animated Gif. Do not forget to express your
FREE
VWAP Indicator
LUC JACOBUS A VERHEECKE
4.19 (21)
Volume Weighted Average Price (VWAP) The volume weighted average price (VWAP) is a   trading   benchmark   used by traders that gives the average price a security has traded at throughout the day, based on both volume and price. It is important because it provides traders with insight into both the trend and value of a security. This indicator VWAP V2 is free and is the manual version of the extended Easy VWAP indicator (30 Euro), where the date and time properties are automatically entered. Wit
FREE
Daily Monitoring : The indicator automatically calculates and displays the daily drawdown on your trading chart, allowing you to see how well you're performing on a daily basis. Risk Management : By monitoring daily drawdown, traders can better manage their risk. It helps to keep daily losses within acceptable limits. Real-Time Information : Daily drawdown is updated in real-time, providing accurate and up-to-date information about your trading performance. How to Use: Activate the "Daily Drawd
FREE
Amiguinhos Bar Counter
Eduardo Correia Da Silva
3 (2)
Amiguinho's Bar Counter is a price action indicator to display the bar count (candles) with some interesting options. About the "Period of analysis" parameter: if the current timeframe is in minutes, then the analysis period will be considered in days; if the current timeframe is in days, then the analysis period will be considered in months; or  if the period of analysis will be considered in years.
FREE
Käufer dieses Produkts erwarben auch
Zunächst einmal ist es wichtig zu betonen, dass dieses Handelssystem ein Nicht-Repainting-, Nicht-Redrawing- und Nicht-Verzögerungsindikator ist, was es sowohl für manuelles als auch für automatisches Trading ideal macht. Das "Smart Trend Trading System MT5" ist eine umfassende Handelslösung, die für neue und erfahrene Trader maßgeschneidert ist. Es kombiniert über 10 Premium-Indikatoren und bietet mehr als 7 robuste Handelsstrategien, was es zu einer vielseitigen Wahl für verschiedene Marktbe
Atomic Analyst MT5
Issam Kassas
4.82 (11)
Zunächst einmal ist es erwähnenswert, dass dieser Handelsindikator nicht neu malt, nicht neu zeichnet und keine Verzögerung aufweist, was ihn sowohl für manuellen als auch für Roboterhandel ideal macht. Der Atom-Analyst ist ein PA-Preisaktionsindikator, der die Stärke und das Momentum des Preises nutzt, um einen besseren Vorteil auf dem Markt zu finden. Ausgestattet mit fortschrittlichen Filtern, die helfen, Rauschen und falsche Signale zu entfernen, und das Handelspotenzial zu erhöhen. Durch
FX Volume MT5
Daniel Stein
4.94 (17)
Erhalten Sie Ihr tägliches Marktupdate mit Details und Screenshots über unser Morning Briefing hier auf mql5 und auf Telegram ! FX Volume ist der ERSTE und EINZIGE Volumenindikator, der einen ECHTEN Einblick in die Marktstimmung aus Sicht eines Brokers bietet. Es bietet fantastische Einblicke in die Positionierung von institutionellen Marktteilnehmern, wie z.B. Brokern, auf dem Forex-Markt, viel schneller als COT-Berichte. Diese Informationen direkt auf Ihrem Chart zu sehen, ist der wahre Game
Quantum Trend Sniper
Bogdan Ion Puscasu
5 (37)
Wir stellen vor       Quantum Trend Sniper Indicator   , der bahnbrechende MQL5-Indikator, der die Art und Weise, wie Sie Trendumkehrungen erkennen und handeln, verändert! Entwickelt von einem Team erfahrener Händler mit über 13 Jahren Handelserfahrung,       Quantum Trend Sniper-Indikator       wurde entwickelt, um Ihre Trading-Reise mit seiner innovativen Methode zur Identifizierung von Trendumkehrungen mit extrem hoher Genauigkeit auf ein neues Niveau zu heben. ***Kaufe Quantum Trend Snipe
Trend Screener Pro MT5
STE S.S.COMPANY
4.89 (61)
Nutzen Sie die Macht des Trendhandels mit Trend Screener Indicator: Ihrer ultimativen Trendhandelslösung, die auf Fuzzy-Logik und einem System mit mehreren Währungen basiert! Steigern Sie Ihren Trendhandel mit Trend Screener, dem revolutionären Trendindikator mit Fuzzy-Logik. Es handelt sich um einen leistungsstarken Trendfolgeindikator, der über 13 Premium-Tools und -Funktionen sowie 3 Handelsstrategien kombiniert und ihn zu einer vielseitigen Wahl macht, um Ihren Metatrader in einen Trendanaly
Gold Stuff mt5
Vasiliy Strukov
4.89 (166)
Gold Stuff mt5-Ein Trendindikator, der speziell für Gold entwickelt wurde, kann auch auf allen Finanzinstrumenten verwendet werden. Der Indikator wird nicht neu gezeichnet und verzögert sich nicht. Empfohlener Zeitrahmen H1. WICHTIG! Kontaktieren Sie mich sofort nach dem Kauf, um Anweisungen und Bonus zu erhalten! DATEN Draw Arrow - inkl.aus. zeichnen von Pfeilen in einem Diagramm. Alerts-inkl.aus.akustische Warnungen. E - mail notification-inkl.aus. benachrichtigungen per E-Mail. Puch-
Zunächst einmal ist es wichtig zu betonen, dass dieses Handelstool ein Nicht-Repaint-, Nicht-Redraw- und Nicht-Verzögerungsindikator ist, was es ideal für professionelles Trading macht. Der Smart Price Action Concepts Indikator ist ein sehr leistungsstarkes Werkzeug sowohl für neue als auch erfahrene Händler. Er vereint mehr als 20 nützliche Indikatoren in einem und kombiniert fortgeschrittene Handelsideen wie die Analyse des Inner Circle Traders und Strategien des Smart Money Concepts. Diese
Dies ist ein Indikator für MT5, der genaue Signale für den Einstieg in einen Handel ohne Repainting (Neuzeichnen) liefert. Er kann auf alle Finanzwerte angewendet werden: Forex, Kryptowährungen, Metalle, Aktien, Indizes. Er liefert ziemlich genaue Schätzungen und sagt Ihnen, wann es am besten ist, eine Position zu eröffnen und zu schließen. Sehen Sie sich das Video (6:22) mit einem Beispiel für die Verarbeitung nur eines Signals an, das sich für den Indikator gelohnt hat! Die meisten Händler ver
FX Power MT5 NG
Daniel Stein
5 (4)
Erhalten Sie Ihr tägliches Marktupdate mit Details und Screenshots über unser Morning Briefing hier auf mql5 und auf Telegram ! FX Power MT5 NG ist die nächste Generation unseres langjährig sehr beliebten Währungsstärkemessers FX Power. Und was bietet dieser Stärkezähler der nächsten Generation? Alles, was Sie am ursprünglichen FX Power geliebt haben PLUS GOLD/XAU-Stärkeanalyse Noch präzisere Berechnungsergebnisse Individuell konfigurierbare Analysezeiträume Anpassbares Berechnungslimit für noc
RelicusRoad Pro MT5
Relicus LLC
4.82 (22)
Jetzt 147 US -Dollar (nach ein paar Aktualisierungen auf 499 US -Dollar) - Unbegrenzte Konten (PCs oder MACs) RelicusRoad Benutzerhandbuch + Schulungsvideos + Zugang zur privaten Discord-Gruppe + VIP-Status EINE NEUE ART, DEN MARKT ZU BETRACHTEN RelicusRoad ist der weltweit leistungsstärkste Handelsindikator für Forex, Futures, Kryptowährungen, Aktien und Indizes und gibt Händlern alle Informationen und Tools, die sie benötigen, um profitabel zu bleiben. Wir bieten technische Analysen un
Auto Order Block with break of structure based on ICT and Smart Money Concepts Futures Break of Structure ( BoS )             Order block ( OB )            Higher time frame Order block / Point of Interest ( POI )    shown on current chart           Fair value Gap ( FVG ) / Imbalance   ,  MTF      ( Multi Time Frame )    Volume Imbalance     ,  MTF          vIMB Gap’s Equal High / Low’s     ,  MTF             EQH / EQL Liquidity               Current Day High / Low           HOD /
XQ Indicator MetaTrader 5
Marzena Maria Szmit
5 (1)
Step into the realm of Forex trading with confidence and precision using XQ, a cutting-edge Forex indicator designed to elevate your trading game to unprecedented heights. Whether you're a seasoned trader or just stepping into the world of currency exchange, XQ Forex Indicator empowers you with the insights and signals needed to make informed trading decisions. The signal conditions are a combination of three indicators, and XQ Forex Indicator only display  medium and long-term trends . The ind
Blahtech Supply Demand MT5
Blahtech Limited
4.57 (14)
Was: $299  Now: $99   Supply Demand uses previous price action to identify potential imbalances between buyers and sellers. The key is to identify the better odds zones, not just the untouched ones. Blahtech Supply Demand indicator delivers functionality previously unavailable on any trading platform. This 4-in-1 indicator not only highlights the higher probability zones using a multi-criteria strength engine, but also combines it with multi-timeframe trend analysis, previously confirmed swings
Advanced Supply Demand MT5
Bernhard Schweigert
4.53 (15)
Derzeit 33% Rabatt! Die beste Lösung für jeden Anfänger oder erfahrenen Händler! Dieser Indikator ist ein einzigartiges, qualitativ hochwertiges und erschwingliches Trading-Tool, da wir eine Reihe von proprietären Funktionen und eine neue Formel integriert haben. Mit diesem Update werden Sie in der Lage sein, doppelte Zeitrahmenzonen anzuzeigen. Sie können nicht nur einen höheren TF (Zeitrahmen) anzeigen, sondern sowohl den Chart-TF als auch den höheren TF: SHOWING NESTED ZONES. Alle Supply Dema
ICT, SMC, SMART MONEY CONCEPTS, SMART MONEY, Smart Money Concept, Support and Resistance, Trend Analysis, Price Action, Market Structure, Order Blocks, BOS/CHoCH,   Breaker Blocks ,  Momentum Shift,   Supply&Demand Zone/Order Blocks , Strong Imbalance,   HH/LL/HL/LH,    Fair Value Gap, FVG,  Premium  &   Discount   Zones, Fibonacci Retracement, OTE, Buy Side Liquidity, Sell Side Liquidity, BSL/SSL Taken, Equal Highs & Lows, MTF Dashboard, Multiple Time Frame, BigBar, HTF OB, HTF Market Structure
Der Gann Square Indikator ist ein leistungsstolles Marktanalyse-Tool, das auf dem Artikel "Mathematische Formel für Marktvorhersagen" von W.D. Gann basiert. Dieses Tool verwendet mathematische Konzepte und Gann-Theorien für eine präzise Marktanalyse. Es beinhaltet Quadratwerte von 144, 90, 52 und auch das Quadrat von 9. Darüber hinaus integriert es die Methode von  zur Quadratwurzel von 9 und deren Beziehung zu Kanälen und dem Sternmuster. Benutzerhandbuch und Anwendung: Vor der Verwendung diese
AW Trend Predictor MT5
AW Trading Software Limited
4.76 (54)
Die Kombination von Trend- und Aufschlüsselungsebenen in einem System. Ein fortschrittlicher Indikatoralgorithmus filtert Marktrauschen, bestimmt den Trend, Einstiegspunkte sowie mögliche Ausstiegsniveaus. Indikatorsignale werden in einem Statistikmodul aufgezeichnet, das es Ihnen ermöglicht, die am besten geeigneten Tools auszuwählen, die die Wirksamkeit der Signalhistorie zeigen. Der Indikator berechnet Take-Profit- und Stop-Loss-Marken. Handbuch und Anleitung ->   HIER   / MT4-Version ->   H
Werden Sie Breaker Trader und profitieren Sie von Änderungen der Marktstruktur, wenn sich der Preis umkehrt. Der Order Block Breaker Indikator zeigt an, wann sich eine Trend- oder Preisbewegung der Erschöpfung nähert und bereit ist, sich umzukehren. Es weist Sie auf Änderungen in der Marktstruktur hin, die normalerweise auftreten, wenn eine Umkehrung oder ein größerer Rückzug bevorsteht. Der Indikator verwendet eine proprietäre Berechnung, die Ausbrüche und Preisdynamik identifiziert. Jedes
The Volume by Price Indicator for MetaTrader 5 features Volume Profile and Market Profile TPO (Time Price Opportunity). Get valuable insights out of currencies, equities and commodities data. Gain an edge trading financial markets. Volume and TPO histogram bar and line charts. Volume Footprint charts. TPO letter and block marker charts including split structures. Versatile segmentation and compositing methods. Static, dynamic and flexible ranges with relative and/or absolute visualizations. Lay
Wir stellen vor       Quantum Breakout PRO   , der bahnbrechende MQL5-Indikator, der die Art und Weise, wie Sie mit Breakout-Zonen handeln, verändert! Entwickelt von einem Team erfahrener Händler mit über 13 Jahren Handelserfahrung,       Quantum Breakout PRO       ist darauf ausgelegt, Ihre Handelsreise mit seiner innovativen und dynamischen Breakout-Zone-Strategie auf ein neues Niveau zu heben. Der Quantum Breakout Indicator zeigt Ihnen Signalpfeile auf Breakout-Zonen mit 5 Gewinnzielzone
TrendLine PRO MT5
Evgenii Aksenov
4.78 (49)
The Trend Line PRO indicator is an independent trading strategy. It shows the trend change, the entry point to the transaction, as well as automatically calculates three levels of Take Profit and Stop Loss protection Trend Line PRO is perfect for all Meta Trader symbols: currencies, metals, cryptocurrencies, stocks and indices Advantages of Trend Line PRO Never redraws its signals The possibility of using it as an independent strategy It has three automatic levels Take Profit and Stop Loss lev
Owl Smart Levels MT5
Sergey Ermolov
4.47 (36)
MT4-Version  |  FAQ Der Owl Smart Levels Indikator ist ein komplettes Handelssystem innerhalb eines Indikators, der so beliebte Marktanalysetools wie die fortschrittlichen Fraktale von Bill Williams , Valable ZigZag, das die richtige Wellenstruktur des Marktes aufbaut, und Fibonacci-Levels , die die genauen Einstiegslevels markieren, enthält in den Markt und Orte, um Gewinne mitzunehmen. Detaillierte Strategiebeschreibung Anleitung zur Verwendung des Indikators Berater-Assistent im Handel Owl H
Gartley Hunter Multi
Siarhei Vashchylka
5 (5)
Gartley Hunter Multi - An indicator for searching for harmonic patterns simultaneously on dozens of trading instruments and on all classic timeframes: (m1, m5, m15, m30, H1, H4, D1, Wk, Mn). Manual (Be sure to read before purchasing) | Version for MT4 Advantages 1. Patterns: Gartley, Butterfly, Shark, Crab. Bat, Alternate Bat, Deep Crab, Cypher 2. Simultaneous search for patterns on dozens of trading instruments and on all classic timeframes 3. Search for patterns of all possible sizes. Fr
Trend Line Map Pro MT5
STE S.S.COMPANY
4.67 (9)
Trend Line Map Indicator ist ein Add-On für Trend Screener Indicator. Es arbeitet als Scanner für alle Signale, die vom Trendscreener (Trendliniensignale) erzeugt werden. Es ist ein Trend Line Scanner basierend auf dem Trend Screener Indicator. Wenn Sie keinen Trend Screener Pro Indicator haben, funktioniert die Trend Line Map Pro nicht. It's a Trend Line Scanner based on Trend Screener Indicator. If you don't have Trend Screener Pro Indicator,     the Trend Line Map Pro will not work .
TrendDecoder Premium MT5
Christophe, Pa Trouillas
5 (1)
Top bewertet auf anderem MarketPlace -  Jetzt verfügbar auf METATRADER Identifizieren Sie Bereiche und die nächsten wahrscheinlichen Bewegungen     |    Erhalten Sie früheste Signale und die Stärke von Trends     |    Klare Ausstiegssignale vor Umkehrung     |    Erkennen Sie die Fibo-Levels, die der Kurs testen wird    |  Indikator, der nicht zurückverfolgt, nicht verzögert - ideal für den manuellen und automatisierten Trading - geeignet für alle Vermögenswerte und Zeiteinheiten - 50% Rabatt  
MetaBands M5
Vahidreza Heidar Gholami
4.67 (3)
MetaBands verwendet leistungsstarke und einzigartige Algorithmen, um Kanäle zu zeichnen und Trends zu erkennen, sodass es Tradern potenzielle Punkte für den Einstieg und Ausstieg aus Trades bieten kann. Es ist ein Kanalindikator sowie ein leistungsstarker Trendindikator. Es umfasst verschiedene Arten von Kanälen, die einfach durch Verwendung der Eingabeparameter zusammengeführt werden können. MetaBands verwendet alle Arten von Warnmeldungen, um Benutzer über Marktereignisse zu informieren. Funkt
TPSpro TRENDPRO  - is a trend indicator that automatically analyzes the market and provides information about the trend and each of its changes, as well as giving signals for entering trades without redrawing! The indicator uses each candle, analyzing them separately. referring to different impulses - up or down impulse. Exact entry points into transactions for currencies, crypto, metals, stocks, indices!  -  Version MT4                  DETAILED DESCRIPTION        /       TRADING SETUPS       
Was: $249  Now: $99   Market Profile defines a number of day types that can help the trader to determine market behaviour. A key feature is the Value Area, representing the range of price action where 70% of trading took place. Understanding the Value Area can give traders valuable insight into market direction and establish the higher odds trade. It is an excellent addition to any system you may be using. Inspired by Jim Dalton’s book “Mind Over Markets”, this indicator is designed to suit the
Zeichnen Sie automatisch Unterstützungs- und Widerstandsniveaus PLUS Antriebskerzenlücken auf Ihrem Chart ein, so dass Sie sehen können, wohin sich der Preis wahrscheinlich als Nächstes bewegen und/oder möglicherweise umkehren wird. Dieser Indikator wurde entwickelt, um als Teil der Positionshandelsmethodik verwendet zu werden, die auf meiner Website (The Market Structure Trader) gelehrt wird, und zeigt Schlüsselinformationen für die Zielsetzung und potenzielle Einstiege an. MT4 Version:  htt
Golden Spikes Detector
Batsirayi L Marango
5 (1)
Golden Spikes Detector This indicator is based on an advanced strategy primarily for trading spikes on Boom and Crash Indices. Complex algorithms were implemented to detect high probability entries only. It alerts on potential Buy and Sell entries. To trade spikes on the Deriv or Binary broker, only take Buy Boom and Sell Cash alerts. It was optimised to be loaded on 5-minute timeframe although multiple timeframe analysis is done in the background. Features ·             Desktop pop up and sound
Weitere Produkte dieses Autors
Vertical Volume
Kim Yonghwa
5 (2)
Merkmal Indikator zur Überprüfung des Volumens nach Preis. Funktioniert hauptsächlich für EURUSD, bei anderen Währungspaaren kann es nicht funktionieren oder die Berechnung kann lange dauern. Für reibungslose Verwendung aktivieren Sie die Option "Ende der Diagrammgrenze vom rechten Rand verschieben", wie im Screenshot dargestellt. Wenn eine neue Balken-Daten erscheint, werden die Daten zurückgesetzt. Variablen COlOR: Einstellung der Farbe des Indikators WIDTH: Einstellung der Breite des I
FREE
Merkmal Weniger Einrichtungsaufwand und vollautomatischer Handel mit Variablenmanipulation Handel mit Durchbruchsstrategie und Trailing Forschung mit echten Tick-Daten von 2017 bis 2023 Gewinnrate von 91,5 % und maximaler Drawdown von 29 % Funktioniert nur mit dem Währungspaar EURUSD, im 1-Stunden-Zeitrahmen und erfordert ein ECN-Konto ohne Spread Anforderungen Handelswährung nur EURUSD Zeitrahmen nur 1 Stunde Anfangseinlage mehr als 1000 USD Hebel weniger als 1:500 Konto ECN-Konto ohne Sprea
Auswahl:
August Tetteh
1208
August Tetteh 2024.04.25 12:21 
 

good

GG61251
44
GG61251 2024.04.09 19:07 
 

alles bestens, danke

Calogero Vella
400
Calogero Vella 2024.03.21 09:25 
 

Thank you for this. i can make good use of it.

mynlife73
28
mynlife73 2023.11.23 08:51 
 

A very cool indicator, I would take money for it

dany007
33
dany007 2023.09.08 21:14 
 

very useful and handy indicator.

Ruhail Ashraf Khan
630
Ruhail Ashraf Khan 2023.05.19 08:03 
 

Super

Antwort auf eine Rezension
Version 1.5 2023.10.23
bug. fix
Version 1.4 2023.10.22
Alarm bei Berührung der Fibo-Ebene
Option zum Farbwechsel hinzufügen
Version 1.3 2023.09.02
remove fibo-level limit and add variable
Version 1.2 2023.05.28
add fibolevel option
Version 1.1 2022.12.29
chart move and small fix