The Real Supertrend
- Indikatoren
- David Hausberger
- Version: 1.0
- Aktivierungen: 10
Der Legendäre Supertrend Indikator jetzt zum Spar Preis!!!!!
Mein Supertrend Indikator gibt ihnen klare Ein und Ausstiegs Signale.
Der Indikator ist volatilitätsbasiert und ist in seiner Funktion eher ein trendfolgender Indikator.
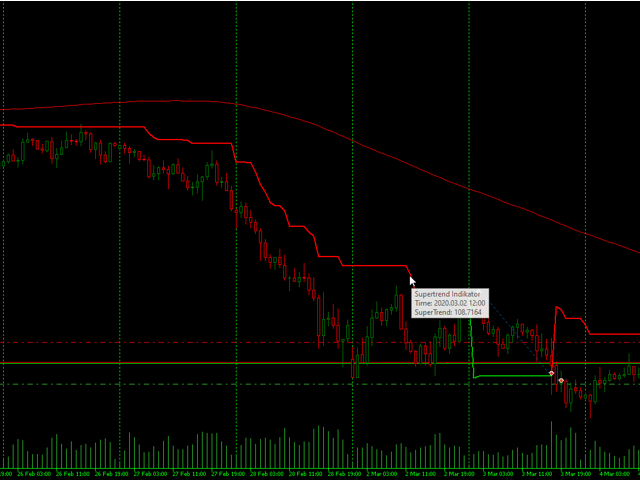
Durch den ATR Indikator, der in der Berechnung des Supertrends integriert ist, werden Kurslücken (Gaps) mitberechnet und nicht übersehen. Dadurch können genauere Werte errechnet werden.
Bei der Messung der Volatilität dient der Mittelwert des aktuellen Kurses als Basis.
Da sich der Supertrend Indikator durch gleitende Stopp- und Umkehrlinien auszeichnet, ist er in seiner Funktion dem Parabolic SAR Indikator ziemlich ähnlich.
Der Supertrend Indikator bewegt sich immer in Trendrichtung.
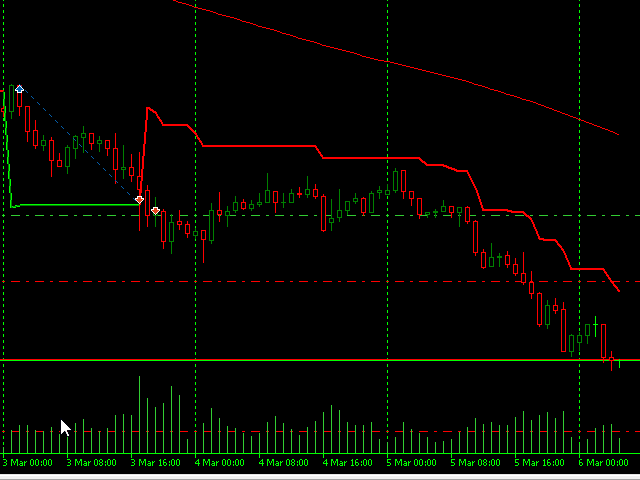
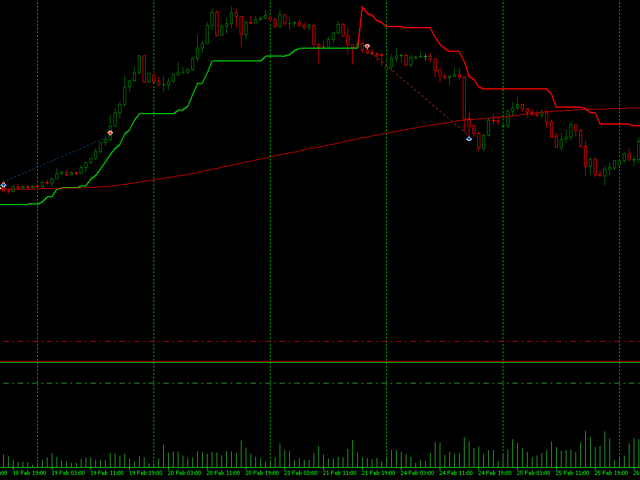
Der Indikator legt eine rote und eine grüne Linie über den Chart. Die grüne Linie steht für einen Aufwärtstrend, die rote Linie stellt einen Abwärtstrend dar.
Der Trend kehrt um, wenn ein bestehendes Unterstützungs- oder Widerstandsniveau gekreuzt wird.
Wenn ein Kurs nach unten durch eine Signallinie bricht, bedeutet dies ein potentielles Verkaufssignal. Bei einer aufwärtsgerichteten Kreuzung durch die Signallinie liegt ein potentielles Kaufsignal vor.
Die "Perioden" und der "Faktor" des Supertrends zur Darstellung der Signallinie können individuell eingestellt werden. Standardmäßig sind diese auf zehn (Perioden) und drei (Faktor) gesetzt. Durch Modifikation können Unterstützungs- und Widerstandsniveaus enger oder weiter gesetzt werden.