Time Line by MMD MT5
- Indikatoren
- Mariusz Maciej Drozdowski
- Version: 1.0
- Aktivierungen: 5
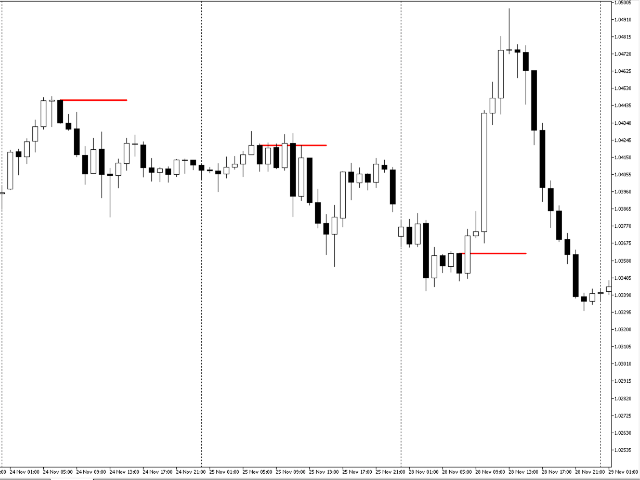
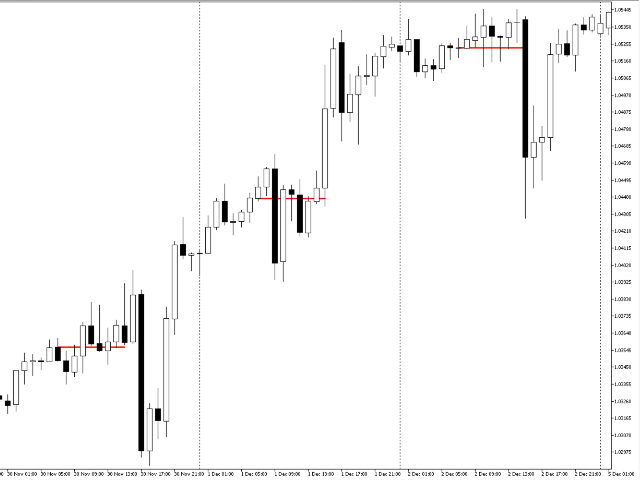
Time Line by MMD is a simple indicator that supports historical data analysis and trading on statistical models that follow the MMD methodology.
Start Time - specifying the time when we start analyzing and playing the MMD statistical model
Time Duration in minutes - duration of the model and its highest effectiveness (after the end of the line, the price returns - statistically - to the set level)
Lookback days - the number of days back, subjected to historical analysis
Base Time Frame - the base time interval from which data is collected to determine the model start
Line Style - line style
Line Color - line color
Line Width - line thickness