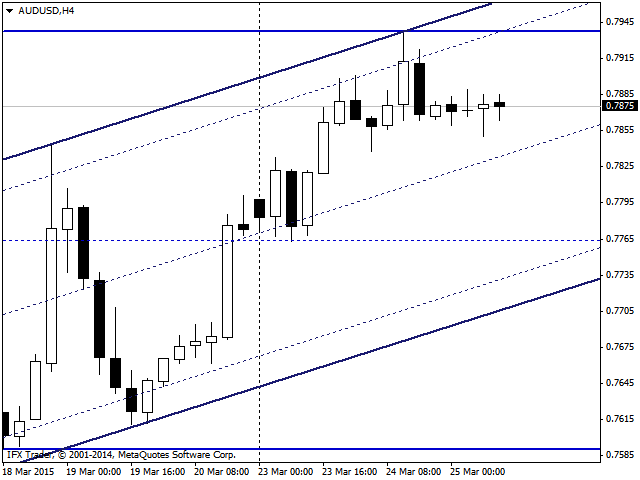
• Übersicht
  • Bewertungen (8)
  • Diskussion (8)
  • Neue Funktionen

Equidistant channel

The purpose of the indicator is drawing an equidistant channel. It is somewhat different from the traditional model. The choice of control parameters is simple and does not require any special description. Enter the calculation interval in hours and the solution to the problem will appear on the screen.

Please note that the time involved in calculation of the channel must be greater than the timeframe it will be displayed on. If the parameters you enter are beyond the allowable limits, you will get notified if the indicator restrictions.

The thickness and color of the lines are adjustable.


Parameters

  • CycleHours — period in hours;
  • SensitivitySignalAlerts — signal level in % of the channel width. The signal level is a dashed line drawn parallel to the main one with the specified proportions;
  • color RES_SUP — the color of the parallel channel;
  • color CHANNEL — the color of the main channel;
  • width1 — thickness of the lines of the parallel channel;
  • width2 — thickness of the lines of the main channel.
Empfohlene Produkte
Tract
Andriy Sydoruk
Tract - Channel indicator, by which you can place orders like a classic channel indicator. Trading can be carried out inside the channel when the price reaches its borders and turns in the opposite direction from them. In such cases, reversal strategies are used. The channel indicator is designed to work with support and resistance levels and help traders find opportunities to enter the market. Another way to trade a breakout - assumes a situation when the price, upon reaching one or another cha
Channel FTF
Pavel Verveyko
5 (2)
The Envelopes indicator determines the presence of a trend or flat. It has 3 types of signals, shows the probable retracement levels and levels of the possible targets. The Fibonacci coefficients are used in the indicator's calculations. Signals (generated when touching the lines or rebounding from lines): Trend - the middle line of the Envelopes has a distinct inclination; the lines below the channel's middle line are used for buy trades, the lines above the middle line and the middle line itse
This indicator filters the Zigzag indicator to calculate the main support and resistance levels. Variables minimum gap between peaks : is the distance (GAP) between the peaks of the Zigzag peaks sensitivity : Minimum number of nearby peaks look back: it means that it has to test the last 50 peaks in the Zigzag object name perfix: a prefix for level’s line name on chart
FREE
Going straight
Maryna Shulzhenko
American traders say: “Trend is your friend”, which means “Trend is your friend”. And indeed it is! By trading with the trend, you reduce your risks and gain an advantage, as you increase the mathematical expectation of completed trades and, therefore, earn more profit. Together with the Going straight indicator you will trade with the trend with ease! This is one of the most effective ways to deal with market trends. Trading strategies using the channel indicator belong to the classic method
The indicator detects and displays 3 Drives harmonic pattern (see the screenshot). The pattern is plotted by the extreme values of the ZigZag indicator (included in the resources, no need to install). After detecting the pattern, the indicator notifies of that by a pop-up window, a mobile notification and an email. The indicator highlights the process of the pattern formation and not just the complete pattern. In the former case, it is displayed in the contour triangles. After the pattern is com
Description The base of this indicator is an ZigZag algorithm based on ATR and Fibo retracement. The ZigZag can be drawn like a classic ZigZag or like Arrows or needn't be drawn at all. This indicator is not redrawing in sense that the ZigZag's last shoulder is formed right after the appropriate conditions occur on the market. The shoulder doesn't change its direction afterwards (can only continue). There are some other possibilities to show advanced information in this indicator: Auto Fibo on
Free automatic Fibonacci is an indicator that automatically plots a Fibonacci retracement based on the number of bars you select on the BarsToScan setting in the indicator. The Fibonacci is automatically updated in real time as new highest and lowest values appears amongst the selected bars. You can select which level values to be displayed in the indicator settings. You can also select the color of the levels thus enabling the trader to be able to attach the indicator several times with differe
FREE
Scalping Binary option Pro is a dial gauge. --------complete lack of redrawing --------- The indicator does not work correctly in the strategy tester.  The red down arrow indicates that sales should be considered, and the green one - up (purchases).  All that needs to be set up is the colors of the signal arrows, as well as the activation or deactivation of the sound signal when a signal appears in one direction or another.  It is best to use high-pair pairs with a small spread in tradin
This is a well-known ZigZag indicator. But it differs by the fact that its plot is based on values of the middle line which is set by a user. It can display Andrews’ Pitchfork and standard or Bobokus Fibo levels. NO REPAINTING. Parameters Period МА — middle line period. Default value is 34. Minimum value is 4. Maximum value is set at your discretion. Used to calculate price - base price to calculate the middle line. The averaging method - method of smoothing the middle line. Turning pitchfork
Dynamic Levels
Svyatoslav Kucher
Dynamic Levels is a channel indicator of dynamic levels, designed for identification of the price extremums. It allows increasing the efficiency of any strategy due to advanced parameters, which in turn allow customizing it for personal trading style. Dynamic Levels does not change its values, it is suitable for any timeframe and currency pair. Indicator Parameters ChannelPeriod - period for the indicator calculation. ChannelSmoot - smoothing of values. ATRPeriod - volatility calculation perio
Auto Fibo mq
DMITRII GRIDASOV
"Auto FIBO" indicator    - is great auxiliary tool in trading! Indicator automatically calculate and place on chart Fibo levels and local trend lines (red color) Fibonacci levels indicate key areas where price can reverse Most important levels are 23.6%, 38.2%, 50% and 61.8% You can use it   for reversal scalping  or for zone grid trading There are plenty of opportunities to  improve your current system using Auto FIBO indicator as well // More great Expert Advisors and Indicators are availab
Provide ideas for trend trading. Automatic calculation and generation of trend channels. The channel line, also known as the pipeline line, is to draw a straight line parallel to the trend line in the opposite direction of the trend line, and the straight line crosses the highest or lowest price of the recent period. These two lines run the price in the middle and have obvious pipe or channel shapes. Necessary for traders: tools and indicators Waves automatically calculate indicators, chann
Forex Indicator   Accumulation Bar   Pattern for MT4 Indicator  " Accumulation Bar "  is very powerful breakout-focused indicator for Price Action trading Indicator detects  price accumulation in narrow area during 1 bar and shows: Breakout direction, Pending order and SL locations Bullish  Accumulation Bar - Blue arrow signal on chart (see pictures) Bearish  Accumulation Bar - Red arrow signal on chart (see pictures) No repaint; No delays; High R/R ratio (reward/risk); I ndicator   has adjustab
Nuremberg
Tatiana Savkevych
The Nuremberg tool presents a channel-like algorithm. The best arrow algorithms use channels without redrawing. Its settings indicate the parameters of the length and width of the channel. The indicator was created in such a way that you can fix the reaction to the channel breakout and display it in the form of an arrow. Arrow indicator Nuremberg on Forex indicates points of entry into transactions without redrawing. It generates fairly frequent and accurate signals. When an upward arrow appe
This indicators automatically draws the   support and resistances   levels (key levels) for you once you've dropped it on a chart. It reduces the hustle of drawing and redrawing these levels every time you analyse prices on a chart. With it, all you have to do is drop it on a chart, adjust the settings to your liking and let the indicator do the rest. But wait, it gets better; the indicator is absolutely free! For more information:  https://youtu.be/rTxbPOBu3nY For more free stuff visit:  https
FREE
Two Lines Color II
Cristobal Hidalgo Soriano
Nombre del Indicador: Two Lines Color II Descripción: El indicador "Two Lines Color II", desarrollado por 13 Crow Trading Club, es una versión más rápida de su predecesor, el "Two Lines Color 1". Este indicador ha sido diseñado para brindar señales aún más tempranas sobre posibles cambios de tendencia en el mercado financiero. Características Principales: Mayor Velocidad de Señales: Two Lines Color II ofrece señales más rápidas en comparación con su versión anterior. La rápida velocidad de las s
FREE
Trend Ray
Andriy Sydoruk
The indicator shows the potential trend direction by cyclical-wave dependence. Thus, all the rays of the intersection will be optimal rays, in the direction of which the price is expected to move, taking into account the indicator period. Rays can be used as a direction for potential market movement. But we must not forget that the approach must be comprehensive, the indicator signals require additional information to enter the market.
The indicator is designed for determining Fibonacci levels. Does not repaint/redraw The blue level shows the zero Fibonacci value (it is also the Pivot level) Red levels show calculated Fibonacci levels (used as a rollback or reversal point) Automatic period detection (periods can be entered manually) Adjustable display calculation method. Settings BarsHistory - the number of bars to be used to display the indicator. Method - method of calculation. AutoPeriod - automated period calculation (true
Description: The indicator measures, through the zigzag indicator, the levels of trend or correction. It shows in the chart the levels of each low or high detected. KEY LINKS:   How to Install  –  Frequent Questions  -  All Products  How is this indicator useful? This indicator determines, depending on Zigzag parameter if a trend is beginning, developing, or ending This indicator determines the direction of the trend Components Levels as positive or negative numbers, depending on the direction
FREE
Fibonacci SR Indicator This indicator creates support and resistance lines. This indicator is based on Fibonacci Retracement and Extension levels. It will consider many combinations of the Fibonacci levels and draw support/resistance lines based on these. This indicator uses tops and bottoms drawn by the ZigZag indicator in its calculations. The ZigZag can also be drawn on the chart, if necessary. The indicator considers many combinations of past reversal points and Fibonacci ratio levels, and
FREE
The indicator detects and displays the 5-0 harmonic pattern on the chart according to the scheme provided in the screenshot. The pattern is plotted by the extreme values of the ZigZag indicator (included in the resources, does not require additional installation). After detecting the pattern, the indicator notifies of that by the pop-up window, a mobile notification and an email. The indicator highlights not only the complete figure, but also the time of its formation. During the formation the f
The arrow indicator without redrawing shows potential entry points into the market in the form of arrows of the appropriate color: the up arrows (usually green) suggest opening a purchase, the red down arrows suggest selling. The appearance of arrows may be accompanied by beeps. It is usually assumed to enter at the next bar after the pointer, but there may be non-standard recommendations. Arrow indicators visually "unload" the price chart and save time for analysis: no signal – no deal, if ther
Deep River AM
Andriy Matviyevs'kyy
The presented indicator is the author's implementation of the idea embodied in the Alligator indicator, which has already become a classic. The proposed product allows you to visually demonstrate the direction of price movement, temporary price rollbacks and zones of multidirectional price movement. Namely: The indicator lines go up and diverge from each other - a strong bullish trend; The indicator lines go down and diverge from each other - a strong bearish trend; The indicator lines go up but
FREE
SuperRSI
Andriy Sydoruk
The SuperRSI indicator is an advanced index of internal strength. The indicator shows not the relative strength of the trading instruments being compared, but the internal strength of a single instrument, therefore, it is the “Internal Strength Index”. This is an advanced form of the SuperRSI indicator. It converts the signal so that low-frequency components are delayed much more than high-frequency components. In general, the data of the last bar have more weight than previous data, like an exp
Simple Long Short Bar A very concise and clear indicator, very easy to understand, but it is very useful for tracking trends. The usage of this indicator is very simple: Long signal: If the price shows signs of a long market, then a yellow box will appear. Short signal: If the price shows signs of a short market, then a blue box will appear. Bull strength: If the size of the box is large, it means the bull strength is strong, and vice versa. Short strength: If the size of the box is small, it m
The intelligent algorithm of the Legend Trend indicator accurately shows the points of potential market reversal. The indicator tracks the market trend, ignoring sharp market fluctuations and noise around the average price. Implements a kind of technical analysis based on the idea that the market is cyclical in nature. This is a pointer indicator. It catches the trend and shows favorable moments of entering the market with arrows. A strategy for trading with the trend, filtering market noise
Trend Lines contiuous Signal (FREE one WEEK)  This indicator draws current trend line and  provides Buy/Sell Signal based on calculations on Higher frame (Trend) and Lower frame(Entry signals) * You should select the higher and lower frame for indicator calculations * You select the Trend line colors as you prefer * Enable or disable Alerts! Trend lines UP/Down are drawn when a trend is detected Wait for small arrows for entry : *Normally an UP arrow in an UP Trend is a BUY signal : ---you Clo
This indicator is based on the classic Pivot Points concept combined with additional optimizations and advanced features.  The levels of support and resistance are calculated by taking into account the average historical volatility.  The added multi-symbol scanner allows you to detect the best conditions and trade setups.  You can see in real time the current situation for all of your favorite symbols and you can switch the chart to any symbol with one click. The build in alert system allows you
An Indicator that calculates the Pivot Point line,  along with the 2 levels of support and resistance lines, known as S1, S2, R1, R2 respectively. The formulas for calculation are as follows: Pivot point (PP) = (High + Low + Close) / 3 First level support and resistance: First resistance (R1) = (2 x PP) – Low First support (S1) = (2 x PP) – High Second level of support and resistance: Second resistance (R2) = PP + (High – Low) Second support (S2) = PP – (High – Low) The trader can adj
Fibonacci sequence is defined by integer sequence: 0, 1, 1, 2, 3, 5, 8, 13, 21, 34, 55, 89, 144, ... By definition, it starts from 0 and 1, the next number is calculated as a sum of two previous numbers. Instead of the standard moving average, the indicator uses the following calculation of average price: Bar0 + Bar1 + Bar2 + Bar3 + Bar5 + Bar8 + Bar13 + Bar21 + ... Input parameters FiboNumPeriod_1 - numbers in the following integer sequence for Fibo Moving Average 1. nAppliedPrice_1 - Close p
Käufer dieses Produkts erwarben auch
Gann Made Easy
Oleg Rodin
4.96 (46)
Gann Made Easy ist ein professionelles und einfach zu bedienendes Forex-Handelssystem, das auf den besten Handelsprinzipien unter Verwendung der Theorie von Mr. basiert. W.D. Gann. Der Indikator liefert genaue KAUF- und VERKAUFSsignale, einschließlich Stop-Loss- und Take-Profit-Levels. Mit PUSH-Benachrichtigungen können Sie auch unterwegs handeln. Bitte kontaktieren Sie mich nach dem Kauf! Ich werde meine Handelstipps und tolle Bonusindikatoren kostenlos mit Ihnen teilen! Wahrscheinlich haben Si
Atomic Analyst
Issam Kassas
5 (1)
Zunächst einmal ist es erwähnenswert, dass dieser Handelsindikator nicht neu malt, nicht neu zeichnet und keine Verzögerung aufweist, was ihn sowohl für manuellen als auch für Roboterhandel ideal macht. Der Atom-Analyst ist ein PA-Preisaktionsindikator, der die Stärke und das Momentum des Preises nutzt, um einen besseren Vorteil auf dem Markt zu finden. Ausgestattet mit fortschrittlichen Filtern, die helfen, Rauschen und falsche Signale zu entfernen, und das Handelspotenzial zu erhöhen. Durch
Gold Stuff
Vasiliy Strukov
4.89 (250)
Gold Stuff-Ein Trendindikator, der speziell für Gold entwickelt wurde, kann auch auf allen Finanzinstrumenten verwendet werden. Der Indikator wird nicht neu gezeichnet und verzögert sich nicht. Empfohlener Zeitrahmen H1. Nach diesem Indikator geschrieben EA Gold Stuff Berater, können Sie es in meinem Profil finden. WICHTIG! Kontaktieren Sie mich sofort nach dem Kauf, um Anweisungen und Bonus zu erhalten! DATEN Draw Arrow - inkl.aus. zeichnen von Pfeilen in einem Diagramm. Alerts-inkl.aus.
DERZEIT 26% RABATT Die beste Lösung für jeden Newbie oder Expert Trader! Dieser Indikator ist ein einzigartiges, qualitativ hochwertiges und erschwingliches Trading-Tool, da wir eine Reihe von proprietären Funktionen und eine neue Formel integriert haben. Mit nur EINEM Chart können Sie die Währungsstärke für 28 Forex-Paare ablesen! Stellen Sie sich vor, wie sich Ihr Handel verbessern wird, weil Sie in der Lage sind, den genauen Auslösungspunkt eines neuen Trends oder einer Scalping-Gelegenh
Zunächst einmal ist es wichtig zu betonen, dass dieses Handelstool ein Nicht-Repaint-, Nicht-Redraw- und Nicht-Verzögerungsindikator ist, was es ideal für professionelles Trading macht. Der Smart Price Action Concepts Indikator ist ein sehr leistungsstarkes Werkzeug sowohl für neue als auch erfahrene Händler. Er vereint mehr als 20 nützliche Indikatoren in einem und kombiniert fortgeschrittene Handelsideen wie die Analyse des Inner Circle Traders und Strategien des Smart Money Concepts. Diese
Scalper Vault
Oleg Rodin
5 (27)
Scalper Vault ist ein professionelles Scalping-System, das Ihnen alles bietet, was Sie für erfolgreiches Scalping benötigen. Dieser Indikator ist ein komplettes Handelssystem, das von Forex- und Binäroptionshändlern verwendet werden kann. Der empfohlene Zeitrahmen ist M5. Das System liefert Ihnen genaue Pfeilsignale in Richtung des Trends. Es liefert Ihnen auch Top- und Bottom-Signale und Gann-Marktniveaus. Die Indikatoren bieten alle Arten von Warnungen, einschließlich PUSH-Benachrichtigungen.
TPSproTREND PrO
Roman Podpora
5 (15)
TPSpro TRENDPRO  - is a trend indicator that automatically analyzes the market and provides information about the trend and each of its changes, as well as giving signals for entering trades without redrawing! The indicator uses each candle, analyzing them separately. referring to different impulses - up or down impulse. Exact entry points into transactions for currencies, crypto, metals, stocks, indices!  -  Version MT5               DETAILED DESCRIPTION        /       TRADING SETUPS           
Derzeit 20% Rabatt! Die beste Lösung für jeden Neueinsteiger oder Expert Händler! Dieses Dashboard arbeitet mit 28 Währungspaaren. Es basiert auf 2 unserer Hauptindikatoren (Advanced Currency Strength 28 und Advanced Currency Impulse). Es bietet einen hervorragenden Überblick über den gesamten Forex-Markt. Es zeigt die Werte der Advanced Currency Strength, die Veränderungsrate der Währungen und die Signale für 28 Devisenpaare in allen (9) Zeitrahmen. Stellen Sie sich vor, wie sich Ihr Hande
Scalper Inside PRO
Alexey Minkov
4.75 (55)
SALE NOW! Limited Time Offer! An exclusive indicator that utilizes an innovative algorithm to swiftly and accurately determine the market trend. The indicator automatically calculates opening, closing, and profit levels, providing detailed trading statistics. With these features, you can choose the most appropriate trading instrument for the current market conditions. Additionally, you can easily integrate your own arrow indicators into Scalper Inside Pro to quickly evaluate their statistics and
TPSpro RFI Levels
Roman Podpora
5 (13)
A key element in trading is zones or levels from which decisions to buy or sell a trading instrument are made. Despite attempts by major players to conceal their presence in the market, they inevitably leave traces. Our task was to learn how to identify these traces and interpret them correctly. Reversal First Impulse levels (RFI)   -  Version MT5                INSTRUCTIONS                 RUS                 ENG                                       R ecommended to use with an indicator   -  
Wir stellen vor       Quantum Trend Sniper Indicator   , der bahnbrechende MQL5-Indikator, der die Art und Weise, wie Sie Trendumkehrungen erkennen und handeln, verändert! Entwickelt von einem Team erfahrener Händler mit über 13 Jahren Handelserfahrung,       Quantum Trend Sniper-Indikator       wurde entwickelt, um Ihre Trading-Reise mit seiner innovativen Methode zur Identifizierung von Trendumkehrungen mit extrem hoher Genauigkeit auf ein neues Niveau zu heben. ***Kaufe Quantum Trend Snipe
Quantum Breakout Indicator PRO
Bogdan Ion Puscasu
4.96 (26)
Wir stellen vor       Quantum Breakout PRO   , der bahnbrechende MQL5-Indikator, der die Art und Weise, wie Sie mit Breakout-Zonen handeln, verändert!   Quantum Breakout PRO   wurde von einem Team erfahrener Händler mit über 13 Jahren Handelserfahrung entwickelt und soll Ihre Handelsreise mit seiner innovativen und dynamischen Breakout-Zonen-Strategie auf ein neues Niveau bringen. Der Quantum Breakout Indicator zeigt Ihnen Signalpfeile auf Breakout-Zonen mit 5 Gewinnzielzonen und Stop-Loss
Advanced Supply Demand
Bernhard Schweigert
4.92 (310)
Derzeit 33% Rabatt! Die beste Lösung für jeden Anfänger oder erfahrenen Händler! Dieser Indikator ist ein einzigartiges, qualitativ hochwertiges und erschwingliches Trading-Tool, da wir eine Reihe von proprietären Funktionen und eine neue Formel integriert haben. Mit diesem Update werden Sie in der Lage sein, doppelte Zeitrahmenzonen anzuzeigen. Sie können nicht nur einen höheren TF (Zeitrahmen) anzeigen, sondern sowohl den Chart-TF als auch den höheren TF: SHOWING NESTED ZONES. Alle Supply Dema
Entdecken Sie das Geheimnis des erfolgreichen Forex -Handels mit unserem benutzerdefinierten MT4 -Indikator! Haben Sie sich jemals gefragt, wie Sie Erfolg auf dem Forex -Markt erzielen können und gleichzeitig Gewinne erzielen und gleichzeitig das Risiko minimieren können? Hier ist die Antwort, nach der Sie gesucht haben! Erlauben Sie uns, unseren proprietären MT4 -Indikator vorzustellen, der Ihren Handelsansatz revolutionieren wird. Einzigartige Vielseitigkeit Unser Indikator ist speziell
Präsentation des Miraculous Forex Indikators: Entfesseln Sie die Kraft präzisen Tradings Sind Sie es leid, nach dem besten Forex-Indikator zu suchen, der wirklich herausragende Ergebnisse in allen Zeitebenen liefert? Suchen Sie nicht weiter! Der Miraculous Forex Indikator ist da, um Ihre Trading-Erfahrung zu revolutionieren und Ihre Gewinne auf neue Höhen zu bringen. Basierend auf modernster Technologie und jahrelanger sorgfältiger Entwicklung steht der Miraculous Forex Indikator als Höhepunkt v
Break and Retest
Mohamed Hassan
5 (2)
Break & Retest is unstoppable when combined with our other divergence indicator. After purchase, send us a message and you could get this  2nd indicator  for  FREE  as a  BONUS! ‍You can visually backtest Break & Retest to see how it behaved in the past!    Manual guide:   Click here $59  for the first 25 copies ( 4  left)! Next price is $120 .  After many months of hard work and dedication, we are extremely proud to present you our  Break and Retest price action indicator crea
Entry Points Pro
Yury Orlov
4.7 (225)
Dies ist ein Indikator für MT4, der genaue Signale für den Einstieg in einen Handel ohne Repainting (Neuzeichnen) liefert. Er kann auf alle Finanzwerte angewendet werden: Forex, Kryptowährungen, Metalle, Aktien, Indizes. Er liefert ziemlich genaue Schätzungen und sagt Ihnen, wann es am besten ist, eine Position zu eröffnen und zu schließen. Sehen Sie sich das Video (6:22) mit einem Beispiel für die Verarbeitung nur eines Signals an, das sich für den Indikator gelohnt hat! Die meisten Händler ver
Currency Strength Wizard ist ein sehr leistungsstarker Indikator, der Ihnen eine Komplettlösung für erfolgreichen Handel bietet. Der Indikator berechnet die Stärke dieses oder jenes Forex-Paares anhand der Daten aller Währungen in mehreren Zeitrahmen. Diese Daten werden in Form von benutzerfreundlichen Währungsindizes und Währungsstärkelinien dargestellt, anhand derer Sie die Stärke dieser oder jener Währung erkennen können. Sie müssen lediglich den Indikator an das Diagramm anhängen, mit dem Si
TrendMaestro
Stefano Frisetti
5 (2)
note: this indicator is for METATRADER4, if you want the version for METATRADER5 this is the link: TRENDMAESTRO recognizes a new TREND in the bud, he never makes mistakes. The certainty of identifying a new TREND is priceless. DESCRIPTION TRENDMAESTRO identifies a new TREND in the bud, this indicator examines the volatility, volumes and momentum to identify the moment in which there is an explosion of one or more of these data and therefore the moment in which prices have strong probability of f
TrendDecoder Premium
Christophe, Pa Trouillas
5 (3)
Identifizieren Sie Bereiche und die nächsten wahrscheinlichen Bewegungen   |  Erhalten Sie früheste Signale und die Stärke von Trends   |  Klare Ausstiegssignale vor Umkehrung   |  Erkennen Sie die Fibo-Levels, die der Kurs testen wird Indikator, der nicht zurückverfolgt, nicht verzögert - ideal für den manuellen und automatisierten Trading - geeignet für alle Vermögenswerte und Zeiteinheiten Zeitlich begrenztes Angebot   >> 50% OFF Nach dem Kauf,   bitte kontaktieren Sie mich auf diesem Kanal  
MEHRWÄHRUNGS- und MULTITIMEFRAME-KAUF- UND VERKAUFSALARM. AUTO TRAILING STOP UND RISIKO REWARD TAKEPROFIT! Der Indikator scannt und analysiert den Markt, sodass Sie nichts zu tun haben! HANDELN SIE ALLE IHRE WÄHRUNGEN AUF EINEM CHART!   Bitte hinterlassen Sie nach dem Kauf einen Kommentar, kontaktieren Sie mich und ich sende Ihnen den Handelsassistenten EA. Der Indikator verwendet mehrere Oszillatoren und angeschlossene Filter, um die besten BESTÄTIGTEN Einstiegspunkte zu finden, sodass S
FX Power MT4 NG
Daniel Stein
5 (8)
Erhalten Sie Ihr tägliches Marktupdate mit Details und Screenshots über unser Morning Briefing hier auf mql5 und auf Telegram ! FX Power MT4 NG ist die nächste Generation unseres langjährig sehr beliebten Währungsstärkemessers FX Power. Und was bietet dieser Stärkezähler der nächsten Generation? Alles, was Sie am ursprünglichen FX Power geliebt haben PLUS GOLD/XAU-Stärkeanalyse Noch präzisere Berechnungsergebnisse Individuell konfigurierbare Analysezeiträume Anpassbares Berechnungslimit für noc
Price Action Entry Alerts
Stephen Sanjeeve Sahayam
5 (3)
Dieser Indikator überprüft jeden Balken auf Kauf- oder Verkaufsdruck und identifiziert 4 Arten von Kerzenmustern mit dem höchsten Volumen. Diese Kerzen werden dann mithilfe mehrerer linearer Filter gefiltert, um Kauf- oder Verkaufssignale anzuzeigen. Signale funktionieren am besten in Verbindung mit einer höheren Zeitrahmenrichtung und wenn sie während der Stunden mit hohem Handelsvolumen gehandelt werden. Alle Filter sind anpassbar und funktionieren unabhängig voneinander. Kann Signale einer e
DERZEIT 31% RABATT! Die beste Lösung für jeden Newbie oder Expert Trader! Dieser Indikator ist ein einzigartiges, qualitativ hochwertiges und erschwingliches Handelsinstrument, da wir eine Reihe von proprietären Funktionen und eine geheime Formel eingebaut haben. Mit nur EINEM Chart liefert er Alerts für alle 28 Währungspaare. Stellen Sie sich vor, wie sich Ihr Handel verbessern wird, weil Sie in der Lage sind, den genauen Auslösepunkt eines neuen Trends oder einer Scalping-Gelegenheit zu e
FX Volume
Daniel Stein
4.6 (35)
Erhalten Sie Ihr tägliches Marktupdate mit Details und Screenshots über unser Morning Briefing hier auf mql5 und auf Telegram ! FX Volume ist der ERSTE und EINZIGE Volumenindikator, der einen ECHTEN Einblick in die Marktstimmung aus Sicht eines Brokers bietet. Es bietet fantastische Einblicke in die Positionierung von institutionellen Marktteilnehmern, wie z.B. Brokern, auf dem Forex-Markt, viel schneller als COT-Berichte. Diese Informationen direkt auf Ihrem Chart zu sehen, ist der wahre Game
Up down v6T
Guner Koca
5 (1)
Thise indicator is up down v6  comes with tradingwiev version. purchased people, after installed on terminal ,contact me on mql5  to get BONUS  TradingView version. up-down indicator is no repaint and works all pairs and lower than weekly time frames charts. it is suitable also 1 m charts for all pairs. and hold long way to signal. dont gives too many signals. when red histogram cross trigger line that is up signal.and price probably will down when blue histogram cross trigger line that is dow
How to use Pair Trading Station Pair Trading Station is recommended for H1 time frame and you can use it for any currency pairs. To generate buy and sell signal, follow few steps below to apply Pair Trading Station to your MetaTrader terminal. When you load Pair Trading Station on your chart, Pair Trading station will assess available historical data in your MetaTrader platforms for each currency pair. On your chart, the amount of historical data available will be displayed for each currency pai
PRO Renko System ist ein hochpräzises Handelssystem, das speziell für den Handel mit RENKO-Charts entwickelt wurde. Dies ist ein universelles System, das auf verschiedene Handelsinstrumente angewendet werden kann. Das System neutralisiert effektiv so genannte Marktgeräusche, die Ihnen Zugang zu genauen Umkehrsignalen geben. Der Indikator ist sehr einfach zu bedienen und hat nur einen Parameter, der für die Signalerzeugung verantwortlich ist. Sie können das Tool einfach an jedes Handelsinstr
Zunächst einmal ist es wichtig zu betonen, dass dieses Handelssystem ein Nicht-Repainting-, Nicht-Redrawing- und Nicht-Verzögerungsindikator ist, was es ideal für den professionellen Handel macht. Das "Smart Support and Resistance Trading System" ist ein fortschrittlicher Indikator, der für neue und erfahrene Trader entwickelt wurde. Es ermöglicht Tradern Präzision und Vertrauen auf dem Devisenmarkt. Dieses umfassende System kombiniert mehr als 7 Strategien, 10 Indikatoren und verschiedene Ha
Cycle Sniper
Elmira Memish
4.4 (35)
NEW YEAR SALE PRICE FOR LIMITED TIME!!! Please contact us after your purchase and we will send you the complimentary indicators to complete the system Cycle Sniper is not a holy grail but when you use it in a system which is explained in the videos, you will feel the difference. If you are not willing to focus on the charts designed with Cycle Sniper and other free tools we provide, we recommend not buying this indicator. We recommend watching the videos about the indiactor and system before pu
Weitere Produkte dieses Autors
This is a well-known ZigZag indicator. But it differs by the fact that its plot is based on values of the middle line which is set by a user. It can display Andrews’ Pitchfork and standard or Bobokus Fibo levels. NO REPAINTING. Parameters Period МА — middle line period. Default value is 34. Minimum value is 4. Maximum value is set at your discretion. Used to calculate price - base price to calculate the middle line. The averaging method - method of smoothing the middle line. Turning pitchfork
The indicator is similar to https://www.mql5.com/en/market/product/12330 . However, it considers the MQL5 platform features. Peaks and bottoms are calculated based solely on external bars. After a swing is formed, the indicator does not redraw providing opportunities for traders working on horizontal level breakthroughs. Traffic can be reduced by changing the amount of calculated bars in the MinBars variable (default value is 500). All you need is to select the output options, so that you can se
This is an interactive and easy-to-set indicator which allows to form seven equally spaced channels which have your settings simultaneously. All seven channels are enabled by default. But you can easily enable one or another channel using control buttons located in the upper case of the indicator's control panel. You can change a period of the indicator calculation by clicking one of buttons indicating number of the channel in the lower case of the control panel. Two other buttons (one of them i
This EA represents an interactive panel with adjustable parameters destined for installation and deletion of pending orders (orders grid generator). You can place the panel anywhere on the screen or hide it into a dot clicking on the button in the upper left part of the chart (it will be shown after clicking on it for the second time). Number and step of orders, lot size, vertical shift for limit orders - all these things make your work easier. There are functions for restoring according to pend
This indicator is designed for drawing equidistant channels. Two options are available: based on the number of hours in the indicator calculation and by the number of bars. To draw a channel, enter a number 1 or greater. The maximum value is limited by the amount of visible bars. If the parameters you enter are beyond the allowable limits, you will get notified if the indicator restrictions. Please note that the time involved in calculation of the channel must be greater than the timeframe it wi
The indicator displays the moving average of all periods on one chart. It shows the MA of a one step lower timeframe and all the MAs equal to and higher than it. Parameters Period moving average - Moving Average period (default is 34); Used to calculate price - price used for the MA calculation (default is the average price = (high+low)/2); The averaging method - default is linear-weighted; Moving average shift - MA shift (default is 0). Just enter the MA calculation period and its parameters,
This indicator is designed for analyzing your positions on 30 financial instruments with the font size of the output information between 8 and 10. If the font size is 11 you will see only 26 instruments and so on: 12-25, 13-24, 14-20. The font size can range from 8 to 14. The main window contains buttons with names of financial instruments and lines where brief information about all open positions is displayed. Two columns show the total volumes in lots of positions in each trading direction: BU
This is a prototype of the famous Control and management of transactions panel. There are two main differences: Allows to work with all the variety of financial instruments opened by a user and not only with instruments it was attached to; To activate levels of order closure hidden from a broker, it uses not lines but modifiable virtual levels. To enjoy the full functionality of the panel you are advised to have: Desk analytical table . Their combined operation allows to keep the situation under
This is a prototype of the famous Control and management of transactions panel. There are two main differences: Allows to work with all the variety of financial instruments opened by a user and not only with instruments it was attached to; To activate levels of order closure hidden from a broker, it uses not lines but modifiable virtual levels. The EA will independently determine a total number of involved financial instruments, display them in the upper left window and locate the pointer on the
It is widely known that colors affect the emotional state of a human, especially if this human is a trader. Psychologists recommend that you follow your instincts and select the color of your environment that is most comfortable to you. In order to reduce emotional stress, impact of colors on a person should be considered. The optimal range of the most beneficial colors includes green, yellow-green and green-blue ones. This indicator allows you to manage your emotional state and health. Choose a
The indicator is based on the two-buffer scheme and does not require any additional settings. It can be used on any financial instrument without any restrictions. The indicator is a known ZigZag, but it does not redraw . The indicator allows to easily detect significant levels on the price chart, as well as demonstrates the ability to determine the probable direction of a price movement. The calculations are based on the candles' Close prices, thus improving the reliability of the levels. Para
The idea of the indicator stems from the necessity to clearly define the borders of support and resistance levels, which helps to plan the opening and closing of positions in the areas that most appropriately determine the process. Look at the breakdowns of the resistance level that confirm the intention of the price to continue the upward movement, after it passed the support level and entered the channel formed by the two levels. The same is for the case when the price enters the channel downw
This indicator is a logical extension of the product at https://www.mql5.com/en/market/product/12526 . The only difference is that price movement is displayed using a histogram with levels, allowing to assess the direction and strength of the movement. How to interpret the signal: 0 - the middle of the channel; above 0.5 - the breakdown of the channel up; below -0.5 - the breakdown of the channel down. Both indicators are displayed in the attached screenshots. Install the indicator and you will
Simple Line
Valeriy Medvedev
The indicator shows the levels of the past week and day. In addition, it draws a level in percentage. This level is specified relative to the difference between the High and Low of the past month and week. For the daily levels of the past day, the Close levels are additionally displayed. All you need to do is configure the display parameters of the levels to your liking. Parameters Over the past months installations - settings for the last months; PasteMonthsLines - the level display mode is
This indicator is the logical continuation of the well-known equidistant channel indicator: https://www.mql5.com/en/market/product/8723 . The main purpose of the indicator is the visualization of price levels relative to the parallel channel using Fibo Bobokus levels in a separate window and the price history. This often allows forecasting the future price movement with a sufficiently high degree of probability. The Fibo levels calculation equation is as follows: FiboLevel = (50-(100*((Close[i]-
This simple to use utility allows opening charts from the list of financial instruments by left clicking their names. The chart window is opened using the Default template. The template name can be changed to one of those stored in Charts-Templates section of the terminal. It is possible to customize the background colors of panels and their labels, and also to select the display type for a more comfortable working environment. This is all you need to know in order to see the result quickly. P
Quick response
Valeriy Medvedev
If you need to quickly evaluate the results of trading on a current financial instrument by hypothetical price movement in the chosen direction and up to a certain level, set the indicator on any chart that contains open positions and move the line to the desired level after it appears together with the results tab. This is all you need to understand what happens to your deposit if the price is at this level without taking into account existing stop loss and take profit. Enable considering pendi
This is an individual tool for analyzing the market situation. It is very simple to use. After attaching the indicator to the chart, you will see three vertical lines named "VLine 1", "VLine 2" and "VLine 3", following in this order from left to right. For the utility to operate correctly, this sequence should always be observed. Please note: at the first start, the lines are not bound to specific price levels on the chart. This should be done by user in accordance with the following rule: if li
This indicator displays a set of moving average lines across all higher timeframes. The indicator can be installed on any financial instrument and any timeframe. For the analysis of the lines, a panel with timeframe values is provided in the lower right corner. Using the panel, you can easily enable/disable the display of the MA line of any higher timeframe. This allows a more thorough analysis of the market situation. The color of the button matches the color of the moving average line. Param
This indicator is designed for monitoring RSI levels on the current and higher timeframes. The control panel is user friendly and consists of buttons, with which you can control the display of lines as per the names of the buttons. The button color matches the line color. Parameters "___| Settings of the main indicator " RSI Period - averaging period for index calculation (default is 14); RSI Price type - price used for calculations (default is the Close price); "___| Color palette " Text colo
Этот индикатор предназначен для контроля уровней CCI на текущем и старших от него таймфреймах. Панель управления проста в понимании и состоит из кнопок, с помощью которых можно управлять отображением линий, соответствующим указанным на наименовании кнопок. Цвет кнопки совпадает с цветом линии. Этот индикатор из серии подобных индикаторов, которые уже успели завоевать популярность: https://www.mql5.com/ru/market/product/30276 и https://www.mql5.com/ru/market/product/30403 Параметры "___| Set
This is a well-known ZigZag indicator. But it differs by the fact that its plot is based on values of the middle line which is set by a user. It can display Andrews’ Pitchfork and standard or Bobokus Fibo levels. NO REPAINTING. Parameters Period МА — middle line period. Default value is 34. Minimum value is 4. Maximum value is set at your discretion. Used to calculate price — type of price used for the midline calculations. The averaging method — type of smoothing for the middle line. Turning
The indicator is based on the two-buffer scheme and does not require any additional settings. It can be used on any financial instrument without any restrictions. The indicator is a known ZigZag, but it does not redraw . The indicator allows to easily detect significant levels on the price chart, as well as demonstrates the ability to determine the probable direction of a price movement. The calculations are based on the candles' Close prices, thus improving the reliability of the levels. Para
It is an analogue of the indicator of levels at https://www.mql5.com/en/market/product/24273 for the MetaTrader 5 platform. The indicator shows the levels of the past month, week and day. In addition, it draws a level in percentage relative to the difference between the High and Low of the past month and week. For the daily levels of the past day, the Close levels are additionally displayed. All you need to do is to configure the display parameters of the levels to your liking. In some cases, af
Auswahl:
sunnychow
8753
sunnychow 2018.11.13 13:46 
 

Der Benutzer hat keinen Kommentar hinterlassen

Matthew Todorovski
13122
Matthew Todorovski 2018.06.30 14:20 
 

Der Benutzer hat keinen Kommentar hinterlassen

Ali irwan
5137
Ali irwan 2017.08.06 01:00 
 

Der Benutzer hat keinen Kommentar hinterlassen

[Gelöscht] 2017.07.18 18:55 
 

Der Benutzer hat keinen Kommentar hinterlassen

Gennadiy Voltornist
11909
Gennadiy Voltornist 2017.05.19 11:23 
 

Der Benutzer hat keinen Kommentar hinterlassen

Aleksander Sergeev
154
Aleksander Sergeev 2017.04.28 18:32 
 

Der Benutzer hat keinen Kommentar hinterlassen

Eduardo Bogosian
238
Eduardo Bogosian 2016.12.13 14:57 
 

Der Benutzer hat keinen Kommentar hinterlassen

Maksym Mudrakov
29226
Maksym Mudrakov 2016.08.30 19:24 
 

Der Benutzer hat keinen Kommentar hinterlassen

Antwort auf eine Rezension
Version 1.4 2017.07.14
Fixed inaccuracy in determining the channel boundaries with fractional time values.
Version 1.3 2017.03.21
Rebuilt for new version of terminal.
Version 1.2 2016.01.05
Added the indicator icon and designation.
Version 1.1 2015.06.22
Saturday and Sunday are considered when displaying smaller periods.