• Übersicht
  • Bewertungen (2)
  • Diskussion

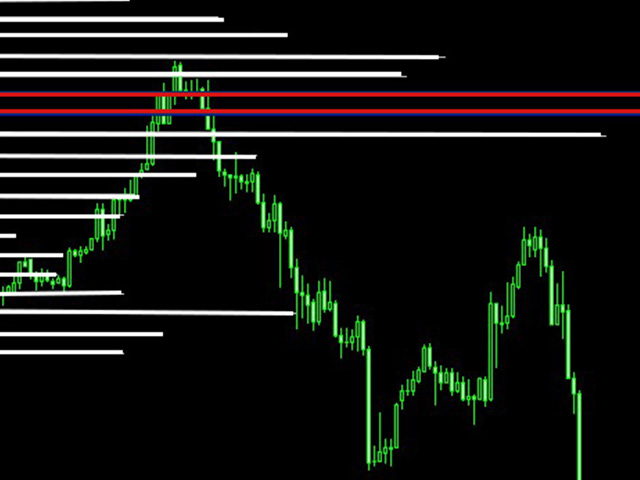
Zona de Consolidacao

5

It makes it easier to see where there have been consolidation zones for previous prices and allows you to highlight the histogram where there is the biggest consolidation zone.


Input parameters

  • Intervalo de preço
    • Is the price between the histograms

  • Periodo
    • Number of candle sticks to be analyzed


  • Porcentagem
    • Highlights the histogram where there is minimal consolidation in relation to the analyzed period


Bewertungen 2
autovolk
847
autovolk 2022.09.01 10:48 
 

Super

Empfohlene Produkte
ADX consolidado
OTAVIO AGUIAR CAMPOS Aguiar
4.75 (4)
Mostra a média móvel quando ADX > 20 e pinta de verde ou vermelho quando os valores de ADX estão subindo indicando tendência. Quando o ADX é menor que 20 indica movimento lateral consolidado. O indicador não define pontos de entrada, somente mostra a média colorida quando a tendência está se fortalecendo. Faz parte do grupo de indicadores do Indicador Tavim.
FREE
Value Chart Candlesticks
Flavio Javier Jarabeck
4.67 (9)
The idea of a Value Chart indicator was presented in the very good book I read back in 2020 , " Dynamic Trading Indicators: Winning with Value Charts and Price Action Profile ", from the authors Mark Helweg and David Stendahl. The idea is simple and the result is pure genius: Present candlestick Price analysis in a detrended way! HOW TO READ THIS INDICATOR Look for Overbought and Oversold levels. Of course, you will need to test the settings a lot to find the "correct" one for your approach.
FREE
VWAP Indicator
LUC JACOBUS A VERHEECKE
4.19 (21)
Volume Weighted Average Price (VWAP) The volume weighted average price (VWAP) is a   trading   benchmark   used by traders that gives the average price a security has traded at throughout the day, based on both volume and price. It is important because it provides traders with insight into both the trend and value of a security. This indicator VWAP V2 is free and is the manual version of the extended Easy VWAP indicator (30 Euro), where the date and time properties are automatically entered. Wit
FREE
Weis Waves
Flavio Javier Jarabeck
3.15 (26)
The original author is David Weis, an expert in the Wyckoff Method. The Weis Wave is a modern adaptation of the 1930's Wyckoff Method, another expert in Tape Reading techniques and Chart Analysis. Weis Waves takes market volume and stacks it into waves according to price conditions giving the trader valuable insights about the market conditions. If you want to learn more about this subject you can find tons of videos in YouTube. Just look for "The Wickoff Method", "Weis Wave" and "Volume Spread
FREE
Donchian Pro
Paulo Henrique Faquineli Garcia
5 (2)
The Donchian Channel Channels are among the most popular tools of technical analysis, as they visually convey to the analyst the limits within which most price movement tends to occur. Channel users know that valuable information can be obtained at any time, whether prices are in the central region of a band or close to one of the border lines. One of the best known techniques to explore these concepts is Bollinger Bands. However, John Bollinger was not the only one to research the applicatio
FREE
Stackable VWAP
Flavio Javier Jarabeck
3.33 (6)
Volume Weighted Average Price (VWAP) is a trading benchmark commonly used by Big Players that gives the average price a Symbol has traded throughout the day. It is based on both Volume and price. Additionally we put in this indicator the MVWAP (Moving Volume Weighted Average Price). For those who do not know the usage and the importance od this indicator I recommend a great article about this subject at Investopedia ( https://www.investopedia.com/articles/trading/11/trading-with-vwap-mvwap.asp
FREE
LT Weis Waves
Thiago Duarte
5 (11)
The Weis Wave first takes the market volume and then organizes it with the price into Wave charts. It is the only software that will present the true picture of the market before you. If anyone of you, has watched an intraday price movement then you must know that it unfolds in a series of selling as well as buying waves-a procedures tearing down and building up. Wave analysis is an integral part of the trading method. The indicator helps to deal with today’s volatile market. Moreover, it works
FREE
VWAP and MVWAP
Flavio Javier Jarabeck
4.17 (6)
Volume Weighted Average Price (VWAP) is a trading benchmark commonly used by Big Players that gives the average price a Symbol has traded throughout the day. It is based on both Volume and price. Additionally we put in this indicator the MVWAP (Moving Volume Weighted Average Price). For those who do not know the usage and the importance od this indicator I recommend a great article about this subject at Investopedia ( https://www.investopedia.com/articles/trading/11/trading-with-vwap-mvwap.asp )
FREE
MIDAS Super VWAP
Flavio Javier Jarabeck
4.29 (14)
Imagine VWAP, MVWAP and MIDAS in one place... Well, you found it! Now you can track the movement of Big Players in various ways, as they in general pursue the benchmarks related to this measuring, gauging if they had good execution or poor execution on their orders. Traders and analysts use the VWAP to eliminate the noise that occurs throughout the day, so they can measure what prices buyers and sellers are really trading. VWAP gives traders insight into how a stock trades for that day and deter
FREE
This indicator sums up the difference between the sells aggression and the buys aggression that occurred in each Candle, graphically plotting the waves of accumulation of the aggression volumes.   Through these waves an exponential average is calculated that indicates the direction of the business flow. Note: This indicator DOES NOT WORK for Brokers and/or Markets WITHOUT the type of aggression (BUY or SELL).   Be sure to try our Professional version with configurable features and alerts:  Agr
FREE
White Weis Volume Ticks
Ricardo Almeida Branco
5 (3)
White Weis Volume This indicator shows the sum of the volume in each wave, bulish or bearish, as idealized by David Weis , but it brings an important addition , which is the marking of the bar with the highest volume of the wave (White Bar)! In coding the indicator, it was sought to optimize the code to require minimal processing during use and not to overload mt5. The indicator can be used for pre-trading analysis and study, where the trader analyzes possible points of support and resi
AvgVolumes
Marco Montemari
5 (2)
This indicator is based on Volumes standard indicator, calculates the average of Volumes based on the last N bars set by users, and if the value of the volume is bigger then a set % respect the average a different color will be used. The indicator is shown in a separate indicator window. This version has now a limitation in setting the % about the threshold. If you are interested to set threshold consider to buy the PRO version ( https://www.mql5.com/en/market/product/35925 ) If you want to use
FREE
VWAP Simple
Deibson Carvalho
4.03 (33)
The Volume Weighted Average Price is similar to a moving average, except volume is included to weight the average price over a period.    Volume-Weighted Average Price [VWAP] is a dynamic, weighted average designed to more accurately reflect  a security’s true average price over a given period . Mathematically, VWAP is the summation of money (i.e., Volume x Price) transacted divided by the total volume over any time horizon, typically from market open to market close. VWAP reflects the capital
FREE
Waves Sizer
Flavio Javier Jarabeck
3.67 (6)
Wyckoff fans, enjoy! Ideally to be used with the Weis Waves indicator, but it can be easily used alone, the Waves Sizer puts the range (in resulting Price movement) done by the Price on its market swings. You can control how accurate or loose will be the swings. This tool is very helpful for visually know how much the Price has traveled in your Timeframe. This way you can confront this level of effort with the resulting Volume, etc... Weis Waves indicator: https://www.mql5.com/en/market/pro
FREE
PZ Penta O MT5
PZ TRADING SLU
4 (6)
The Penta-O is a 6-point retracement harmonacci pattern which usually precedes big market movements. Penta-O patterns can expand and repaint quite a bit. To make things easier this indicator implements a twist: it waits for a donchian breakout in the right direction before signaling the trade. The end result is an otherwise repainting indicator with a very reliable trading signal. The donchian breakout period is entered as an input. [ Installation Guide | Update Guide | Troubleshooting | FAQ | A
FREE
Midas VWAP
Paulo Henrique Faquineli Garcia
4 (1)
Volume Weighted Average Price (VWAP) is a trading benchmark commonly used by Big Players that gives the average price a Symbol has traded throughout the day. It is based on both Volume and price. This indicator contains Daily VWAP and MIDAS' VWAP, which means you are able to anchor the beggining of MIDAS' calculations and, therefore you will be able to use this methodology to study price versus volume moves after anchor point. You will be able to anchor up to 3 HIGH MIDAS VWAP's and 3 LOW. Wis
FREE
Introduction This indicator detects volume spread patterns for buy and sell opportunity. The patterns include demand and supply patterns. You might use each pattern for trading. However, these patterns are best used to detect the demand zone (=accumulation area) and supply zone (=distribution area). Demand pattern indicates generally potential buying opportunity. Supply pattern indicates generally potential selling opportunity. These are the underlying patterns rather than direct price action. T
FREE
A professional tool for trading - the divergence indicator between the  Stochastic and the price, which allows you to receive a signal about a trend reversal in a timely manner or catch price pullback movements (depending on the settings). The indicator settings allow you to adjust the strength of the divergence due to the angle of the  Stochastic peaks and the percentage change in price, which makes it possible to fine-tune the signal strength. The indicator code is optimized and is tested ver
FREE
This is  RSI with alarm and push notification  -is a indicator based on the popular Relative Strength Index (RSI) indicator with Moving Average and you can use it in Forex, Crypto, Traditional, Indices, Commodities. You can change colors to see how it fits you. Back test it, and find what works best for you. This product is an oscillator with dynamic overbought and oversold levels, while in the standard RSI, these levels are static and do not change. This allows  RSI with alarm and push notific
FREE
Cybertrade Double Bollinger Bands - MT5  The Bollinger Bands indicator shows the levels of different highs and lows that a security price has reached in a given duration and also their relative strength, where the highs are close to the upper line and the lows are close to the lower line. Our differential is to present this indicator in a double form, with the availability of its values ​​to simplify automation. It works on periods longer than the period visible on the chart. All values ​​are
FREE
Aggression Volume
Flavio Javier Jarabeck
3.8 (20)
Aggression Volume Indicator is the kind of indicator that is rarely found in the MQL5 community because it is not based on the standard Volume data provided by the Metatrader 5 platform. It requires the scrutiny of all traffic Ticks requested on the platform... That said, Aggression Volume indicator requests all Tick Data from your Broker and processes it to build a very special version of a Volume Indicator, where Buyers and Sellers aggressions are plotted in a form of Histogram. Additionally,
FREE
Follow The Line MT5
Oliver Gideon Amofa Appiah
4.4 (30)
This indicator obeys the popular maxim that: "THE TREND IS YOUR FRIEND" It paints a GREEN line for BUY and also paints a RED line for SELL. (you can change the colors). It gives alarms and alerts of all kinds. IT DOES NOT REPAINT and can be used for all currency pairs and timeframes. Yes, as easy and simple as that. Even a newbie can use it to make great and reliable trades. NB: For best results, get my other premium indicators for more powerful and reliable signals. Get them here: https://www.m
FREE
Bar Color Trend
Germano Chagas
4.5 (10)
Combining the best of Price Action , Directional Movement , and Divergence/Convergence analysis, Candle Color Trend is a easy and reliable way to identify trend direction. The indicator automatically paints the candles according to the assumption that an uptrend is defined by prices that form a series of higher highs and higher lows. In contrast, a downtrend is defined by prices that form a series of lower highs and lower lows. Additionally, ADX Wilder indicator is used to measure trend weakness
FREE
SDivergence
Mobin Zarekar
1 (1)
SDivergence Indicator calculates and shows regular divergences and hidden divergences for MACD and Stochastic(for now). The benefit of this indicator is multiple input variables. Using these inputs you can modify to get more adaptive RD and HD's to your strategy. Guide : 1- First put your desired oscillator (MACD or Stochastic or Both) on the chart. 2- Run SDivergence indicator and set corresponding sub-window index of previously put oscillator in SDivergence input window. -Note: the chart sub-w
FREE
O indicador grafico de rompimento foi desenvolvido para elevar a precisão e confiabilidade na identificação de oportunidades de rompimento no mercado financeiro. Projetado com algoritmos avançados, este indicador destaca barras de rompimento com uma precisão notável, permitindo que traders identifiquem pontos de entrada e saída estratégicos. Recursos Principais: Precisão Aprimorada: Utiliza algoritmos avançados para identificar barras de rompimento com uma precisão excepcional. Alertas em Tempo
FREE
Die Moving Average Convergence Divergence (MACD) Handelsstrategie ist ein beliebtes technisches Analysewerkzeug, das verwendet wird, um Änderungen im Momentum und in der Trendrichtung zu identifizieren. Der MACD wird berechnet, indem man den 26-Perioden-exponentiellen gleitenden Durchschnitt (EMA) vom 12-Perioden-EMA subtrahiert. Eine 9-Perioden-EMA, genannt "Signal Line", wird dann oben auf den MACD geplottet, um als Auslöser für Kauf- und Verkaufssignale zu fungieren. Der MACD wird als bullish
FREE
Dual RSI
Paul Conrad Carlson
Indicator alerts for Dual Relative strength index rsi. Large rsi preset at 14 is below 30 small rsi preset at 4 is below 10 for buy bullish signals . Large rsi preset are 14 is above 70 small rsi preset at 4 is above 90 for sell bearish signals . Includes mobile and terminal alerts. draws lines when alerts. This indicator can help identify extremes and then the tops or bottoms of those extremes .
FREE
Cybertrade Keltner Channels
Emanuel Andriato
4.67 (3)
Cybertrade Keltner Channels - MT5 Created by Chester Keltner, this is a volatility indicator used by technical analysis. It is possible to follow the trend of financial asset prices and generate support and resistance patterns. In addition, envelopes are a way of tracking volatility in order to identify opportunities to buy and sell these assets. It works on periods longer than the period visible on the chart. All values ​​are available in the form of buffers to simplify possible automations.
FREE
A countdown timer for the  Volume bar chart generator  and  Tick chart generator  products, which are available for download from the MQL5 Market: Tick chart generator: https://www.mql5.com/en/market/product/29215 Volume bar chart generator: https://www.mql5.com/en/market/product/47197 The counter conveniently displays the number of ticks or transactions (depending on the chart) that need to pass for a new bar to start printing. The user can set the following indicator inputs. Volume type
FREE
Market Profile 3 ForexArby com
Hussien Abdeltwab Hussien Ryad
4.17 (12)
Market Profile 3 MetaTrader 5 indicator  version 4.70— is a classic Market Profile implementation that can show the price density over time, outlining the most important price levels, value area, and control value of a given trading session. This indicator can be attached to timeframes between M1 and D1 and will show the Market Profile for daily, weekly, monthly, or even intraday sessions. Lower timeframes offer higher precision. Higher timeframes are recommended for better visibility. It is als
FREE
Käufer dieses Produkts erwarben auch
Zunächst einmal ist es wichtig zu betonen, dass dieses Handelssystem ein Nicht-Repainting-, Nicht-Redrawing- und Nicht-Verzögerungsindikator ist, was es sowohl für manuelles als auch für automatisches Trading ideal macht. Das "Smart Trend Trading System MT5" ist eine umfassende Handelslösung, die für neue und erfahrene Trader maßgeschneidert ist. Es kombiniert über 10 Premium-Indikatoren und bietet mehr als 7 robuste Handelsstrategien, was es zu einer vielseitigen Wahl für verschiedene Marktbe
Atomic Analyst MT5
Issam Kassas
4.82 (11)
Zunächst einmal ist es erwähnenswert, dass dieser Handelsindikator nicht neu malt, nicht neu zeichnet und keine Verzögerung aufweist, was ihn sowohl für manuellen als auch für Roboterhandel ideal macht. Der Atom-Analyst ist ein PA-Preisaktionsindikator, der die Stärke und das Momentum des Preises nutzt, um einen besseren Vorteil auf dem Markt zu finden. Ausgestattet mit fortschrittlichen Filtern, die helfen, Rauschen und falsche Signale zu entfernen, und das Handelspotenzial zu erhöhen. Durch
FX Volume MT5
Daniel Stein
4.94 (17)
Erhalten Sie Ihr tägliches Marktupdate mit Details und Screenshots über unser Morning Briefing hier auf mql5 und auf Telegram ! FX Volume ist der ERSTE und EINZIGE Volumenindikator, der einen ECHTEN Einblick in die Marktstimmung aus Sicht eines Brokers bietet. Es bietet fantastische Einblicke in die Positionierung von institutionellen Marktteilnehmern, wie z.B. Brokern, auf dem Forex-Markt, viel schneller als COT-Berichte. Diese Informationen direkt auf Ihrem Chart zu sehen, ist der wahre Game
Quantum Trend Sniper
Bogdan Ion Puscasu
5 (37)
Wir stellen vor       Quantum Trend Sniper Indicator   , der bahnbrechende MQL5-Indikator, der die Art und Weise, wie Sie Trendumkehrungen erkennen und handeln, verändert! Entwickelt von einem Team erfahrener Händler mit über 13 Jahren Handelserfahrung,       Quantum Trend Sniper-Indikator       wurde entwickelt, um Ihre Trading-Reise mit seiner innovativen Methode zur Identifizierung von Trendumkehrungen mit extrem hoher Genauigkeit auf ein neues Niveau zu heben. ***Kaufe Quantum Trend Snipe
Gold Stuff mt5
Vasiliy Strukov
4.89 (166)
Gold Stuff mt5-Ein Trendindikator, der speziell für Gold entwickelt wurde, kann auch auf allen Finanzinstrumenten verwendet werden. Der Indikator wird nicht neu gezeichnet und verzögert sich nicht. Empfohlener Zeitrahmen H1. WICHTIG! Kontaktieren Sie mich sofort nach dem Kauf, um Anweisungen und Bonus zu erhalten! DATEN Draw Arrow - inkl.aus. zeichnen von Pfeilen in einem Diagramm. Alerts-inkl.aus.akustische Warnungen. E - mail notification-inkl.aus. benachrichtigungen per E-Mail. Puch-
Trend Screener Pro MT5
STE S.S.COMPANY
4.89 (61)
Nutzen Sie die Macht des Trendhandels mit Trend Screener Indicator: Ihrer ultimativen Trendhandelslösung, die auf Fuzzy-Logik und einem System mit mehreren Währungen basiert! Steigern Sie Ihren Trendhandel mit Trend Screener, dem revolutionären Trendindikator mit Fuzzy-Logik. Es handelt sich um einen leistungsstarken Trendfolgeindikator, der über 13 Premium-Tools und -Funktionen sowie 3 Handelsstrategien kombiniert und ihn zu einer vielseitigen Wahl macht, um Ihren Metatrader in einen Trendanaly
FX Power MT5 NG
Daniel Stein
5 (4)
Erhalten Sie Ihr tägliches Marktupdate mit Details und Screenshots über unser Morning Briefing hier auf mql5 und auf Telegram ! FX Power MT5 NG ist die nächste Generation unseres langjährig sehr beliebten Währungsstärkemessers FX Power. Und was bietet dieser Stärkezähler der nächsten Generation? Alles, was Sie am ursprünglichen FX Power geliebt haben PLUS GOLD/XAU-Stärkeanalyse Noch präzisere Berechnungsergebnisse Individuell konfigurierbare Analysezeiträume Anpassbares Berechnungslimit für noc
Dies ist ein Indikator für MT5, der genaue Signale für den Einstieg in einen Handel ohne Repainting (Neuzeichnen) liefert. Er kann auf alle Finanzwerte angewendet werden: Forex, Kryptowährungen, Metalle, Aktien, Indizes. Er liefert ziemlich genaue Schätzungen und sagt Ihnen, wann es am besten ist, eine Position zu eröffnen und zu schließen. Sehen Sie sich das Video (6:22) mit einem Beispiel für die Verarbeitung nur eines Signals an, das sich für den Indikator gelohnt hat! Die meisten Händler ver
Zunächst einmal ist es wichtig zu betonen, dass dieses Handelstool ein Nicht-Repaint-, Nicht-Redraw- und Nicht-Verzögerungsindikator ist, was es ideal für professionelles Trading macht. Der Smart Price Action Concepts Indikator ist ein sehr leistungsstarkes Werkzeug sowohl für neue als auch erfahrene Händler. Er vereint mehr als 20 nützliche Indikatoren in einem und kombiniert fortgeschrittene Handelsideen wie die Analyse des Inner Circle Traders und Strategien des Smart Money Concepts. Diese
RelicusRoad Pro MT5
Relicus LLC
4.82 (22)
Jetzt 147 US -Dollar (nach ein paar Aktualisierungen auf 499 US -Dollar) - Unbegrenzte Konten (PCs oder MACs) RelicusRoad Benutzerhandbuch + Schulungsvideos + Zugang zur privaten Discord-Gruppe + VIP-Status EINE NEUE ART, DEN MARKT ZU BETRACHTEN RelicusRoad ist der weltweit leistungsstärkste Handelsindikator für Forex, Futures, Kryptowährungen, Aktien und Indizes und gibt Händlern alle Informationen und Tools, die sie benötigen, um profitabel zu bleiben. Wir bieten technische Analysen un
Auto Order Block with break of structure based on ICT and Smart Money Concepts Futures Break of Structure ( BoS )             Order block ( OB )            Higher time frame Order block / Point of Interest ( POI )    shown on current chart           Fair value Gap ( FVG ) / Imbalance   ,  MTF      ( Multi Time Frame )    Volume Imbalance     ,  MTF          vIMB Gap’s Equal High / Low’s     ,  MTF             EQH / EQL Liquidity               Current Day High / Low           HOD /
XQ Indicator MetaTrader 5
Marzena Maria Szmit
5 (1)
Step into the realm of Forex trading with confidence and precision using XQ, a cutting-edge Forex indicator designed to elevate your trading game to unprecedented heights. Whether you're a seasoned trader or just stepping into the world of currency exchange, XQ Forex Indicator empowers you with the insights and signals needed to make informed trading decisions. The signal conditions are a combination of three indicators, and XQ Forex Indicator only display  medium and long-term trends . The ind
Blahtech Supply Demand MT5
Blahtech Limited
4.57 (14)
Was: $299  Now: $99   Supply Demand uses previous price action to identify potential imbalances between buyers and sellers. The key is to identify the better odds zones, not just the untouched ones. Blahtech Supply Demand indicator delivers functionality previously unavailable on any trading platform. This 4-in-1 indicator not only highlights the higher probability zones using a multi-criteria strength engine, but also combines it with multi-timeframe trend analysis, previously confirmed swings
Advanced Supply Demand MT5
Bernhard Schweigert
4.53 (15)
Derzeit 33% Rabatt! Die beste Lösung für jeden Anfänger oder erfahrenen Händler! Dieser Indikator ist ein einzigartiges, qualitativ hochwertiges und erschwingliches Trading-Tool, da wir eine Reihe von proprietären Funktionen und eine neue Formel integriert haben. Mit diesem Update werden Sie in der Lage sein, doppelte Zeitrahmenzonen anzuzeigen. Sie können nicht nur einen höheren TF (Zeitrahmen) anzeigen, sondern sowohl den Chart-TF als auch den höheren TF: SHOWING NESTED ZONES. Alle Supply Dema
AW Trend Predictor MT5
AW Trading Software Limited
4.76 (54)
Die Kombination von Trend- und Aufschlüsselungsebenen in einem System. Ein fortschrittlicher Indikatoralgorithmus filtert Marktrauschen, bestimmt den Trend, Einstiegspunkte sowie mögliche Ausstiegsniveaus. Indikatorsignale werden in einem Statistikmodul aufgezeichnet, das es Ihnen ermöglicht, die am besten geeigneten Tools auszuwählen, die die Wirksamkeit der Signalhistorie zeigen. Der Indikator berechnet Take-Profit- und Stop-Loss-Marken. Handbuch und Anleitung ->   HIER   / MT4-Version ->   H
ICT, SMC, SMART MONEY CONCEPTS, SMART MONEY, Smart Money Concept, Support and Resistance, Trend Analysis, Price Action, Market Structure, Order Blocks, BOS/CHoCH,   Breaker Blocks ,  Momentum Shift,   Supply&Demand Zone/Order Blocks , Strong Imbalance,   HH/LL/HL/LH,    Fair Value Gap, FVG,  Premium  &   Discount   Zones, Fibonacci Retracement, OTE, Buy Side Liquidity, Sell Side Liquidity, BSL/SSL Taken, Equal Highs & Lows, MTF Dashboard, Multiple Time Frame, BigBar, HTF OB, HTF Market Structure
TPSpro TRENDPRO  - is a trend indicator that automatically analyzes the market and provides information about the trend and each of its changes, as well as giving signals for entering trades without redrawing! The indicator uses each candle, analyzing them separately. referring to different impulses - up or down impulse. Exact entry points into transactions for currencies, crypto, metals, stocks, indices!  -  Version MT4                  DETAILED DESCRIPTION        /       TRADING SETUPS       
Der Gann Square Indikator ist ein leistungsstolles Marktanalyse-Tool, das auf dem Artikel "Mathematische Formel für Marktvorhersagen" von W.D. Gann basiert. Dieses Tool verwendet mathematische Konzepte und Gann-Theorien für eine präzise Marktanalyse. Es beinhaltet Quadratwerte von 144, 90, 52 und auch das Quadrat von 9. Darüber hinaus integriert es die Methode von  zur Quadratwurzel von 9 und deren Beziehung zu Kanälen und dem Sternmuster. Benutzerhandbuch und Anwendung: Vor der Verwendung diese
Werden Sie Breaker Trader und profitieren Sie von Änderungen der Marktstruktur, wenn sich der Preis umkehrt. Der Order Block Breaker Indikator zeigt an, wann sich eine Trend- oder Preisbewegung der Erschöpfung nähert und bereit ist, sich umzukehren. Es weist Sie auf Änderungen in der Marktstruktur hin, die normalerweise auftreten, wenn eine Umkehrung oder ein größerer Rückzug bevorsteht. Der Indikator verwendet eine proprietäre Berechnung, die Ausbrüche und Preisdynamik identifiziert. Jedes
Zeichnen Sie automatisch Unterstützungs- und Widerstandsniveaus PLUS Antriebskerzenlücken auf Ihrem Chart ein, so dass Sie sehen können, wohin sich der Preis wahrscheinlich als Nächstes bewegen und/oder möglicherweise umkehren wird. Dieser Indikator wurde entwickelt, um als Teil der Positionshandelsmethodik verwendet zu werden, die auf meiner Website (The Market Structure Trader) gelehrt wird, und zeigt Schlüsselinformationen für die Zielsetzung und potenzielle Einstiege an. MT4 Version:  htt
A key element in trading is zones or levels from which decisions to buy or sell a trading instrument are made. Despite attempts by major players to conceal their presence in the market, they inevitably leave traces. Our task was to learn how to identify these traces and interpret them correctly. Reversal First Impulse levels (RFI)   -  Version MT4                  INSTRUCTIONS                 RUS                 ENG                         R ecommended to use with an indicator   -  TREND PRO  
Wir stellen vor       Quantum Breakout PRO   , der bahnbrechende MQL5-Indikator, der die Art und Weise, wie Sie mit Breakout-Zonen handeln, verändert! Entwickelt von einem Team erfahrener Händler mit über 13 Jahren Handelserfahrung,       Quantum Breakout PRO       ist darauf ausgelegt, Ihre Handelsreise mit seiner innovativen und dynamischen Breakout-Zone-Strategie auf ein neues Niveau zu heben. Der Quantum Breakout Indicator zeigt Ihnen Signalpfeile auf Breakout-Zonen mit 5 Gewinnzielzone
The Volume by Price Indicator for MetaTrader 5 features Volume Profile and Market Profile TPO (Time Price Opportunity). Get valuable insights out of currencies, equities and commodities data. Gain an edge trading financial markets. Volume and TPO histogram bar and line charts. Volume Footprint charts. TPO letter and block marker charts including split structures. Versatile segmentation and compositing methods. Static, dynamic and flexible ranges with relative and/or absolute visualizations. Lay
Owl Smart Levels MT5
Sergey Ermolov
4.47 (36)
MT4-Version  |  FAQ Der Owl Smart Levels Indikator ist ein komplettes Handelssystem innerhalb eines Indikators, der so beliebte Marktanalysetools wie die fortschrittlichen Fraktale von Bill Williams , Valable ZigZag, das die richtige Wellenstruktur des Marktes aufbaut, und Fibonacci-Levels , die die genauen Einstiegslevels markieren, enthält in den Markt und Orte, um Gewinne mitzunehmen. Detaillierte Strategiebeschreibung Anleitung zur Verwendung des Indikators Berater-Assistent im Handel Owl H
TrendLine PRO MT5
Evgenii Aksenov
4.78 (49)
The Trend Line PRO indicator is an independent trading strategy. It shows the trend change, the entry point to the transaction, as well as automatically calculates three levels of Take Profit and Stop Loss protection Trend Line PRO is perfect for all Meta Trader symbols: currencies, metals, cryptocurrencies, stocks and indices Advantages of Trend Line PRO Never redraws its signals The possibility of using it as an independent strategy It has three automatic levels Take Profit and Stop Loss lev
Gartley Hunter Multi
Siarhei Vashchylka
5 (5)
Gartley Hunter Multi - An indicator for searching for harmonic patterns simultaneously on dozens of trading instruments and on all classic timeframes: (m1, m5, m15, m30, H1, H4, D1, Wk, Mn). Manual (Be sure to read before purchasing) | Version for MT4 Advantages 1. Patterns: Gartley, Butterfly, Shark, Crab. Bat, Alternate Bat, Deep Crab, Cypher 2. Simultaneous search for patterns on dozens of trading instruments and on all classic timeframes 3. Search for patterns of all possible sizes. Fr
Trend Line Map Pro MT5
STE S.S.COMPANY
4.67 (9)
Trend Line Map Indicator ist ein Add-On für Trend Screener Indicator. Es arbeitet als Scanner für alle Signale, die vom Trendscreener (Trendliniensignale) erzeugt werden. Es ist ein Trend Line Scanner basierend auf dem Trend Screener Indicator. Wenn Sie keinen Trend Screener Pro Indicator haben, funktioniert die Trend Line Map Pro nicht. It's a Trend Line Scanner based on Trend Screener Indicator. If you don't have Trend Screener Pro Indicator,     the Trend Line Map Pro will not work .
TrendDecoder Premium MT5
Christophe, Pa Trouillas
5 (1)
Top bewertet auf anderem MarketPlace -  Jetzt verfügbar auf METATRADER Identifizieren Sie Bereiche und die nächsten wahrscheinlichen Bewegungen     |    Erhalten Sie früheste Signale und die Stärke von Trends     |    Klare Ausstiegssignale vor Umkehrung     |    Erkennen Sie die Fibo-Levels, die der Kurs testen wird    |  Indikator, der nicht zurückverfolgt, nicht verzögert - ideal für den manuellen und automatisierten Trading - geeignet für alle Vermögenswerte und Zeiteinheiten - 50% Rabatt  
MetaBands M5
Vahidreza Heidar Gholami
4.67 (3)
MetaBands verwendet leistungsstarke und einzigartige Algorithmen, um Kanäle zu zeichnen und Trends zu erkennen, sodass es Tradern potenzielle Punkte für den Einstieg und Ausstieg aus Trades bieten kann. Es ist ein Kanalindikator sowie ein leistungsstarker Trendindikator. Es umfasst verschiedene Arten von Kanälen, die einfach durch Verwendung der Eingabeparameter zusammengeführt werden können. MetaBands verwendet alle Arten von Warnmeldungen, um Benutzer über Marktereignisse zu informieren. Funkt
Was: $249  Now: $99   Market Profile defines a number of day types that can help the trader to determine market behaviour. A key feature is the Value Area, representing the range of price action where 70% of trading took place. Understanding the Value Area can give traders valuable insight into market direction and establish the higher odds trade. It is an excellent addition to any system you may be using. Inspired by Jim Dalton’s book “Mind Over Markets”, this indicator is designed to suit the
Weitere Produkte dieses Autors
Build EA
Edilson Domingos
Erstellen Sie Ihren EA mit Build EA, damit können Sie Ihre Strategie mit den verfügbaren Indikatoren und Tools erstellen. Build EA hat keine definierte Strategie, aber damit können Sie Kombinationen von Indikatoren verwenden und sie zusammen mit den verfügbaren Tools als Signale oder Filter verwenden und Ihre Strategie aufbauen! Verfügbare Indikatoren: Adx Alligator Bollinger-Bänder Macht tragen Stierkraft IHK Kreuzung der Mittel dx Umschlag Stochastik fraktal macd OBV Parabolische SAR zurü
EA Keltner
Edilson Domingos
Keltner-Kanal-Durchbruchsstrategie: Der für die Metatrader 5-Plattform entwickelte Handelsroboter ist darauf ausgelegt, automatisch die Keltner-Kanal-Durchbruchsstrategie zu verwenden. Diese Strategie beinhaltet die Identifizierung von Ein- und Ausstiegspunkten basierend auf der Marktvolatilität, wie sie von den Keltner-Kanälen definiert wird. Hauptfunktionen: Keltner-Kanal-Durchbruch : Der Roboter identifiziert Momente, in denen der Preis die Keltner-Kanäle durchbricht, was auf Kauf- oder Verka
FREE
Result per Symbol MT5
Edilson Domingos
5 (5)
When working with several assets and having several open positions in different assets, it is a little complicated to visualize how much profit or loss is in each asset, so with this problem in mind I developed this indicator where it facilitates the visualization of open operations in each asset , where you will be able to open several different assets and you will be able to visualize the individual result of each asset and speed up your decision making in your trades.
FREE
Build EA Simple
Edilson Domingos
3.4 (5)
Build your EA with Build EA Simple, with it you can build your strategy with the available indicators and tools. Build EA Simple does not have any defined strategy, but with it you can use combinations of indicators and use them as signals or filters and build your strategy! Build EA Simple is a simplified version of Build EA that doesn't have as many tools. Discover Build EA Pro  https://www.mql5.com/pt/market/product/88859?source=Unknown%3Ahttps%3A%2F%2Fwww.mql5.com%2Fpt%2Fmarket%2Fmy I
FREE
When you work with several assets and have several open positions in assets, it is a little complicated to visualize when profit or profit each active problem is giving, so with this in mind, we develop this indicator where it facilitates the visualization of operations in assets, where you you will be able to open several different resources and you will be able to visualize the individual result of each asset and speed up your decision making in your business.
FREE
Indicador de Volume
Edilson Domingos
4.5 (2)
Dieser Indikator ist ein Volumenindikator, der die Farbe der Kerzen entsprechend einer bestimmten Anzahl von Ticks ändert, und diese Anzahl von Ticks kann der Benutzer sowohl über die Anzahl der Ticks als auch über die Farbe der Kerzen informieren. Dieser Indikator funktioniert in jeder grafischen Zeit oder einen Vermögenswert, vorausgesetzt, der Vermögenswert verfügt über eine Tickernummer, über die informiert werden muss. Dieser Indikator soll dem Benutzer die Anzeige beim Analysieren von
FREE
Auto Hedge MT5
Edilson Domingos
Eröffnen Sie eine Richtung für den Trade, dem der Markt zu folgen beabsichtigt, und einen Trade, der bei Ihrem Trade stattgefunden hat. Beispiel: eine Kaufoperation mit einem Lot von 0,01 zu einem Preis von 0,03 Punkten, ein Kauf mit einem Lot von 0,01 zu einem Preis von 0,01.0930, dann wird eine Verkaufsstopporder von 0,03 entschieden. eine neue Kauf-Stopp-Order wird mit einem Lot von 0,06 zu einem Preis von 1,0930 platziert. Parameter: Lautstärke -> Lautstärke der ersten Operation
Trend Follower   predicts the possible start of a trend, the indicator uses as a basis for the closing high possibility of the indicators to identify a possible entry or low possibility, the indicator just an entry parameter which can be the period . Input parameters Period : A positive integer that indicates the period for number Alert:   Sends an audible signal when a signal occurs Check out other products:   https://www.mql5.com/en/users/junioredj16/seller
Auswahl:
MIXA.Z Захаренко
59
MIXA.Z Захаренко 2023.01.19 08:05 
 

Пайдёт нормальный. Только графики линиями портит.

autovolk
847
autovolk 2022.09.01 10:48 
 

Super

Antwort auf eine Rezension