• Übersicht
  • Bewertungen
  • Diskussion

AIS Forest Fire Trend

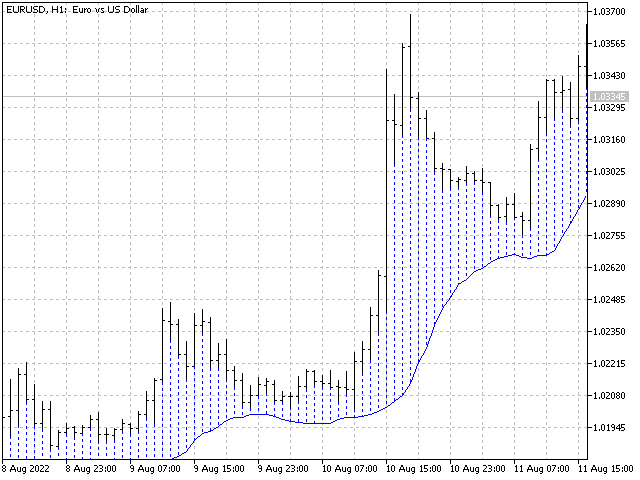
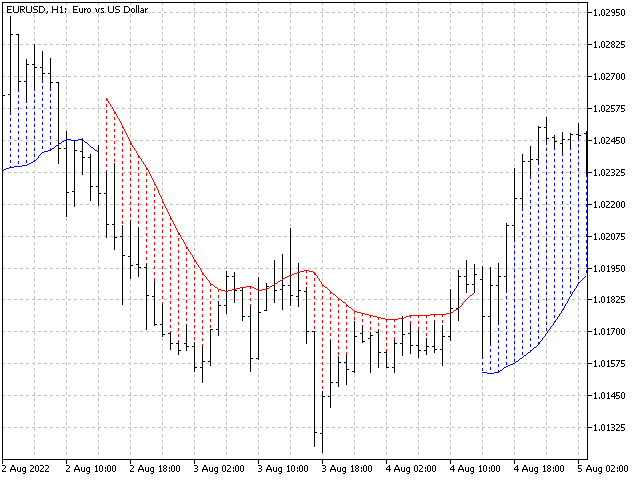
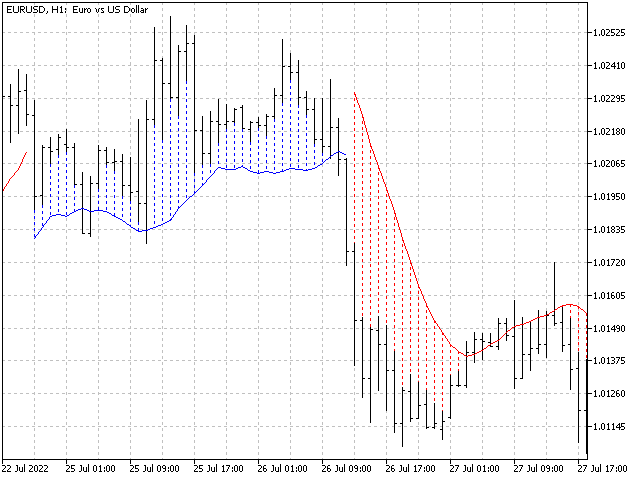
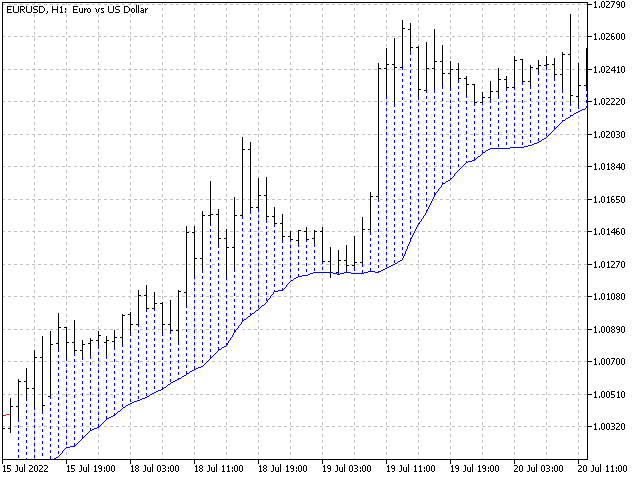
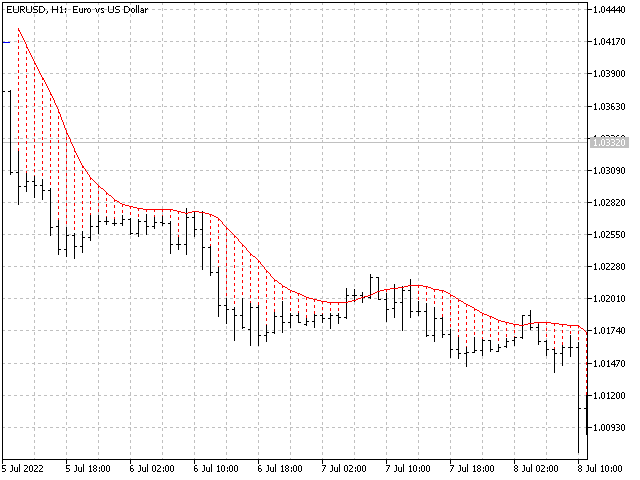
Eine der Zahlenfolgen heißt „Forest Fire Sequence“. Es wurde als eine der schönsten neuen Sequenzen anerkannt. Sein Hauptmerkmal ist, dass diese Sequenz lineare Trends vermeidet, selbst die kürzesten. Diese Eigenschaft bildete die Grundlage dieses Indikators.
Bei der Analyse einer Finanzzeitreihe versucht dieser Indikator, alle möglichen Trendoptionen abzulehnen. Und nur wenn er scheitert, dann erkennt er das Vorhandensein eines Trends und gibt das entsprechende Signal. Dieser Ansatz ermöglicht es, die Momente des Beginns neuer Trends richtig zu bestimmen. Es sind jedoch auch Fehlalarme möglich. Um ihre Anzahl zu reduzieren, wurde diesem Indikator ein zusätzlicher Filter hinzugefügt. Signale werden generiert, wenn ein neuer Balken eröffnet wird. Eine Neuzeichnung erfolgt in keinem Fall.
Indikatorparameter:
  • Applied Price - angewandte Preiskonstante;
  • Period Main - die Hauptperiode des Indikators, sein gültiger Wert liegt zwischen 5 und 60;
  • Period Additional - zusätzliche Periode, gültiger Wert dieses Parameters ist 5 - 40;
  • Signal Filter - zusätzlicher Signalfilter, gültiger Wert 0 - 99;
  • Alerts - wenn aktiviert, wird der Indikator Sie benachrichtigen, wenn ein neues Signal erscheint;
  • Send Mail - ermöglicht dem Indikator, eine Nachricht per E-Mail zu senden;
  • Push – ermöglicht das Senden von Push-Nachrichten.
Empfohlene Produkte
Noize Absorption Index - is the manual trading system that measures the difference of pressure between bears forces and bulls forces. Green line - is a noize free index that showing curent situation. Zero value of index shows totally choppy/flat market.Values above zero level shows how powerfull bullish wave is and values below zero measures bearish forces.Up arrow appears on bearish market when it's ready to reverse, dn arrow appears on weak bullish market, as a result of reverse expectation. S
199 USD
Accuracy of correct predictions 83%! This indicator was tested on the basis of real statistics for all market indicators according to indicators for 3 months of trading. 83% of correct trade forecasts for usd / jpy on the m30 time frame were received on our statistics! if you have any questions, please contact us in private messages or in discussions under this indicator and we will figure it out and help any questions will arise personal messages or in discussions under this indicator As soon
100 USD
MT4-Indikatoren. Drei Ebenen von Fibonacci-Unterstützungs- und Widerstandsebenen werden automatisch gezeichnet. Sie sind: Monatsstufe: Mittlere Orchidee Wochenlevel: Orangerot Tageslinienniveau: Türkis Die Farbe kann über Parameter angepasst werden. MT5 Version: https://www.mql5.com/EN/market/product/80068 Dieser Indikator wird hauptsächlich verwendet, um zukünftige Unterstützungs- und Widerstandsniveaus für eine bessere Handelsanalyse zu analysieren. Wenn das Unterstützungsniveau v
40 USD
The Th3Eng PipFinite indicator is based on a very excellent analysis of the right trend direction with perfect custom algorithms. It show the true direction and the best point to start trading. With StopLoss point and Three Take Profit points. Also it show the right pivot of the price and small points to order to replace the dynamic support and resistance channel, Which surrounds the price. And Finally it draws a very helpful Box on the left side on the chart includes (take profits and Stop loss
89 USD
Introduction It is common practice for professional trades to hide their stop loss / take profit from their brokers. Either from keeping their strategy to the themselves or from the fear that their broker works against them. Using this indicator, the stop loss / take profit points will be drawn on the product chart using the bid price. So, you can see exactly when the price is hit and close it manually.  Usage Once attached to the chart, the indicator scans the open orders to attach lines fo
30 USD
Be notified of every color change of Heiken Ashi (HA) candles. The indicator will trigger past and new signals every time that HA candles change their colors. Note : this tool is based on the code of Heiken Ashi indicator developed by MetaQuotes Software Corp. Features The signals are triggered at closing of last bar/opening of a new bar; Any kind of alerts can be enabled: Dialog Box, Email message, SMS notifications for smartphones and tablets, and Sound alerts; By default, up arrows are plot
30 USD
The indicator displays the data of the Stochastic oscillator from a higher timeframe on the chart. The main and signal lines are displayed in a separate window. The stepped response is not smoothed. The indicator is useful for practicing "manual" forex trading strategies, which use the data from several screens with different timeframes of a single symbol. The indicator uses the settings that are identical to the standard ones, and a drop-down list for selecting the timeframe. Indicator Parame
30 USD
Daily Candle Predictor ist ein Indikator, der den Schlusskurs einer Kerze vorhersagt. Der Indikator ist in erster Linie für die Verwendung in D1-Charts gedacht. Dieser Indikator eignet sich sowohl für den traditionellen Devisenhandel als auch für den Handel mit binären Optionen. Der Indikator kann als eigenständiges Handelssystem oder als Ergänzung zu Ihrem bestehenden Handelssystem verwendet werden. Dieser Indikator analysiert die aktuelle Kerze und berechnet bestimmte Stärkefaktoren innerhalb
65 USD
Power Renko is an indicator which plots Renko bricks underneath the chart using a histogram. You can select the brick size and the timeframe of the Renko bricks as well as whether or not to use the close price or the high/low price of the candles. Renko bricks are based on price alone, not time, therefor the Renko bricks will not be aligned with the chart's time. They are extremely useful for trend trading and many different strategies can be formed from them. Buffers are provided allowing you t
30 USD
Master Scalping M1 ist ein innovativer Indikator, der einen Algorithmus verwendet, um den Trend schnell und genau zu bestimmen. Der Indikator berechnet den Zeitpunkt zum Öffnen und Schließen von Positionen, die Indikatoralgorithmen ermöglichen es Ihnen, die idealen Zeitpunkte für den Einstieg in einen Handel (Kauf oder Verkauf eines Vermögenswerts) zu finden, was den Erfolg von Transaktionen für die meisten Händler erhöht. Vorteile des Indikators: Einfach zu bedienen, überladen Sie das Diagramm
30 USD
Trendiness Index
Libertas LLC
5 (3)
"The trend is your friend" is one of the best known sayings in investing, because capturing large trendy price movements can be extremely profitable. However, trading with the trend is often easier said than done, because many indicators are based on price reversals not trends. These aren't very effective at identifying trendy periods, or predicting whether trends will continue. We developed the Trendiness Index to help address this problem by indicating the strength and direction of price trend
49 USD
The indicator allows you to trade binary options. The recommended time frame is М1 and the expiration time is 1,2,3 minutes. The indicator suitable for auto and manual trading. A possible signal is specified as a arrows above/under a candle. You should wait until the candle closes! Arrows are not re-painted Trade sessions: TOKYO section (Half-end) Currency pairs: USD/JPY Working time frame: M1 Expiration time: 1,2,3 minutes. The indicator also shows good results when using the martingale strateg
FREE
CandyEnveloped Merge GreenYellow
EF Trading Systems Developent
This colorful trend indicator has been developed with the new generation of computer screens in mind. CandyEnveloped Merge GreenYellow acts as SUPPORT or RESISTANCE, if the price is up it will turn GREEN and if it's descending it will turn YELLOW. This indicator works in any time frame and with any pair of currencies, indices or stocks. However, the higher the time frame, the better results will be obtained. To BUY verify that the indicator is GREEN, wait for the price to enter the green
50 USD
Heiken Ashi candle chart is an improved version of The Japanese candle chart, which can effectively filter the market "noise" of the Japanese candle chart. It is favored by many traders for its simplicity and intuition. For trend traders, the HA candle chart is a magic tool. Unlike the traditional Japanese candle chart, Heikenashi does not reflect the opening price, high price, low price and closing price of the market. Instead, Heikenashi calculates the value of a single K line in the dominant
30 USD
Break Moment
Svyatoslav Kucher
Break Moment is a unique proprietary indicator with extensive capabilities and a variety of settings. It can be used as a signal generator or as an auxiliary tool. For the calculations, the price channel is determined. When it is broken, if all conditions of the additional filter are met, it displays a signal in the form of a histogram. Break Moment can be used to determine the main trend, as it has 2 filters for determining it in addition to everything else. If these filters are activated, the
55 USD
Trade with Gann on your side!! MASTER CIRCLE 360 CIRCLE CHART, originally created by Gann admitted that this is “The Mother of all charts”. It is one of the last studies that this great trader left for us. The numeric tab le is apparently quite simple like all the tables and is based on square numbers, the SQUARE OF 12 and is by evolution, one of the most important square numbers. Here we can find CYCLE, PRICE AND TIME thanks to angles and grades, to show past and future support and resistance.
149.99 USD
Signal trend indicator. Detects the direction of the trend and is coloured accordingly.  Has built in audible and visual alerts when trends change. Can send notifications to your phone or email. Allows Trend and Counter-Trend trading. Works on all timeframes, all currency pairs, metals, indices and cryptocurrencies. Can be used with binary options. Distinctive features No re-drawing; Simple and clear settings; Four types of alerts; Works on all timeframes and all trading tools; Su
39 USD
The RSI with Trend Catcher signal is an easy-to-follow mt4 indicator that works like the traditional RSI. The RSI Trend Catcher plots a signal line similar to RSI but with some alterations. The indicator tells you overbought oversold areas and presents buying and selling opportunities. In addition, it catches the bullish and bearish divergences and locate trends better than the traditional RSI indicator. The RSI trend catcher consists of three colors; red, green, and yellow, with each color havi
30 USD
An indicator of pattern #31 ("Long Island") from Encyclopedia of Chart Patterns by Thomas N. Bulkowski. The second gap is in the opposite direction. Parameters: Alerts - show alert when an arrow appears   Push - send a push notification when an arrow appears (requires configuration in the terminal) GapSize - minimum gap size in points ArrowType - a symbol from 1 to 17 ArrowVShift - vertical shift of arrows in points   ShowLevels - show levels ColUp - color of an upward line ColDn - color of
30 USD
Infinity Trend Pro
Yaroslav Varankin
1 (1)
This is a trend indicator without redrawing Developed instead of the binary options strategy (by the color of the Martingale candlestick) Also works well in forex trading When to open trades (binary options) A signal will appear in the place with a candle signaling the current candle It is recommended to open a deal for one candle of the current timeframe M1 and M5 When a blue dot appears, open a deal up When a red dot appears, open a trade down. How to open trades on Forex. When a signal is rec
1 000 USD
Forex Gump
Andrey Kozak
2.83 (6)
Forex Gump is a fully finished semi-automatic trading system. In the form of arrows, signals are displayed on the screen for opening and closing deals. All you need is to follow the instructions of the indicator. When the indicator shows a blue arrow, you need to open a buy order. When the indicator shows a red arrow, you need to open a sell order. Close orders when the indicator draws a yellow cross. In order to get the most effective result, we recommend using the timeframes H1, H4, D1. There
147 USD
PABT Pattern Indicator - it's classical system one of the signal patterns. Indicator logic - the Hi & Lo of the bar is fully within the range of the preceding bar, look to trade them as pullback in trend. In the way if indicator found PABT pattern it's drawing two lines and arrow what showing trend way.  - First line - it's entry point and drawing at: 1. On the high of signal bar or on middle of the signal bar (depending from indicator mode) for buy; 2. On the low of signal bar or on middle of t
110 USD
This is not Th3Eng PipFinite indicator It is Th3Eng PipFinite PRO ==> based on another logic and algorithms (Th3Eng PipFinite Original is here ) Attention: New update arrived for Th3Eng PipFinite PRO EA. So please contact us to get the new one. The Th3Eng PipFinite Pro indicator is based on an analysis of the right trend direction with perfect custom algorithms. It show the true direction and the best point of the trend. With Stop Loss point and Three Take Profit points. Also it show the righ
150 USD
Strong Retracement Points Pro demo edition! SRP (Strong Retracement/Reversal Points) is a powerful and unique support and resistance indicator. It displays the closest important levels which we expect the price retracement/reversal! If all level are broken from one side, it recalculates and draws new support and resistance levels, so the levels might be valid for several days depending on the market! If you are still hesitating to start using this wonderful tool, you can check this link to see h
100 USD
Matrixs
Andriy Sydoruk
Matrix is a Forex arrow indicator. Displays signals simply and clearly! The arrows show the direction of the transaction, and are colored accordingly, which can be seen in the screenshots. As you can see, trading with such an indicator is easy. I waited for an arrow to appear in the desired direction - I opened a deal. An arrow formed in the opposite direction - closed the deal. The indicator also displays the lines with the help of which the arrow signals are formed, taking into account the int
99 USD
Laguerre SuperTrend Clouds adds an Adaptive Laguerre averaging algorithm and alerts to the widely popular SuperTrend indicator. As the name suggests, Laguerre SuperTrend Clouds (LSC) is a trending indicator which works best in trendy (not choppy) markets. The SuperTrend is an extremely popular indicator for intraday and daily trading, and can be used on any timeframe. Incorporating Laguerre's equation to this can facilitate more robust trend detection and smoother filters. The LSC uses the impro
30 USD
Trend Ray
Andriy Sydoruk
The indicator shows the potential trend direction by cyclical-wave dependence. Thus, all the rays of the intersection will be optimal rays, in the direction of which the price is expected to move, taking into account the indicator period. Rays can be used as a direction for potential market movement. But we must not forget that the approach must be comprehensive, the indicator signals require additional information to enter the market.
59 USD
Heiken Ashi Pro
Nguyen Hang Hai Ha
5 (2)
Heiken Ashi Pro is a more advanced version than the default Heiken Ashi version of Metatrader 4. Features: Automatic change width when zooming ON / OFF button to display candles or not Options for changing colors The Heikin-Ashi technique is used by technical traders to identify a given trend more easily. Because the Heikin-Ashi technique smooths price information over two periods, it makes trends, price patterns, and reversal points easier to spot. Candles on a traditional candlestick chart fre
30 USD
Trend Monitor
Pavel Zamoshnikov
4.2 (5)
The indicator generates early signals basing on ADX reading data combined with elements of price patterns. Works on all symbols and timeframes. The indicator does not redraw its signals. You see the same things on history and in real time. For better visual perception signals are displayed as arrows (in order not to overload the chart). Features Easy to use. Filter configuration only requires selection of sensitivity in the " Sensitivity of the indicator " input. Signals can be filtered usin
30 USD
Indicator for binary options arrow is easy to use and does not require configuration works on all currency pairs, cryptocurrencies buy signal blue up arrow sell signal red down arrow tips do not trade during news and 15-30 minutes before their release, as the market is too volatile and there is a lot of noise it is worth entering trades one or two candles from the current period (recommended for 1 candle) timeframe up to m 15 recommended money management fixed lot or fixed percentage of the depo
100 USD
Käufer dieses Produkts erwarben auch
RelicusRoad Pro
Relicus LLC
4.94 (87)
JETZT 147 $ (602 $ RABATT) - UNBEGRENZTE KONTEN - PREISERHÖHUNGEN BEIM NÄCHSTEN UPDATE - VERGESSEN SIE NICHT, EINE 5-STERNE-BEWERTUNG ZU VERLASSEN RelicusRoad Benutzerhandbuch + Schulungsvideos + Zugang zur privaten Discord-Gruppe + VIP-Status EINE NEUE ART, DEN MARKT ZU BETRACHTEN RelicusRoad ist der weltweit leistungsstärkste Handelsindikator für Forex, Futures, Kryptowährungen, Aktien und Indizes und gibt Händlern alle Informationen und Tools, die sie benötigen, um profitabel zu bleib
147 USD
Ultimate Sniper Dashboard
Hispraise Chinedum Abraham
4.78 (18)
Ermäßigt auf $299! Die Preise können in Zukunft steigen! Lesen Sie die Beschreibung unten! Bestes Einstiegssystem für Ultimate Sniper Dashboard: ULTIMATIVE DYNAMISCHE EBENEN. (Bitte überprüfen Sie meine Produkte) Das Ultimate Sniper Dashboard funktioniert NUR auf Live-Märkten aufgrund der MT4 Multicurrency Testlimits. Wir stellen Ihnen das Ultimate-Sniper Dashboard vor! Unser bestes, das sowohl HA-Sniper, MA-Sniper und viele spezielle Modi enthält. Das Ultimate Sniper Dashboard ist ein
299 USD
DERZEIT 26% RABATT Die beste Lösung für jeden Newbie oder Expert Trader! Dieser Indikator ist ein einzigartiges, qualitativ hochwertiges und erschwingliches Trading-Tool, da wir eine Reihe von proprietären Funktionen und eine neue Formel integriert haben. Mit nur EINEM Chart können Sie die Währungsstärke für 28 Forex-Paare ablesen! Stellen Sie sich vor, wie sich Ihr Handel verbessern wird, weil Sie in der Lage sind, den genauen Auslösungspunkt eines neuen Trends oder einer Scalping-Gelegenh
148 USD
Advanced Supply Demand
Bernhard Schweigert
4.94 (285)
Derzeit 33% Rabatt! Die beste Lösung für jeden Anfänger oder erfahrenen Händler! Dieser Indikator ist ein einzigartiges, qualitativ hochwertiges und erschwingliches Trading-Tool, da wir eine Reihe von proprietären Funktionen und eine neue Formel integriert haben. Mit diesem Update werden Sie in der Lage sein, doppelte Zeitrahmenzonen anzuzeigen. Sie können nicht nur einen höheren TF (Zeitrahmen) anzeigen, sondern sowohl den Chart-TF als auch den höheren TF: SHOWING NESTED ZONES. Alle Supply Dema
148 USD
Gold Stuff
Vasiliy Strukov
4.89 (144)
Gold Stuff-Ein Trendindikator, der speziell für Gold entwickelt wurde, kann auch auf allen Finanzinstrumenten verwendet werden. Der Indikator wird nicht neu gezeichnet und verzögert sich nicht. Empfohlener Zeitrahmen H1. Nach diesem Indikator geschrieben EA Gold Stuff Berater, können Sie es in meinem Profil finden. WICHTIG! Kontaktieren Sie mich sofort nach dem Kauf, um Anweisungen und Bonus zu erhalten! DATEN Draw Arrow - inkl.aus. zeichnen von Pfeilen in einem Diagramm. Alerts-inkl.aus.
50 USD
Ultimate Dynamic Levels
Hispraise Chinedum Abraham
4.86 (7)
Derzeit auf Urlaub Rabatt bei $ 399! Die Preise können in Zukunft steigen. Lesen Sie die Beschreibung unten!  Einführung von Ultimate Dynamic Levels - der BESTE Einstiegsindikator für das Ultimate Sniper Dashboard! Extrem risikoarme, rechtzeitige Einstiege und hohe RR!! Finden Sie das Ultimate Sniper Dashboard HIER. Die wichtigste Fähigkeit sowohl für Anfänger als auch für Profis ist es, genau zu erkennen, wo und wann ein Markt am wahrscheinlichsten dreht, und wie man sicher einsteigt und mi
199 USD
Italo Volume Indicator
Italo Santana Gomes
4.96 (68)
BUY INDICATOR AND GET EA FOR FREE AS A BONUS + SOME OTHER GIFTS! ITALO VOLUME INDICATOR  is the best volume indicator ever created, and why is that? The Indicator works on all time-frames and assets, indicator built after 6 years of experience on forex and many other markets. You know many volume indicators around the internet are not complete, does not help, and it's difficult to trade, but the Italo Volume Indicator is different , the Italo Volume Indicator shows the wave volume, when market
65 USD
Scalper Vault
Oleg Rodin
5 (11)
Scalper Vault ist ein professionelles Scalping-System, das Ihnen alles bietet, was Sie für erfolgreiches Scalping benötigen. Dieser Indikator ist ein komplettes Handelssystem, das von Forex- und Binäroptionshändlern verwendet werden kann. Der empfohlene Zeitrahmen ist M5. Das System liefert Ihnen genaue Pfeilsignale in Richtung des Trends. Es liefert Ihnen auch Top- und Bottom-Signale und Gann-Marktniveaus. Die Indikatoren bieten alle Arten von Warnungen, einschließlich PUSH-Benachrichtigungen.
65 USD
A top and bottom indicator that can intuitively identify the trend of the band. It is the best choice for manual trading, without redrawing or drifting. For any novice and programming trading friend, you can write the signal into the EA to play freely. Array 3 and array 4, for example, 3>4 turns green, 3<4 turns red. If you don't understand, please contact me. Original price of USD 198 ( current price of USD 69 ) - Next update price increase- unlimited account - do not forget to leave 5 star com
69 USD
Derzeit 20% Rabatt! Die beste Lösung für jeden Neueinsteiger oder Expert Händler! Dieses Dashboard arbeitet mit 28 Währungspaaren. Es basiert auf 2 unserer Hauptindikatoren (Advanced Currency Strength 28 und Advanced Currency Impulse). Es bietet einen hervorragenden Überblick über den gesamten Forex-Markt. Es zeigt die Werte der Advanced Currency Strength, die Veränderungsrate der Währungen und die Signale für 28 Devisenpaare in allen (9) Zeitrahmen. Stellen Sie sich vor, wie sich Ihr Hande
199 USD
Werden Sie Breaker Trader und profitieren Sie von Änderungen der Marktstruktur, wenn sich der Preis umkehrt. Der Order Block Breaker Indikator zeigt an, wann sich eine Trend- oder Preisbewegung der Erschöpfung nähert und bereit ist, sich umzukehren. Es weist Sie auf Änderungen in der Marktstruktur hin, die normalerweise auftreten, wenn eine Umkehrung oder ein größerer Rückzug bevorsteht. Der Indikator verwendet eine proprietäre Berechnung, die Ausbrüche und Preisdynamik identifiziert. Jedes
49 USD
ICT, SMC, SMART MONEY CONCEPTS, SMART MONEY, Smart Money Concept, Support and Resistance, Trend Analysis, Price Action, Market Structure, Order Blocks, BOS/CHoCH,   Momentum Shift, HH/LL/HL/LH,    Fair Value Gap, FVG,  Premium  &   Discount   Zones, Fibonacci Retracement, OTE, Buy Side Liquidity, Sell Side Liquidity, BSL/SSL Taken, Equal Highs & Lows, MTF, Multiple Time Frame, BigBar, HTF OB, HTF Market Structure,  Liquidity Voids, Long Wicks, Candle Timer, Fractals, ZigZag, Time Zone, Market Se
60 USD
Entry Points Pro
Yury Orlov
4.72 (214)
Dies ist ein Indikator für MT4, der genaue Signale für den Einstieg in einen Handel ohne Repainting (Neuzeichnen) liefert. Er kann auf alle Finanzwerte angewendet werden: Forex, Kryptowährungen, Metalle, Aktien, Indizes. Er liefert ziemlich genaue Schätzungen und sagt Ihnen, wann es am besten ist, eine Position zu eröffnen und zu schließen. Sehen Sie sich das Video (6:22) mit einem Beispiel für die Verarbeitung nur eines Signals an, das sich für den Indikator gelohnt hat! Die meisten Händler ver
125 USD
PRO Renko System ist ein hochpräzises Handelssystem, das speziell für den Handel mit RENKO-Charts entwickelt wurde. Dies ist ein universelles System, das auf verschiedene Handelsinstrumente angewendet werden kann. Das System neutralisiert effektiv so genannte Marktgeräusche, die Ihnen Zugang zu genauen Umkehrsignalen geben. Der Indikator ist sehr einfach zu bedienen und hat nur einen Parameter, der für die Signalerzeugung verantwortlich ist. Sie können das Tool einfach an jedes Handelsinstr
75 USD
Italo Trend Indicator
Italo Santana Gomes
4.78 (27)
BUY INDICATOR AND GET EA FOR FREE AS A BONUS + SOME OTHER GIFTS! ITALO TREND INDICATOR  is the best trend indicator on the market, the Indicator works on all time-frames and assets, indicator built after 6 years of experience on forex and many other markets. You know many trend indicators around the internet are not complete, does not help, and it's difficult to trade, but the Italo Trend Indicator is different , the Italo Trend Indicator shows the signal to buy or sell, to confirm the signal t
65 USD
Owl smart levels
Sergey Ermolov
5 (6)
Indikator-Leitfaden  |  Owl Smart Levels-Strategie  |   MT5-Version  |  Wie installiert man?   |   FAQ Der   Owl Smart Levels Indikator   ist ein komplettes Handelssystem innerhalb eines Indikators, der so beliebte Marktanalysetools wie die   fortschrittlichen Fraktale von Bill Williams , Valable ZigZag, das die   richtige Wellenstruktur   des Marktes aufbaut, und   Fibonacci-Levels , die die genauen Einstiegslevels markieren, enthält in den Markt und Orte, um Gewinne mitzunehmen. Eine detailli
85 USD
DERZEIT 31% RABATT! Die beste Lösung für jeden Newbie oder Expert Trader! Dieser Indikator ist ein einzigartiges, qualitativ hochwertiges und erschwingliches Handelsinstrument, da wir eine Reihe von proprietären Funktionen und eine geheime Formel eingebaut haben. Mit nur EINEM Chart liefert er Alerts für alle 28 Währungspaare. Stellen Sie sich vor, wie sich Ihr Handel verbessern wird, weil Sie in der Lage sind, den genauen Auslösepunkt eines neuen Trends oder einer Scalping-Gelegenheit zu e
88 USD
Strong Support
Vasiliy Strukov
5 (14)
Unterstützungs- und Widerstandsniveaus sind seit der Antike ein mächtiges Werkzeug für die Marktanalyse. Strong Support Der Indikator baut Unterstützungsniveaus auf lokalen Preistiefs und Widerstandsniveaus auf lokalen Preishochs auf.  Meine anderen Entwicklungen finden Sie hier Es wird empfohlen, in Verbindung mit einem Trendindikator wie Gold Stuff zu verwenden, um den Trend zu handeln und gleichzeitig Konsolidierungs- oder Umkehrzonen zu definieren sowie Stop-Loss und Take-Profit auf Unt
50 USD
Dieser Indikator ist eine hervorragende Kombination aus unseren 2 Produkten Advanced Currency IMPULSE with ALERT  +   Currency Strength Exotics . Es funktioniert für alle Zeitrahmen und zeigt grafisch Impulse der Stärke oder Schwäche für die 8 wichtigsten Währungen plus ein Symbol! Dieser Indikator ist darauf spezialisiert, die Beschleunigung der Währungsstärke für beliebige Symbole wie Gold, Exotische Paare, Rohstoffe, Indizes oder Futures anzuzeigen. Als erster seiner Art kann jedes Sym
149 USD
AW Trend Predictor
Alexander Nechaev
4.82 (28)
Die Kombination von Trend- und Aufschlüsselungsebenen in einem System. Ein fortschrittlicher Indikatoralgorithmus filtert Marktrauschen, bestimmt den Trend, Einstiegspunkte sowie mögliche Ausstiegsniveaus. Indikatorsignale werden in einem Statistikmodul aufgezeichnet, das es Ihnen ermöglicht, die am besten geeigneten Tools auszuwählen, die die Wirksamkeit der Signalhistorie zeigen. Der Indikator berechnet Take-Profit- und Stop-Loss-Marken. Handbuch und Anleitung ->   Hier   / MT5-Version ->   H
55 USD
Trend Screener
STE S.S.COMPANY
4.75 (57)
Trendindikator, bahnbrechende, einzigartige Lösung für Trendhandel und -filterung mit allen wichtigen Trendfunktionen in einem Tool! Es handelt sich um einen 100 % nicht neu zu malenden Multi-Timeframe- und Multi-Währungs-Indikator, der für alle Symbole/Instrumente verwendet werden kann: Forex, Rohstoffe, Kryptowährungen, Indizes und Aktien. Trend Screener ist ein effizienter Trendfolgeindikator, der Pfeiltrendsignale mit Punkten im Diagramm liefert. Die Funktionen, die im Trendanalysator-Indika
50 USD
Trend Scanner GS
Vasiliy Strukov
5 (15)
Trend Scanner scannt Markttrends aus Multi-Symbolen und Multi-Time-Frames und zeigt sie auf einem beweglichen Panel auf dem Chart an, den er zur Analyse verwendet. Der Händler kann mehrere Paare seiner Wahl zur Anzeige auswählen. Trend Scanner ist ein großartiges Tool, um die Richtung des Trends zu sehen, und kann für den manuellen Handel oder den EA-Handel verwendet werden, indem nur Kauf- oder Verkaufsaufträge gemäß dem Trend zugelassen werden. Echtzeit-Ergebnisse können hier eingesehen wer
50 USD
Spirit mt4
Alena Snigireva
5 (1)
Spirit mt4 is an indicator that works without flashing, the signals are triggered after the arrow at the beginning of the next candle Includes several indicators for overbought and oversold levels. Works with any currency pair: EUR/USD, AUD/USD and others. After the purchase, send me a private message and I will send you the settings that I use for this indicator. Suitable for trading cryptocurrencies. I like to trade cryptocurrency more, so I use it more there. It can also be used
800 USD
Swing Scanner
Reza Aghajanpour
4.4 (20)
** All Symbols x All Timeframes scan just by pressing scanner button ** *** Contact me after the purchase to send you instructions and add you in "Swing scanner group" for sharing or seeing experiences with other users. CURRENT PRICE $39..... Future Price $200 Introduction: Swing Scanner is the indicator designed to detect swings in the direction of the trend and possible reversal swings. The indicator studies several price and time vectors to track the aggregate trend direction and detects si
39 USD
RSI Divergence Full
Mihails Babuskins
4.54 (28)
RSI Divergence Full + 5 other divergence indicators(CCI / MFI / OBV / Stochastic / OsMA). For test, you can download the Limited edition of the indicator which is free and works on EURAUD.   Contact me after the purchase to send you the guide file and add you inn "RSI Divergence Group", share your experiences with other users. Also you can download the >>>  Hybrid Trading EA  <<< that is designed and implemented based on RSI Divergence Indicator. RSI is a pretty useful indicator in itself bu
39 USD
Cycle Sniper
Elmira Memish
4.63 (30)
NEW YEAR SALE PRICE FOR LIMITED TIME!!! Please contact us after your purchase and we will send you the complimentary indicators to complete the system. Cycle Sniper is not a holy grail but when you use it in a system which is explained in the videos, you will feel the difference. If you are not willing to focus on the charts designed with Cycle Sniper and other free tools we provide, we recommend not buying this indicator. We recommend watching the videos about the indiactor and system before
200 USD
ICT Template MT4
David Perk
4.89 (9)
ICT Template Indicator visualizes and automatically updates all important ICT elements for Scalpers, Day and Swing traders. It allows you too keep your chart clean and bring any elements by just one click to the buttons. Thanks to  mobile notifications on external liquidity levels, you will not miss any opportunity and you don't have to sit behind the screens whole day. Each element has fully customizable colours, width, line types, max timeframe to be shown etc... so you can really tweak your c
39 USD
TrendLine PRO MT4
Evgenii Aksenov
4.88 (249)
The Trend Line PRO indicator is an independent trading strategy. It shows the trend change, the entry point to the transaction, as well as automatically calculates three levels of Take Profit and Stop Loss protection Trend Line PRO is perfect for all Meta Trader symbols: currencies, metals, cryptocurrencies, stocks and indices Advantages of Trend Line PRO Never redraws its signals The possibility of using it as an independent strategy It has three automatic levels Take Profit and Stop Loss leve
75 USD
Dieses Dashboard ist ein Warntool zur Verwendung mit dem Indikator für die Umkehrung der Marktstruktur. Sein Hauptzweck besteht darin, Sie auf Umkehrmöglichkeiten in bestimmten Zeitrahmen und auch auf die erneuten Tests der Warnungen (Bestätigung) aufmerksam zu machen, wie es der Indikator tut. Das Dashboard ist so konzipiert, dass es auf einem eigenen Chart sitzt und im Hintergrund arbeitet, um Ihnen Benachrichtigungen zu Ihren ausgewählten Paaren und Zeitrahmen zu senden. Es wurde entwickelt,
49 USD
Please send me Direct message on MQL5 CHAT after purchasing the Indicator for Training and Installation Support There are some additional files that is important to use with the Indicator . So be sure to contact me after purchasing the Indicator So that I can add you for training and support . If you find any difficulty with installation then send me Direct message here So that I can connect with you via Anydesk or Teamview for the product installation. " Smart Order Block Indicator " to find
249 USD
Weitere Produkte dieses Autors
Das Skript basiert auf der Simulation von Handelsgeschäften mit einem Zufallsgenerator. Auf diese Weise erhalten Sie auch bei gleichen Eingabeparametern völlig unterschiedliche Ergebnisse. Wenn Sie das Skript ausführen, wird ein Dialogfeld geöffnet, in dem Sie die gewünschten Werte für externe Variablen festlegen können. Im Block  TradingOptions  werden die grundlegenden Parameter definiert, die zur Simulation des Handels benötigt werden. StartBalance  - legt die Anfangsgröße der Handelsbilanz
FREE
Das Skript basiert auf der Simulation von Handelsgeschäften mit einem Zufallsgenerator. Auf diese Weise erhalten Sie auch bei gleichen Eingabeparametern völlig unterschiedliche Ergebnisse. Wenn Sie das Skript ausführen, wird ein Dialogfeld geöffnet, in dem Sie die gewünschten Werte für externe Variablen festlegen können. Im Block TradingOptions werden die grundlegenden Parameter definiert, die zur Simulation des Handels benötigt werden. StartBalance - legt die Anfangsgröße der Handelsbilanz fes
FREE
This script allows selecting the TakeProfit and StopLoss levels. It analyzes the history data, and then calculates the probability of reaching a given price level. How the script works Suppose you have a trading strategy and you want to select the TakeProfit and StopLoss levels. Run the script and set the parameter: Number of Bars - the average position holding time in bars. Once the script operation is complete, the AIS-PPL.csv file will be created in the Files folder in the terminal data cat
FREE
Die Auswahl der StopLoss- und TakeProfit-Stufen kann sich sehr stark auf die Gesamtperformance des Handels auswirken. Neben den offensichtlichen Parametern einer Transaktion - der Größe eines möglichen Gewinns oder wahrscheinlichen Verlusts - wirken sich die StopLoss- und TakeProfit-Werte auch auf die erwartete Dauer der Transaktion und die Rentabilität des Handels im Allgemeinen aus. Wenn Sie die optimale Transaktionsdauer bereits mithilfe des „ AIS-ODT “ -Skripts ermittelt haben, können Sie mi
FREE
MinDeposit
Aleksej Poljakov
5 (1)
The script analyzes the history of quotes and gives recommendations on the minimum deposit. The calculations take into account the variability of prices and the standard deviation. Margin requirements for the instrument are also taken into account. The result of the script is the minimum recommended deposit for trading the given currency pair.
FREE
Dieses Skript ist so konzipiert, dass der Händler die durchschnittliche Dauer von Handelsgeschäften bestimmen kann, bei der das Verhältnis von möglichen Gewinnen und Verlusten optimal ist. Betrachten wir zunächst den allgemeinen Ansatz zur Bestimmung der optimalen Dauer von Handelsgeschäften. Wir führen die folgenden Variablen ein: R  - das Ergebnis der Transaktion; T  - die Zeit, während der die Transaktion offen war; W  - Die Zeit zwischen dem Abschluss der vorherigen und dem Öffnen der nächst
FREE
MinDeposit MT5
Aleksej Poljakov
3 (1)
The script analyzes the history of quotes and gives recommendations on the minimum deposit. The calculations take into account the variability of prices and the standard deviation. Margin requirements for the instrument are also taken into account. The result of the script is the minimum recommended deposit for trading the given currency pair.
FREE
The script allows selecting the required 'Filter level' value of the AIS-MTF MT5 indicator. Run the script on the required chart and selected timeframe. Once its operation is complete, the HPS.csv file will be created in the Files folder. Open the file. You will see three columns. The 'Filter lvl' column represents the value of the 'Filter level' for the AIS-MTF indicator. Am. dev. - degree and direction of the indicator's deviation from the price level (sorted in ascending order). Negative valu
FREE
Dieses Skript ist so konzipiert, dass der Händler die durchschnittliche Dauer von Handelsgeschäften bestimmen kann, bei der das Verhältnis von möglichen Gewinnen und Verlusten optimal ist. Betrachten wir zunächst den allgemeinen Ansatz zur Bestimmung der optimalen Dauer von Handelsgeschäften. Wir führen die folgenden Variablen ein: R - das Ergebnis der Transaktion; T - die Zeit, während der die Transaktion offen war; W - Die Zeit zwischen dem Abschluss der vorherigen und dem Öffnen der nächsten
FREE
This script allows selecting the TakeProfit and StopLoss levels. It analyzes the history data, and then calculates the probability of reaching a given price level. How the script works Suppose you have a trading strategy and you want to select the TakeProfit and StopLoss levels. Run the script and set the parameter: Number of Bars - the average position holding time in bars. Once the script operation is complete, the AIS-PPL.csv file will be created in the Files folder in the terminal data cat
FREE
Die Auswahl der StopLoss- und TakeProfit-Stufen kann sich sehr stark auf die Gesamtperformance des Handels auswirken. Neben den offensichtlichen Parametern einer Transaktion - der Größe eines möglichen Gewinns oder wahrscheinlichen Verlusts - wirken sich die StopLoss- und TakeProfit-Werte auch auf die erwartete Dauer der Transaktion und die Rentabilität des Handels im Allgemeinen aus. Wenn Sie die optimale Transaktionsdauer bereits mithilfe des „ AIS-ODT “ -Skripts ermittelt haben, können Sie mi
FREE
The script allows selecting the required 'Filter level' value of the AIS-MTF indicator. Run the script on the required chart and selected timeframe. Once its operation is complete, the HPS.csv file will be created in the Files folder. Open the file. You will see three columns. The 'Filter lvl' column represents the value of the 'Filter level' for the AIS-MTF indicator. Am. dev. - degree and direction of the indicator's deviation from the price level (sorted in ascending order). Negative values i
FREE
Mit dem Indikator AIS Correct Averages können Sie den Beginn einer Trendbewegung auf dem Markt festlegen. Eine weitere wichtige Eigenschaft des Indikators ist ein klares Signal für das Ende des Trends. Der Indikator wird nicht neu gezeichnet oder neu berechnet. Angezeigte Werte h_AE - Obergrenze des AE-Kanals l_AE - untere Grenze des AE-Kanals h_EC - Hoher vorhergesagter Wert für den aktuellen Balken l_EC - Niedriger vorhergesagter Wert für den aktuellen Balken Signale beim Arbeiten m
30 USD
Der Indikator AIS Weighted Moving Average berechnet einen gewichteten gleitenden Durchschnitt und ermöglicht es Ihnen, den Beginn einer Trendmarktbewegung zu bestimmen. Die Gewichtskoeffizienten werden unter Berücksichtigung der Besonderheiten jedes Barrens berechnet. Auf diese Weise können Sie zufällige Marktbewegungen herausfiltern. Das Hauptsignal, das den Beginn eines Trends bestätigt, ist eine Richtungsänderung der Indikatorlinien und der Preis, der die Indikatorlinien kreuzt. WH (bl
30 USD
Der AIS Advanced Grade Machbarkeitsindikator soll die Niveaus vorhersagen, die der Preis in der Zukunft erreichen könnte. Seine Aufgabe ist es, die letzten drei Balken zu analysieren und darauf basierend eine Prognose zu erstellen. Der Indikator kann für jeden Zeitrahmen und jedes Währungspaar verwendet werden. Mit Hilfe von Einstellungen erreichen Sie die gewünschte Qualität der Prognose. Vorhersagetiefe - legt die gewünschte Vorhersagetiefe in Balken fest. Es wird empfohlen, diesen Paramete
30 USD
The indicator is designed to measure the price volatility. This allows determining the moments for opening or closing trade positions more accurately. High intensity of the market indicates the instability of its movement, but allows for better results. And, conversely, low intensity of the market indicates the stability of its movement. Parameters Bars to process - the number of bars to measure the price movements. A low value of this parameter allows determining the moments of rapid price mo
30 USD
This indicator uses the Fibonacci p-numbers to smooth a price series. This allows combining the advantages of the simple and exponential moving averages. The smoothing coefficients depend on the level of the p-number, which is set in the indicator parameters. The higher the level, the greater the influence of the simple moving average and the less significant the exponential moving average. Parameters Fibonacci Numbers Order - order of the Fibonacci p-number, specified by trader. Valid values
30 USD
The indicator is based on the analysis of interaction of two filters. The first filter is the popular Moving Average. It helps to identify linear price movements and to smooth minor price fluctuations. The second filter is the Sliding Median. It is a non-linear filter. It allows to filter out noise and single spikes in the price movement. A predictive filter implemented in this indicator is based on the difference between these filters. The indicator is trained during operation and is therefore
30 USD
This indicator studies the price action as a combination of micro-trends. All micro-trends are analyzed and averaged. Price movement is filtered based on this averaging. IP_High and IP_Low (blue and red dashed lines) show the instantaneous price movement. They display the forecast only for the current price values, taking into account only the number of bars defined by the 'Filter level' parameter. SP_High and SP_Low (blue and red solid lines) smooth the price movements with respect to history.
30 USD
Dieser Indikator implementiert einen einfachen linearen Glättungsprozess. Einer der Nachteile der exponentiellen Glättung ist das schnelle Abklingen des Signals. Dies macht es unmöglich, langfristige Trends in der Preisspanne vollständig zu verfolgen. Mit der linearen Glättung können Sie die Signalfilterung genauer und feiner einstellen. Der Indikator wird durch Auswahl von Parametern konfiguriert: LP - Mit diesem Parameter können Sie die Glättungszeit auswählen. Je größer sein Wert, dest
30 USD
Dieser Indikator ist ein sequenzieller Hybridfilter, der auf einer Kombination von Median- und Gleitmittelwert-Eigenschaften basiert. Durch die Verwendung des Medianwerts können abnormale Ausreißer und zufällige Impulse in den Werten der Preisreihe herausgefiltert werden. Gleichzeitig wirkt sich der Medianfilter nicht auf den Trend der Preisbewegung aus und lässt ihn unverändert. Da der Medianfilter nichtlinear ist, werden die Werte mit einem einfachen gleitenden Durchschnitt gemittelt. Diese
30 USD
Dieser Indikator ist eine Kombination aus zwei modifizierten Lanczos-Filtern. Der erste Filter dient zur Extrapolation des Preises. Auf der Grundlage vergangener Werte prognostiziert er eine mögliche Kursbewegung innerhalb der aktuellen Bar. Das heißt, es zeigt, was der Preis wäre, wenn die Trends der Vergangenheit unverändert blieben. Der zweite Filter zum Glätten und Mitteln der Preise innerhalb des Fensters, bestimmt durch den Filterpegel. Durch die Auswahl der Gewichte reagiert dieser Filter
30 USD
Betrachten wir die Art der Preisänderungen auf dem Forex-Markt, ohne auf die Gründe zu achten, warum diese Änderungen auftreten. Mit diesem Ansatz können wir die Hauptfaktoren identifizieren, die die Preisbewegung beeinflussen. Nehmen wir zum Beispiel die Eröffnungskurse von Barren für das Währungspaar EUR-USD und den Zeitraum für das erste Halbjahr. Für diese Preise konstruieren wir das Lameray-Diagramm (Abbildung 1). In diesem Diagramm ist ersichtlich, dass die Preisbewegung grundsätzlich nach
30 USD
Dieser Indikator ist informativer. Seine Arbeit basiert auf der Annahme, dass die Preisbewegung auf dem Markt als Rauschen einer bestimmten Farbe dargestellt werden kann, das von den Parametern der Verteilung der Preiswerte abhängt. Dadurch ist es möglich, die Preisänderung aus verschiedenen Blickwinkeln zu analysieren und die Preisbewegung als Rauschen einer bestimmten Farbe zu betrachten, Informationen über den aktuellen Stand des Marktes zu erhalten und eine Prognose über das Preisverhalten
30 USD
Trotz einiger Nachteile des Indikators „ AIS Color Noise Filter “ erscheint die Idee, ihn zur Glättung der Preisreihen und der prognostizierten Preise zu verwenden, recht attraktiv. Dies hat mehrere Gründe: Erstens ermöglicht die Berücksichtigung mehrerer Lärmkomponenten die Erstellung einer Prognose auf Grundlage voneinander unabhängiger Faktoren, wodurch die Prognosequalität verbessert werden kann. zweitens verhalten sich die Rauschmerkmale der Preisreihen über die gesamte Historie hinweg rec
30 USD
Sehr häufig werden bei der Untersuchung von Finanzreihen deren Glättungen angewendet. Mit der Glättung können Sie hochfrequente Komponenten entfernen - es wird angenommen, dass sie durch zufällige Faktoren verursacht werden und daher irrelevant sind. Die Glättung beinhaltet immer eine Art der Mittelung der Daten, bei der sich zufällige Änderungen in den Zeitreihen gegenseitig absorbieren. Zu diesem Zweck werden meist einfache oder gewichtete gleitende Durchschnittsmethoden sowie eine exponentie
30 USD
Um langfristige und nicht zufällige Komponenten zu isolieren, muss nicht nur bekannt sein, um wie viel sich der Preis geändert hat, sondern auch, wie sich diese Änderungen ereignet haben. Mit anderen Worten - wir interessieren uns nicht nur für die Werte der Preisniveaus, sondern auch für die Reihenfolge, in der sich diese Niveaus gegenseitig ersetzen. Durch diesen Ansatz kann man langfristige und stabile Faktoren finden, die die Preisänderung zu einem bestimmten Zeitpunkt beeinflussen (oder be
30 USD
Eine der leistungsstarken Analysemethoden ist die Modellierung von Finanzreihen mithilfe von Levy-Prozessen. Der Hauptvorteil dieser Prozesse besteht darin, dass mit ihnen eine Vielzahl von Phänomenen modelliert werden kann - von den einfachsten bis zu den komplexesten. Es genügt zu sagen, dass die Idee der fraktalen Preisbewegung auf dem Markt nur ein Sonderfall von Levy-Prozessen ist. Andererseits kann bei richtiger Auswahl der Parameter jeder Levy-Prozess als einfacher gleitender Durchschnit
30 USD
Sehr oft steht der Händler vor der Aufgabe, das Ausmaß zu bestimmen, in dem sich der Preis in naher Zukunft ändern kann. Zu diesem Zweck können Sie die Johnson-Verteilungsart SB verwenden. Der Hauptvorteil dieser Verteilung besteht darin, dass sie auch mit einer kleinen Menge von akkumulierten Daten verwendet werden kann. Der empirische Ansatz zur Bestimmung der Parameter dieser Verteilung ermöglicht es Ihnen, das maximale und minimale Niveau des Preiskanals genau zu bestimmen. Diese Werte könn
30 USD
Mit diesem Indikator können Sie die Wahrscheinlichkeit bestimmen, mit der der Preis das eine oder andere Niveau erreicht. Der Algorithmus ist recht einfach und basiert auf der Verwendung statistischer Daten zum Preisniveau eines bestimmten Währungspaares. Dank der gesammelten historischen Daten ist es möglich, das Ausmaß zu bestimmen, in dem sich der Preis während des aktuellen Balkens ändert. Trotz seiner Einfachheit kann dieser Indikator beim Handel von unschätzbarem Wert sein. Mit seiner Hil
30 USD
Auswahl:
Keine Bewertungen
Antwort auf eine Rezension