Automated Trendlines MT5
- Indikatoren
- Georgios Kalomoiropoulos
- Version: 1.0
- Aktivierungen: 20
Trendlinien sind das wichtigste Werkzeug der technischen Analyse im Devisenhandel. Leider zeichnen die meisten Händler sie nicht richtig. Der automatische Trendlinien-Indikator ist ein professionelles Tool für ernsthafte Trader, das Ihnen hilft, die Trendbewegung der Märkte zu visualisieren.
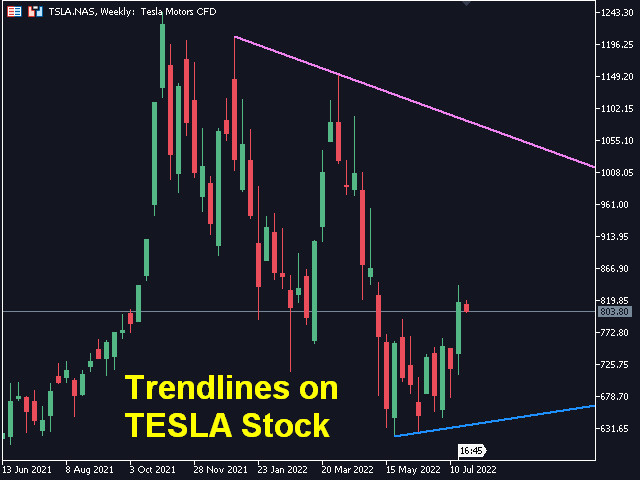
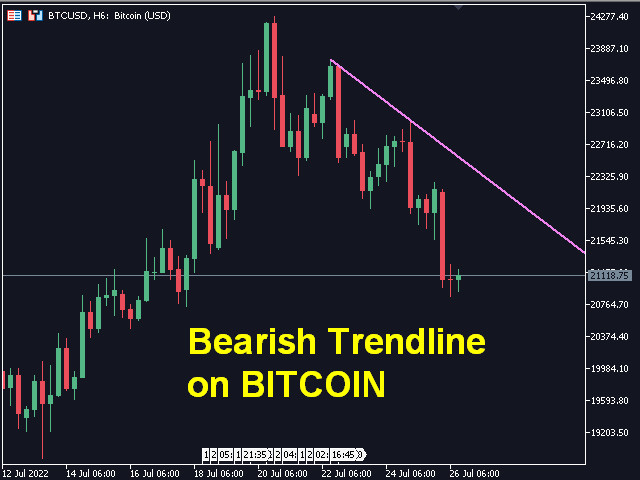
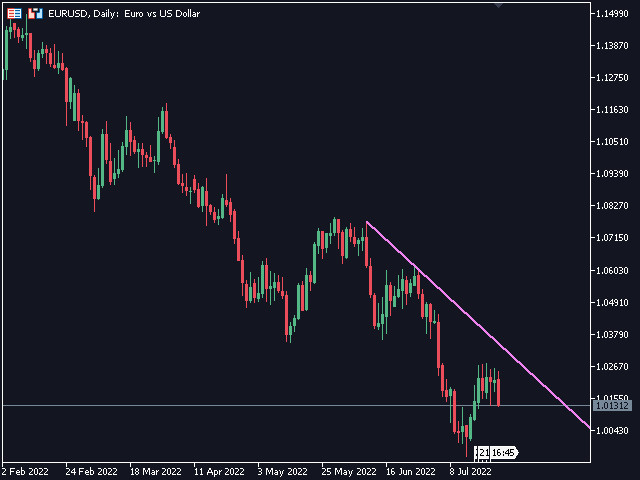
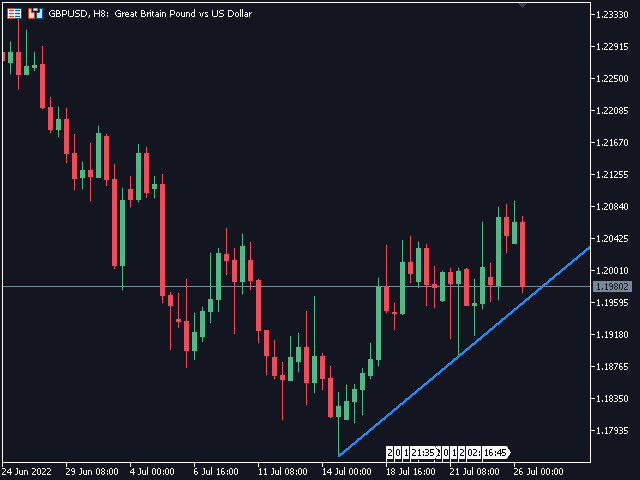
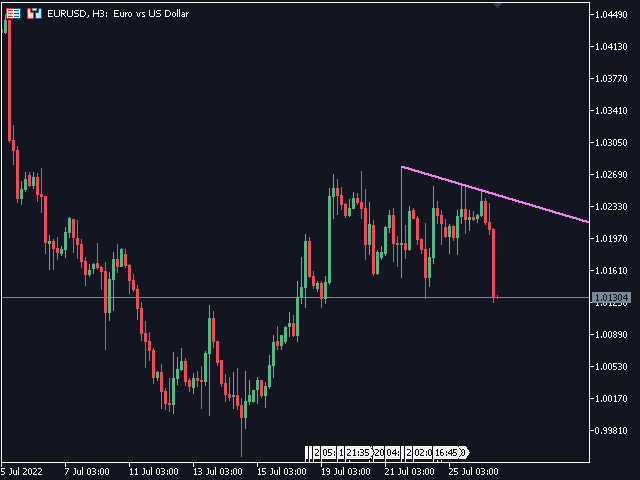
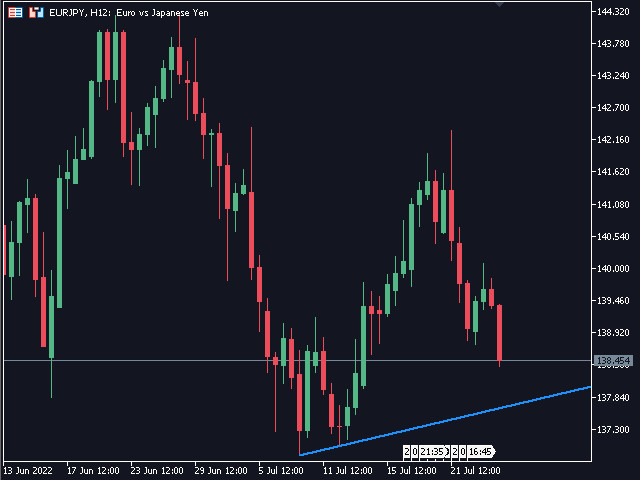
Es gibt zwei Arten von Trendlinien Bullische Trendlinien und Bärische Trendlinien.
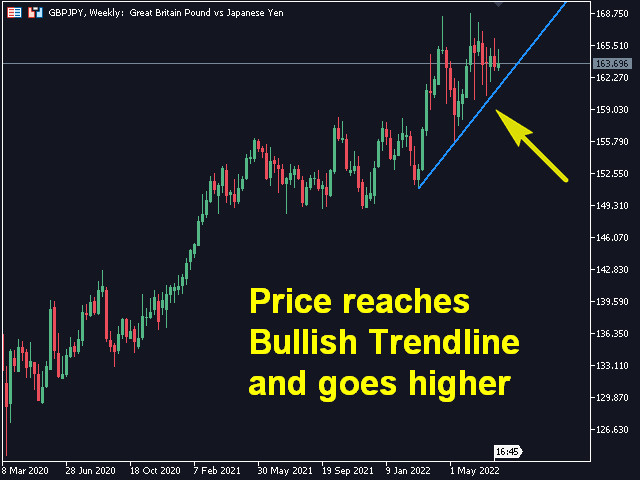
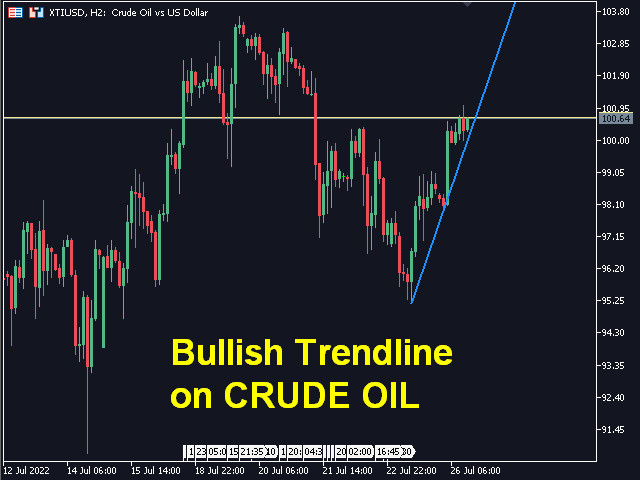
Im Aufwärtstrend wird die Forex-Trendlinie durch die niedrigsten Swing-Punkte der Preisbewegung gezogen.
Wenn man mindestens zwei „tiefste Tiefs“ verbindet, entsteht eine Trendlinie.
Im Abwärtstrend wird die Trendlinie durch die höchsten Swing-Punkte der Preisbewegung gezogen.
Wenn man mindestens zwei „höchste Hochs“ verbindet, entsteht eine Trendlinie.
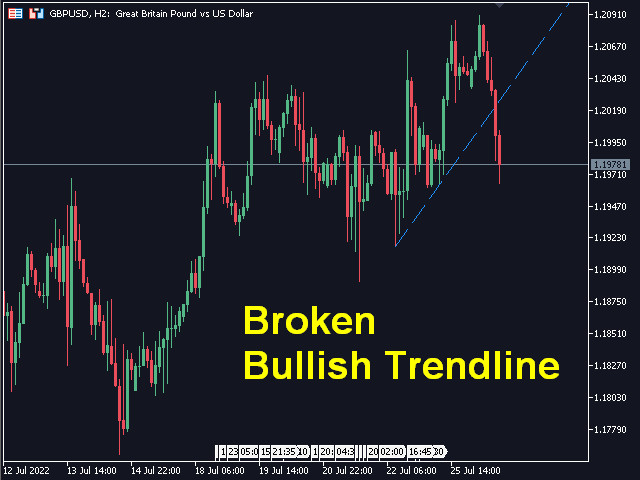
Wann bricht eine Trendlinie?
Eine bullische Trendlinie bricht, wenn eine bärische Kerze unter der bullischen Trendlinie schließt und das Hoch der Kerze über der Trendlinie liegt.
Eine bärische Trendlinie bricht, wenn eine bullische Kerze über der bärischen Trendlinie schließt und das Tief der Kerze unter der Trendlinie liegt.
Wann wird eine Trendlinie gelöscht?
Eine bullische Trendlinie wird gelöscht, wenn sich eine volle Kerze unter der bullischen Trendlinie bildet.
Eine bärische Trendlinie wird gelöscht, wenn sich über der bärischen Trendlinie eine volle Kerze bildet.
Sie können die Farbe und Breite von bullischen und bärischen Trendlinien in den Eingabeparametern ändern.
Es gibt zwei Arten von Trendlinien Bullische Trendlinien und Bärische Trendlinien.
Im Aufwärtstrend wird die Forex-Trendlinie durch die niedrigsten Swing-Punkte der Preisbewegung gezogen.
Wenn man mindestens zwei „tiefste Tiefs“ verbindet, entsteht eine Trendlinie.
Im Abwärtstrend wird die Trendlinie durch die höchsten Swing-Punkte der Preisbewegung gezogen.
Wenn man mindestens zwei „höchste Hochs“ verbindet, entsteht eine Trendlinie.
Wann bricht eine Trendlinie?
Eine bullische Trendlinie bricht, wenn eine bärische Kerze unter der bullischen Trendlinie schließt und das Hoch der Kerze über der Trendlinie liegt.
Eine bärische Trendlinie bricht, wenn eine bullische Kerze über der bärischen Trendlinie schließt und das Tief der Kerze unter der Trendlinie liegt.
Wann wird eine Trendlinie gelöscht?
Eine bullische Trendlinie wird gelöscht, wenn sich eine volle Kerze unter der bullischen Trendlinie bildet.
Eine bärische Trendlinie wird gelöscht, wenn sich über der bärischen Trendlinie eine volle Kerze bildet.
Sie können die Farbe und Breite von bullischen und bärischen Trendlinien in den Eingabeparametern ändern.