Price Action Buy and Sell Signals MT5
- Indikatoren
- Christopher Graham Parish
- Version: 1.1
- Aktualisiert: 17 Oktober 2022
- Aktivierungen: 10
!! FLASH SALE !!
Over 80% off !! For ONE week only.
Now only $47 - normally $297!
>>> Ends on 30 June 2023 - Don't miss it!
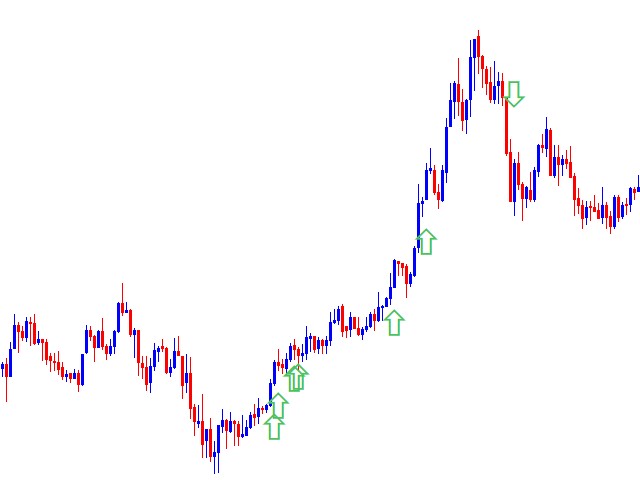
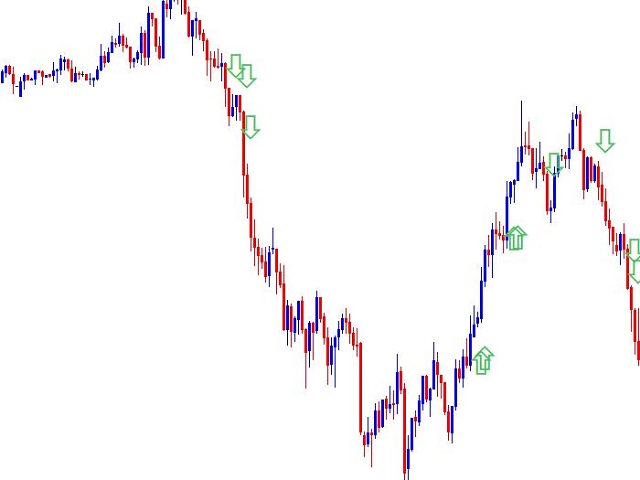
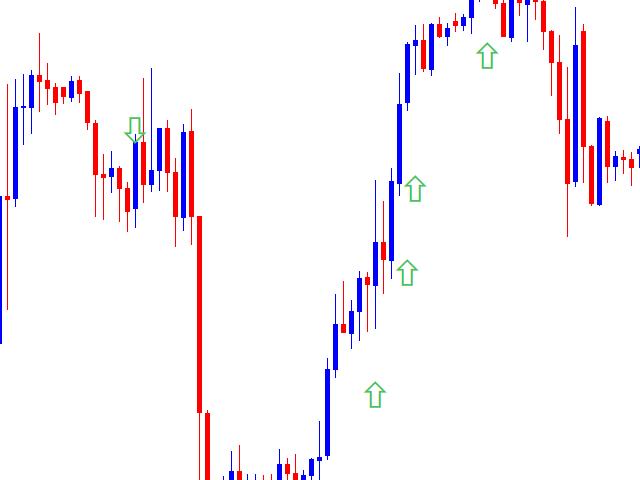
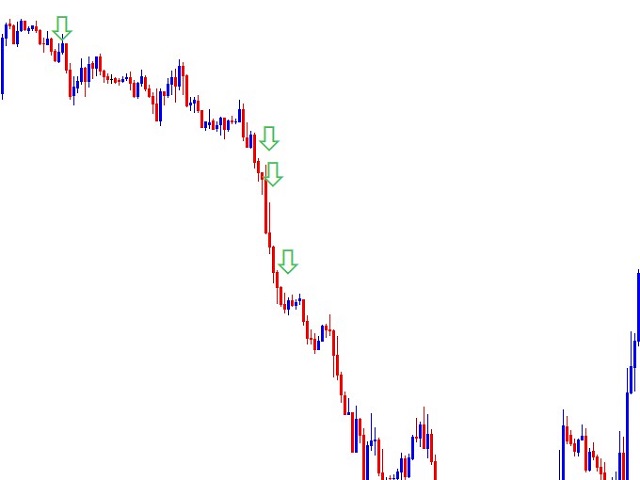
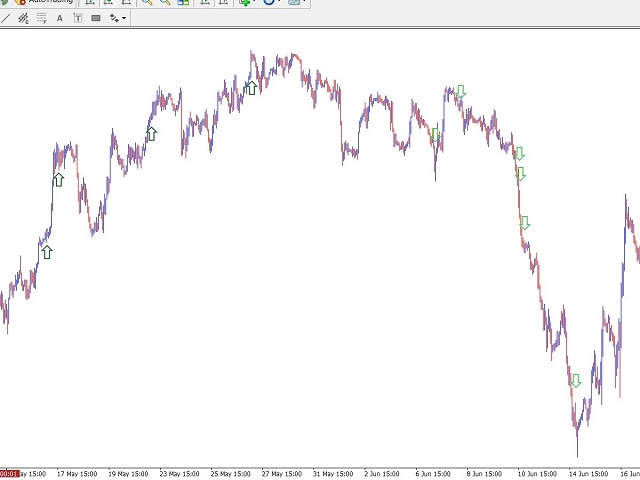
Buy and Sell Arrows On The Chart According To Price Action
Sends Alerts
- On MT5
- To Your Phone
- To You Email
- Does NOT repaint.
- Works on any pair, any timeframe.
- 10 Activations allowed so you are free from limitations.
MT4 Version here.
For spreads from a tiny 0.1 pips RAW/ECN Accounts, click here.
Check out my Waka Esque EA signal here: >> High Risk Settings or Medium Risk Settings.
When you get a signal, all you need to do is check the previous structue highs and lows to use as your stop loss and take profit.
See the video below.
Settings:
Apart from the times you want to get signals and where you want alerts, there is only one setting.
- Signal Strength.
This is set anywhere from 5 to 10.
At 5 you'll get lots of signals but they'll be much less accurate.
At 10 you'll get hardly any signals, but with high accuracy.
For my trading, I normally leave it on 7.5.
Obviously, no indicator can predict all signals correctly all the time – the markets are unpredictable – otherwise we would all be successful all the time.
This is still Forex and you will not win every trade. Practice on Demo before trading with live money and always use good money management.