• Übersicht
  • Bewertungen
  • Diskussion
  • Neue Funktionen

SmartMass MT5

SMARTMASS INDICATOR

This indicator is different from all known volume indicators. It has a significant distinction; it is an algorithm that relates price movement to volume, attempting to find proportionality and efficient movement while filtering out noise and other movements that are more random and do not follow a trend or reversal. Ultimately, it reveals the true strength of the movement, indicating whether it has genuine support from bulls or bears or if it's merely a high-volume movement that explains trading account balancing, a typical occurrence, for example, at the end of a sessions.

It doesn't matter whether we have real volume or tick volume. If the broker is large enough, tick volumes are correlated with real volume. This indcator provides an approximate but reality-adjusted information that assists you in making better decisions, increasing the probability of success.


INPUT PARAMETERS

General Parameters:

Generic data. This data is already optimized for the normal use of the indicator. It is not necessary to modify these values unless in very specific situations or for specific testing.

Chart Options:

Activate or deactivate curves. Color selection.

Impulse Detection:

Activate or deactivate impulse detection. Color selection.
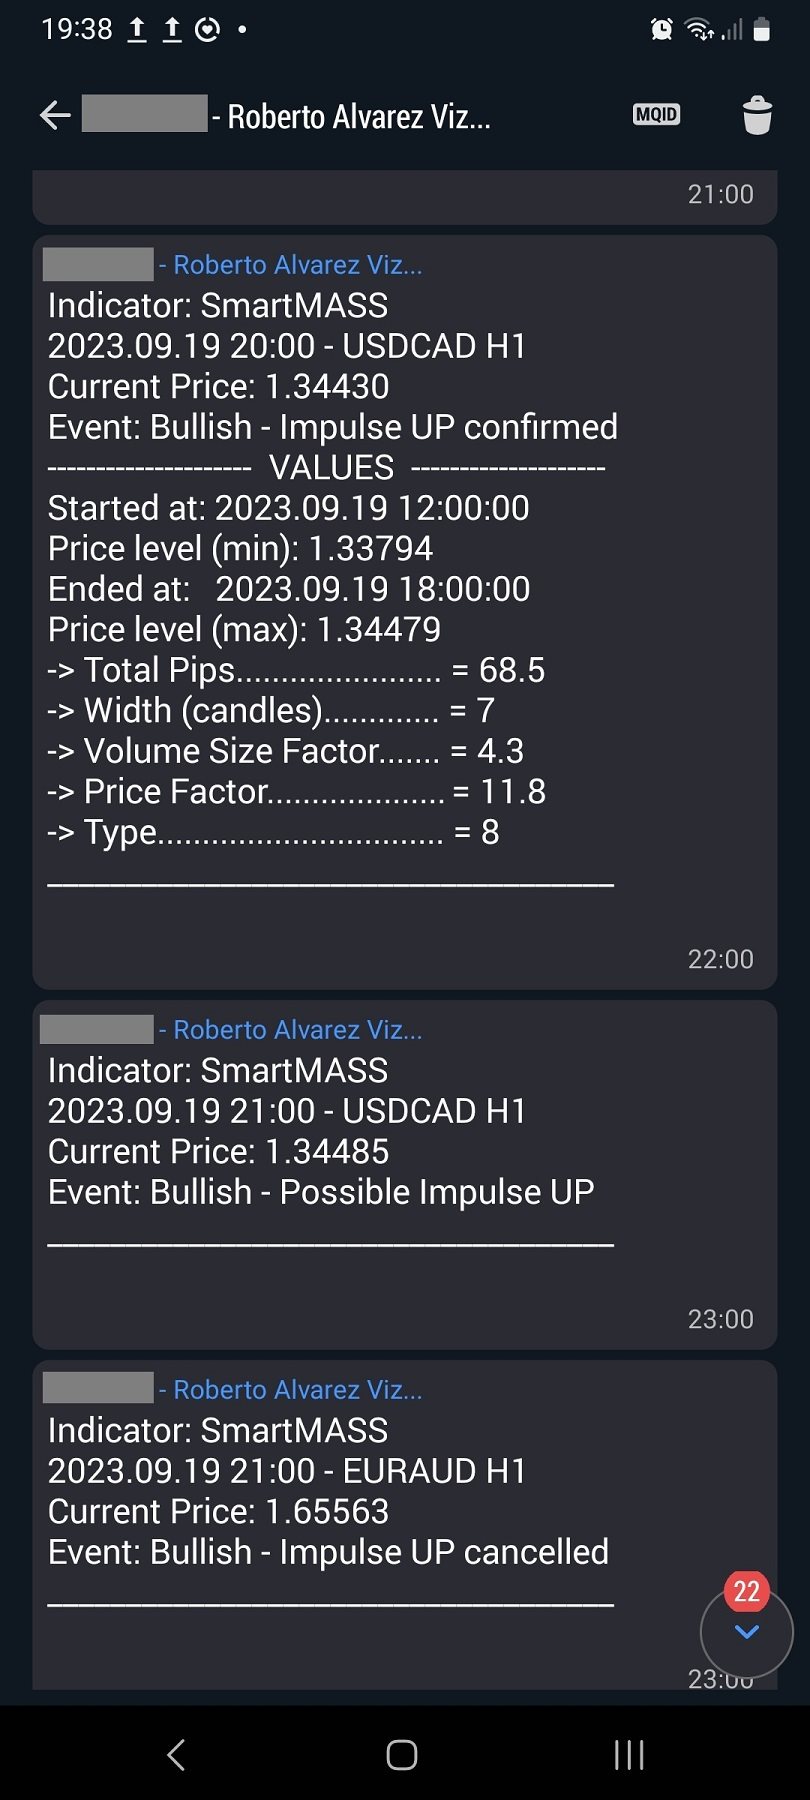
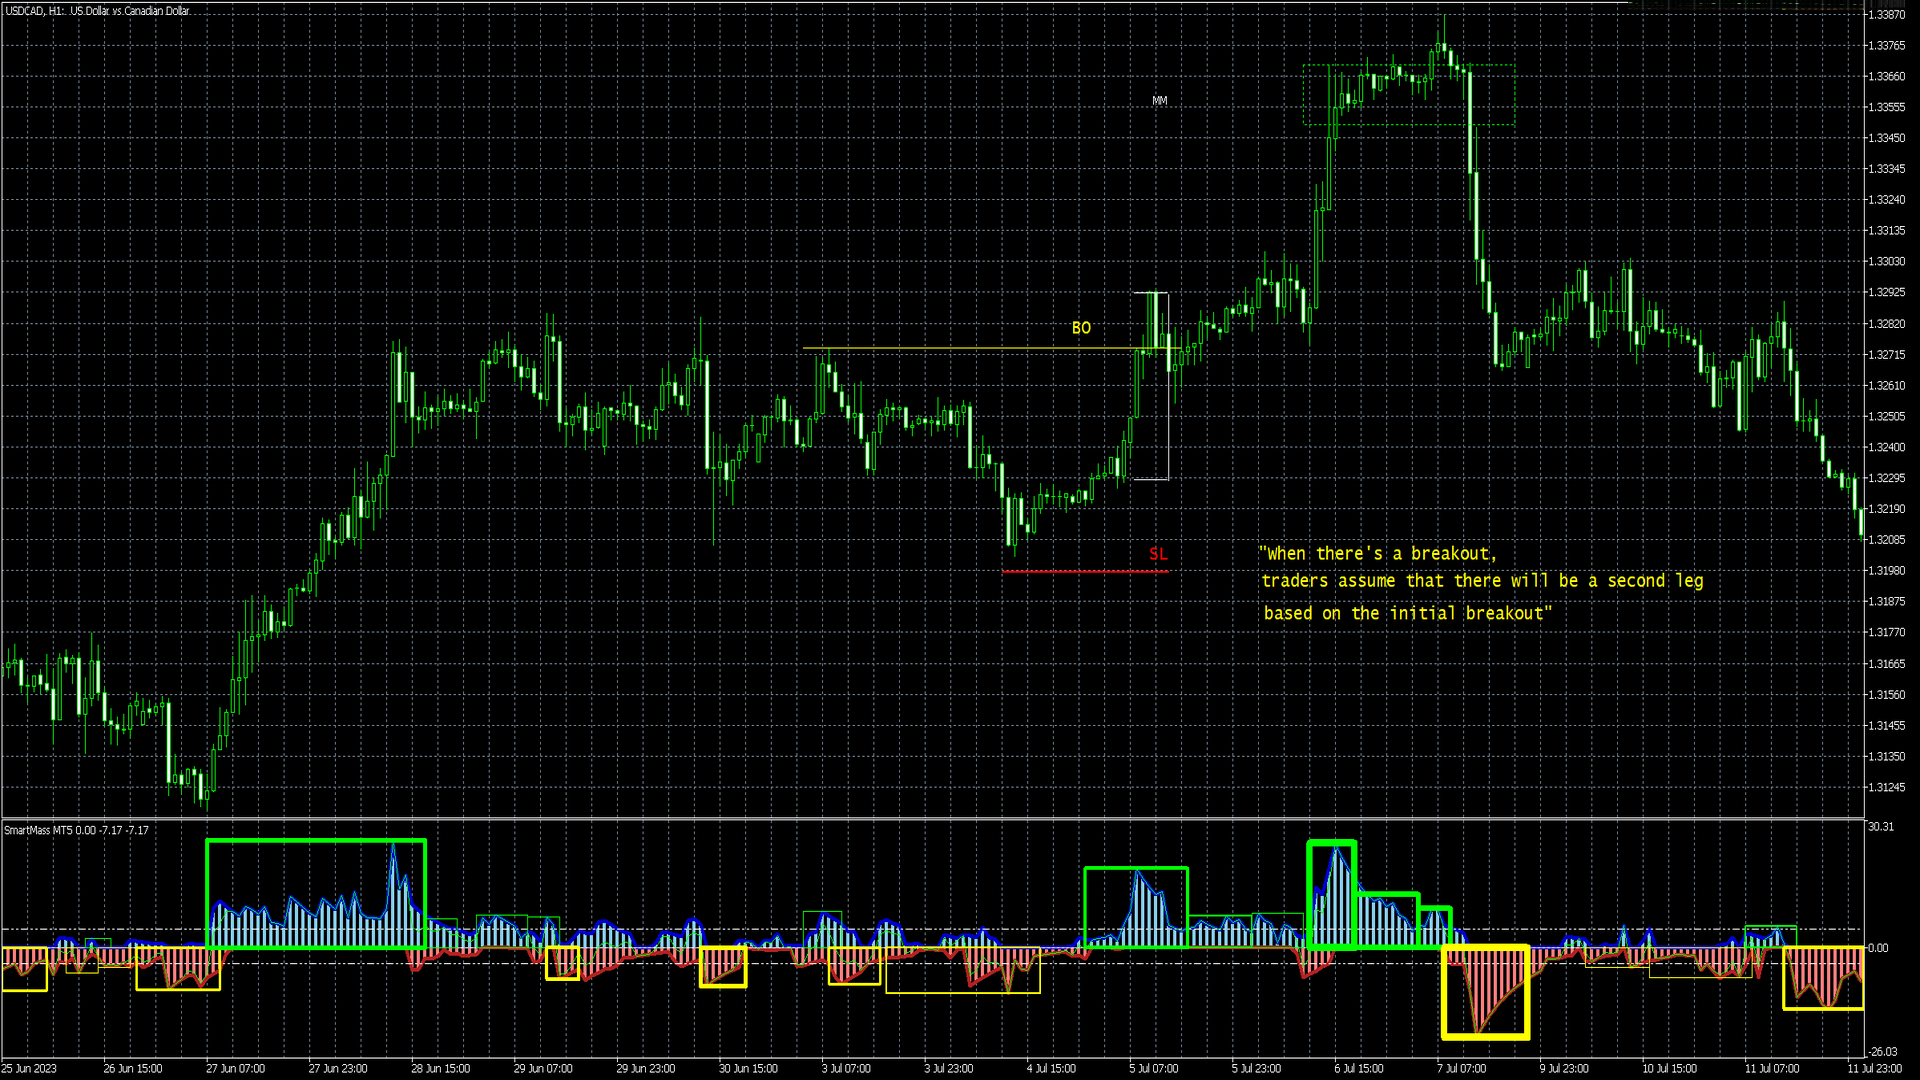
Alerts:

Configure different types of alerts to stay informed about market impulses. These impulses can be breakouts of supports or resistances that, in many cases, precede the continuation of a long-distance movement in the direction of the trend or, conversely, a reversal movement.

Sounds:

Possibility to configure sound alerts.


    HOW CAN THE SMARTMASS INDICATOR HELP US?


    The SmartMass indicator is a tool that assists traders in the following ways:


    1. Detects significant movements where there is a clear intent by bulls or bears: The SmartMass indicator can identify significant market movements in which participants, whether bulls or bears, display a clear intent. This means it can help traders identify moments when a significant change in price direction is occurring, which can be useful for making trading decisions.

    2. Helps to better understand the balance between volume and price: The SmartMass indicator also provides information about the relationship between volume (whether tick volume or trading volume) and price. This is important because most of the time, the market is in a range or channel where prices move sideways. However, strong breakouts or trend changes occur only about 10% of the time. The indicator allows traders to anticipate when the balance between volume and price is tilting one way or the other, enabling them to prepare strategies accordingly. In other words, it helps identify moments when the market may be on the verge of breaking out of its usual range or channel, presenting an opportunity to capitalize on significant price movements.

    3. The SmartMass indicator can be considered a valuable addition to Price Action analysis in trading. Price Action analysis is based on the study of price movements and patterns on the chart, without relying on external technical or fundamental indicators. In this context, the SmartMass indicator can provide additional and objective information that can assist traders in making more precise and informed decisions.


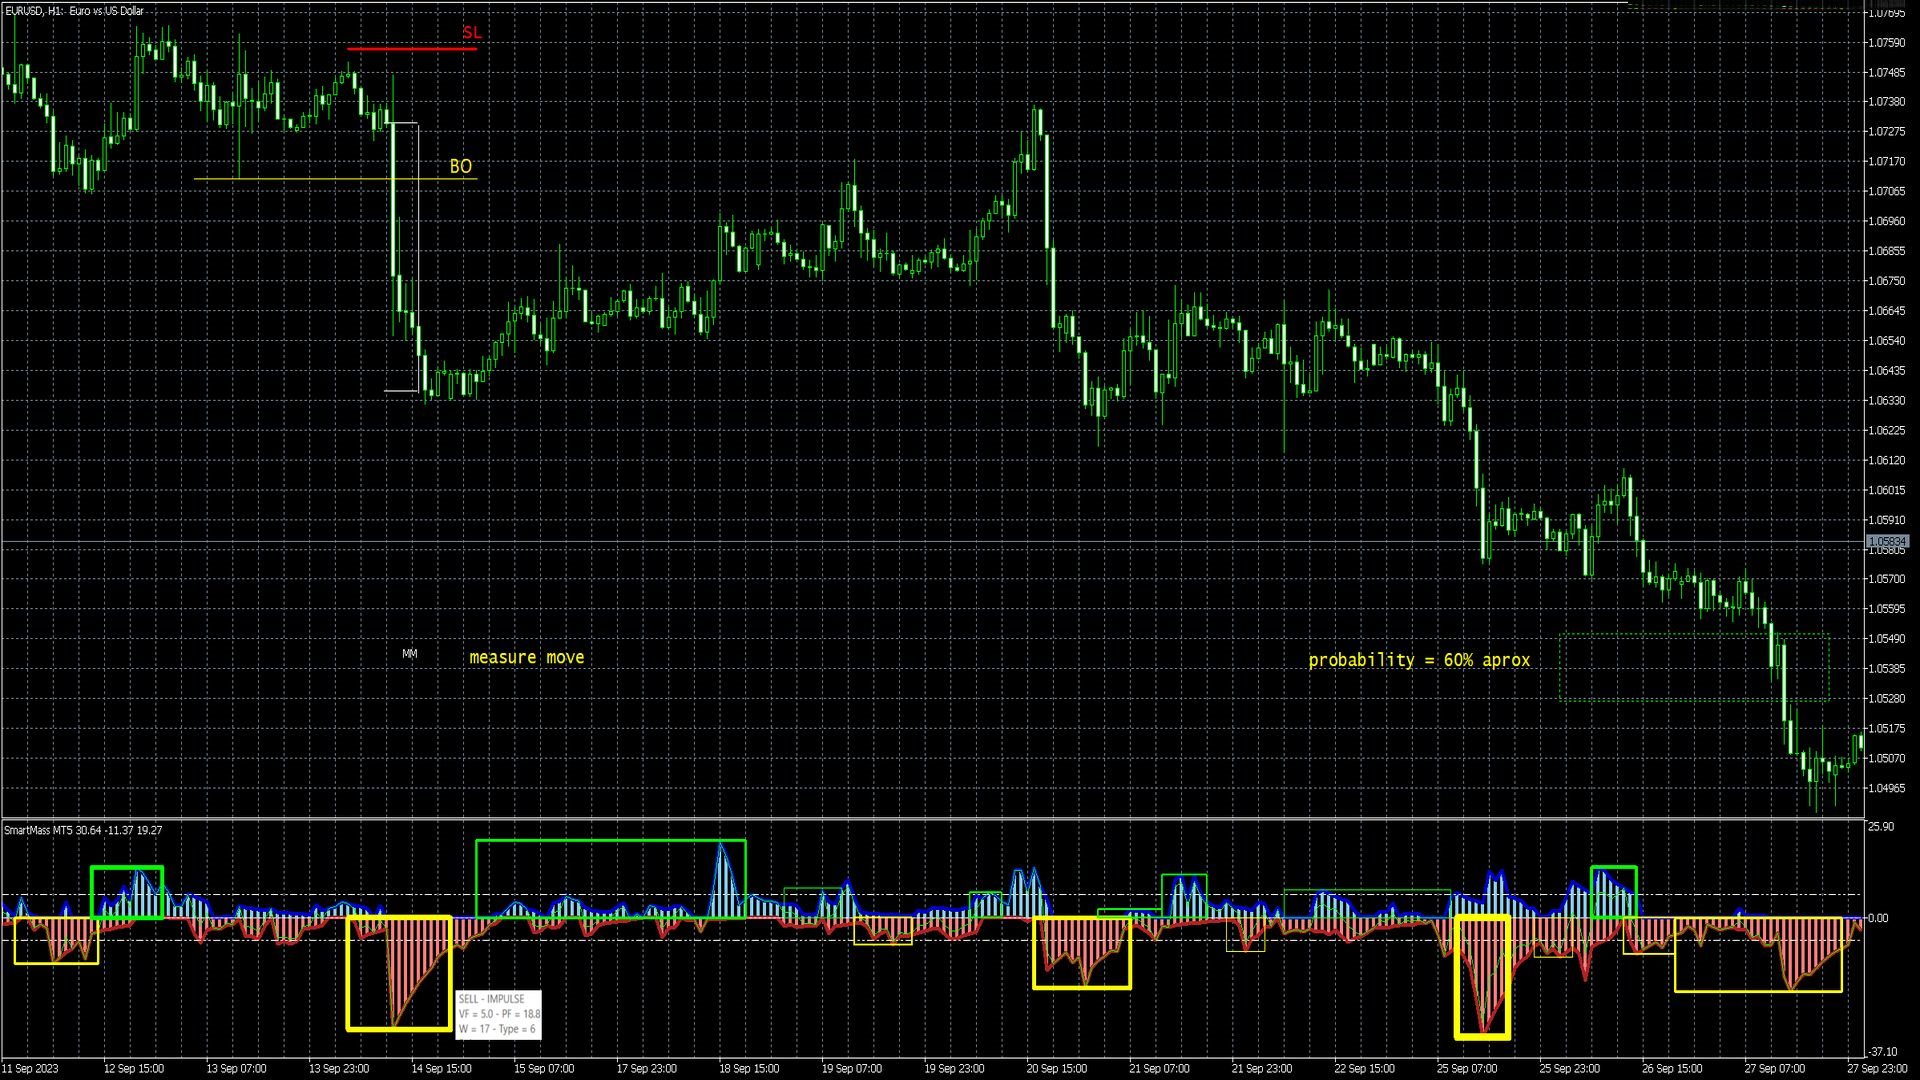
    IMPULSE CONCEPT IN THE SMARTMASS INDICATOR


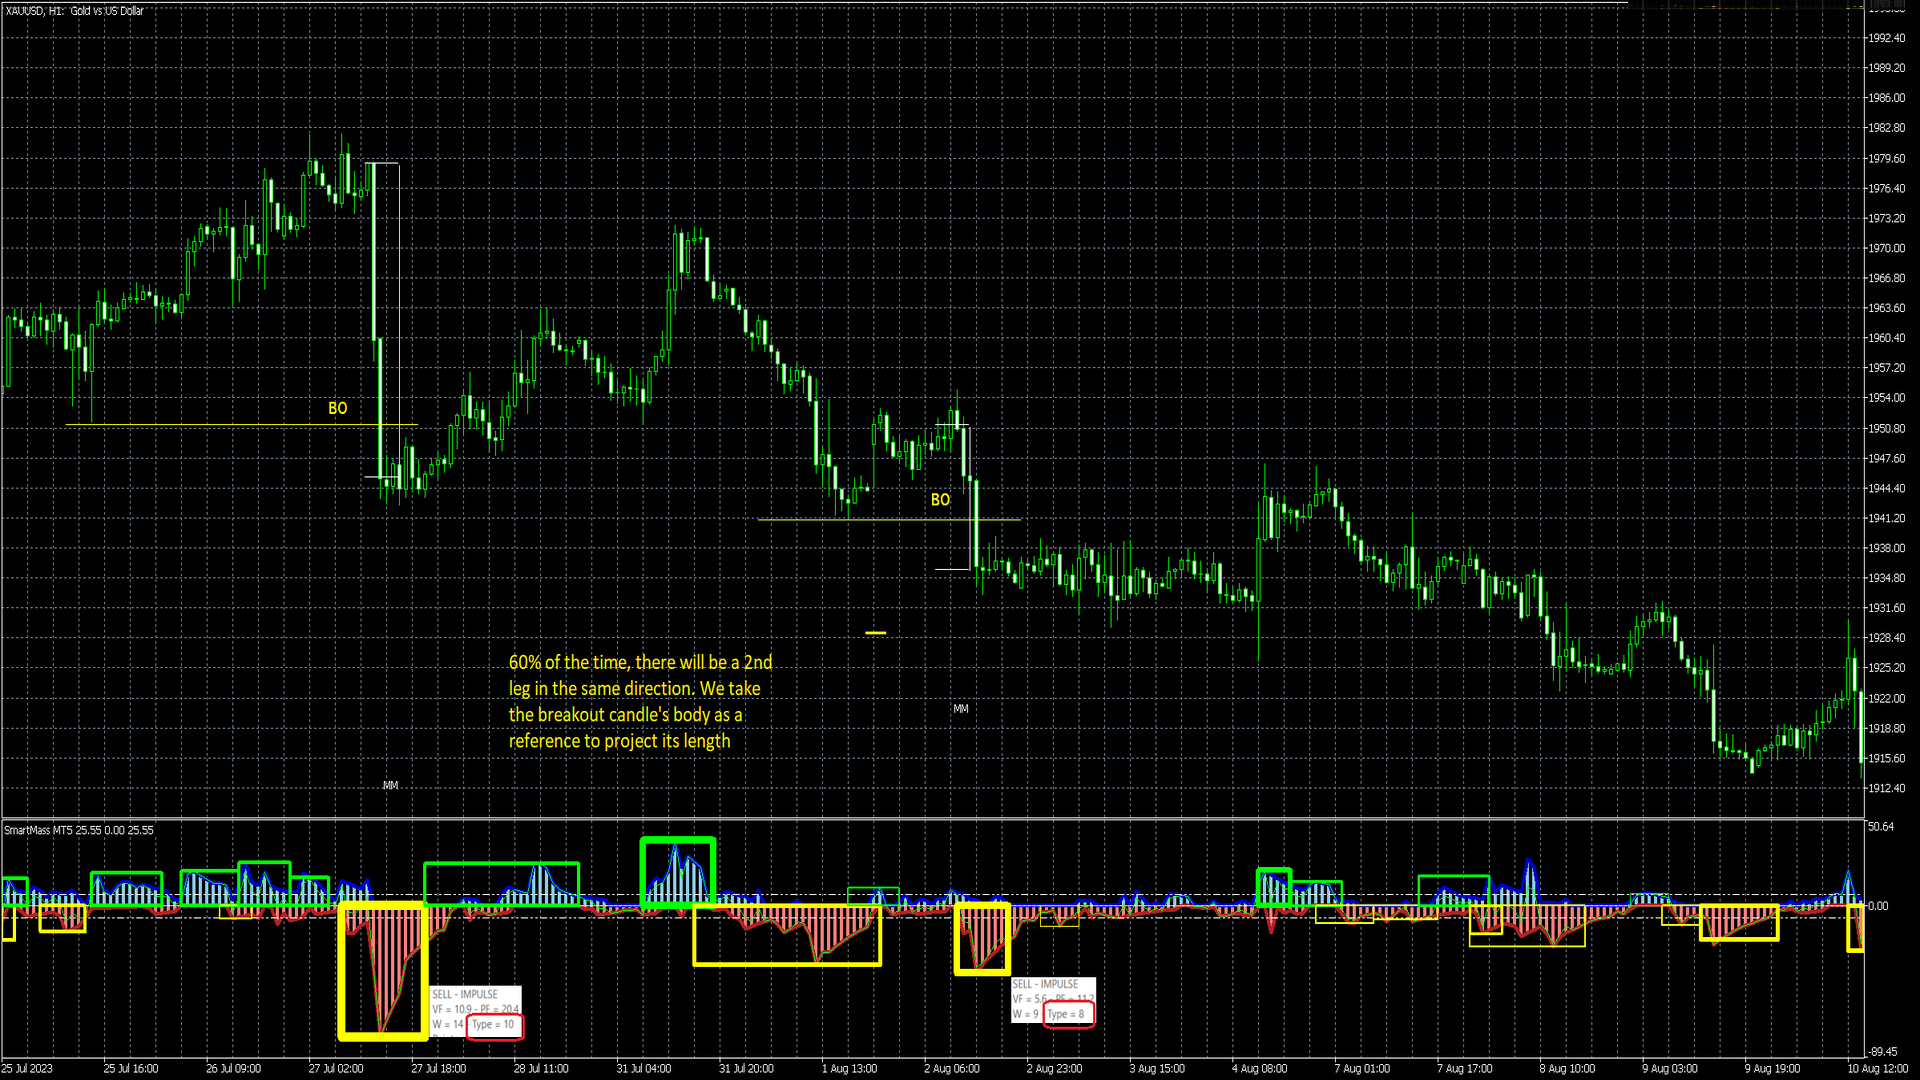
    The SmartMass indicator not only helps in detecting impulses on chart but also categorizes it based on three key parameters: amplitude, width, and price effect. These three parameters are used to assign a numerical value to each momentum, ranging from 1 to 10. Here's how this classification works:


    • Amplitude (VF): Amplitude refers to the magnitude or strength of the momentum. The higher the amplitude, the stronger the momentum. In the context of the SmartMass indicator, it evaluates how much the price changes during the momentum and assigns a numerical value based on that magnitude. Larger momentums will receive a higher score.

    • Width (W): Width refers to the duration of the momentum in terms of time (number of candles). A wider momentum is one that extends over a longer period. The SmartMass indicator assesses how long the momentum lasts and assigns a numerical value based on its duration. Longer-lasting momentums will receive a lower score.

    • Price Effect (PF): This parameter evaluates how the momentum affects the price. For example, a momentum that causes a significant price breakout or a trend change will have a stronger effect on the price than a momentum that only leads to a minor movement. The SmartMass indicator analyzes the impact of the momentum on the price and assigns a numerical value based on its significance in price change. Momentums that have a more notable effect on the price will receive a higher score.

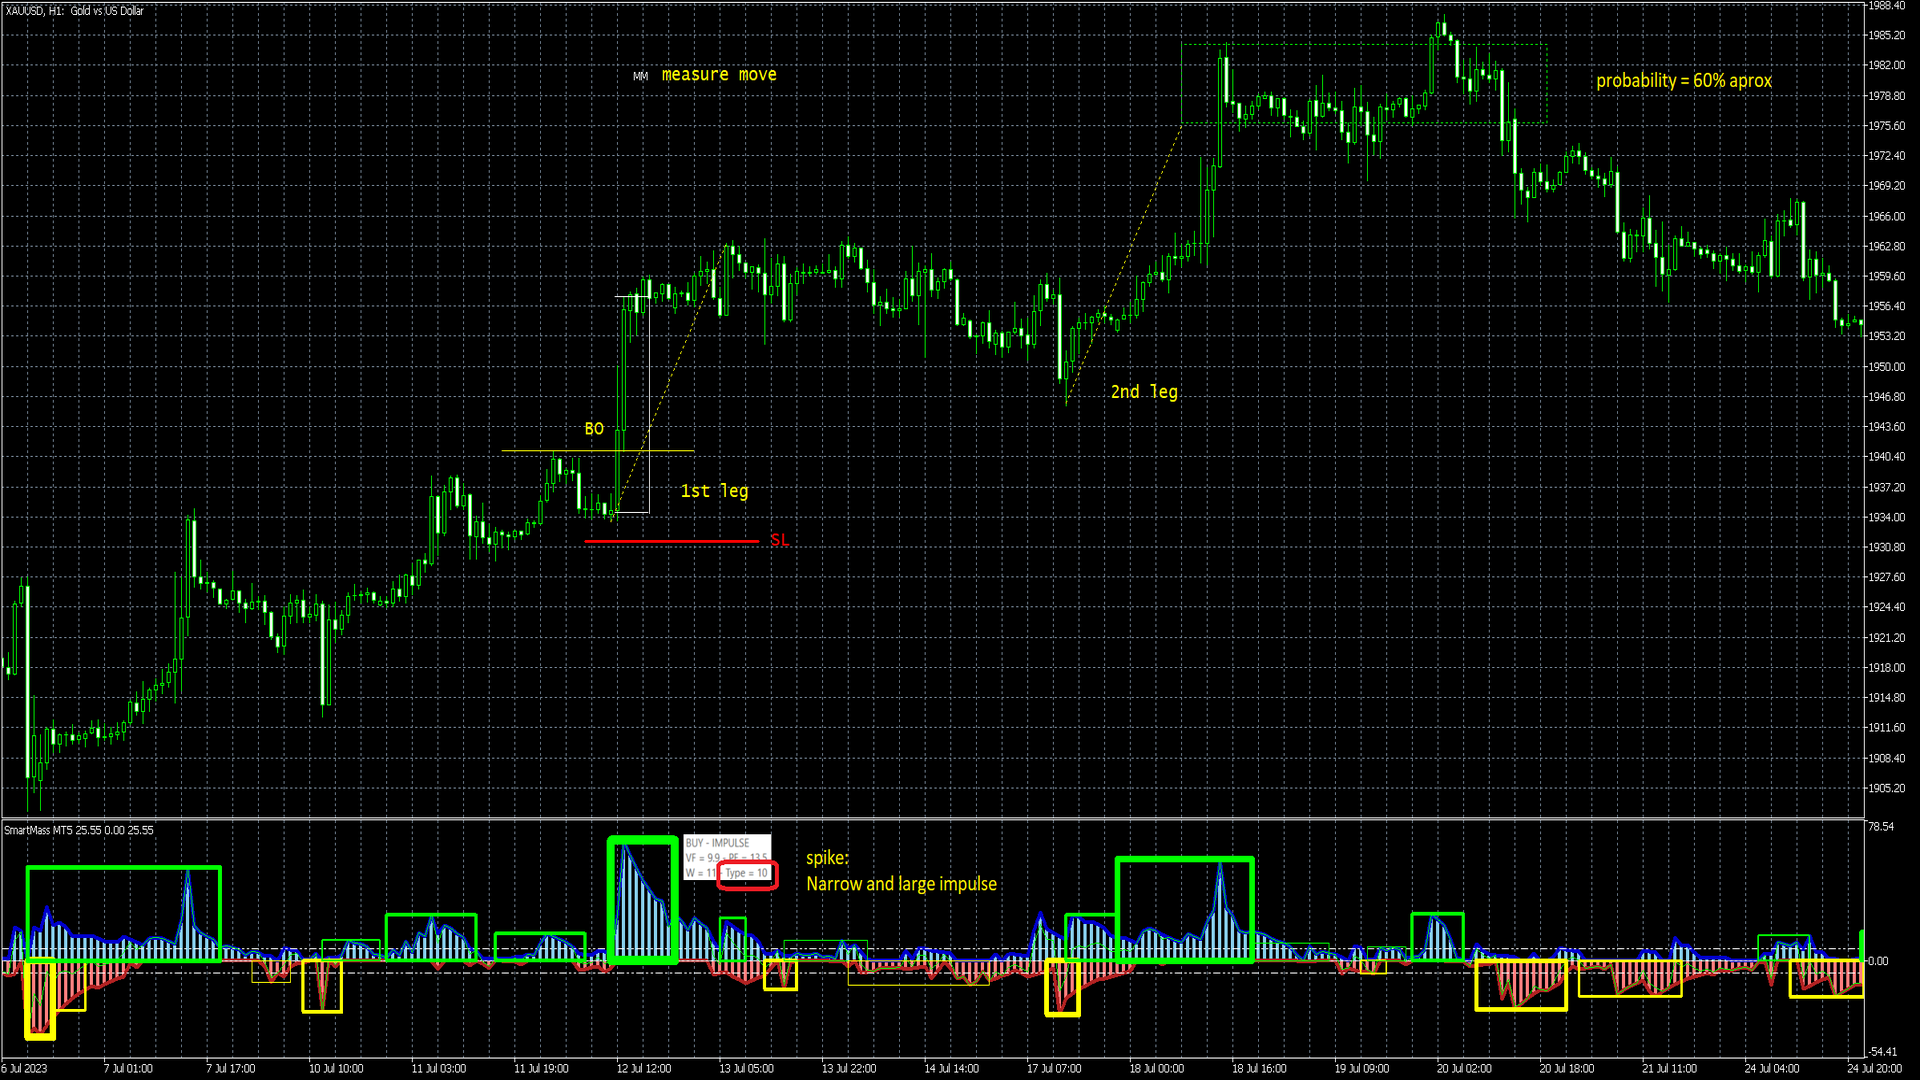
    • Classification (Type): The SmartMass indicator uses these three parameters (amplitude, width, and price effect) to classify momentums on a scale from 1 to 10, where 1 represents weaker and less significant momentums, and 10 represents stronger and more significant momentums in the market.

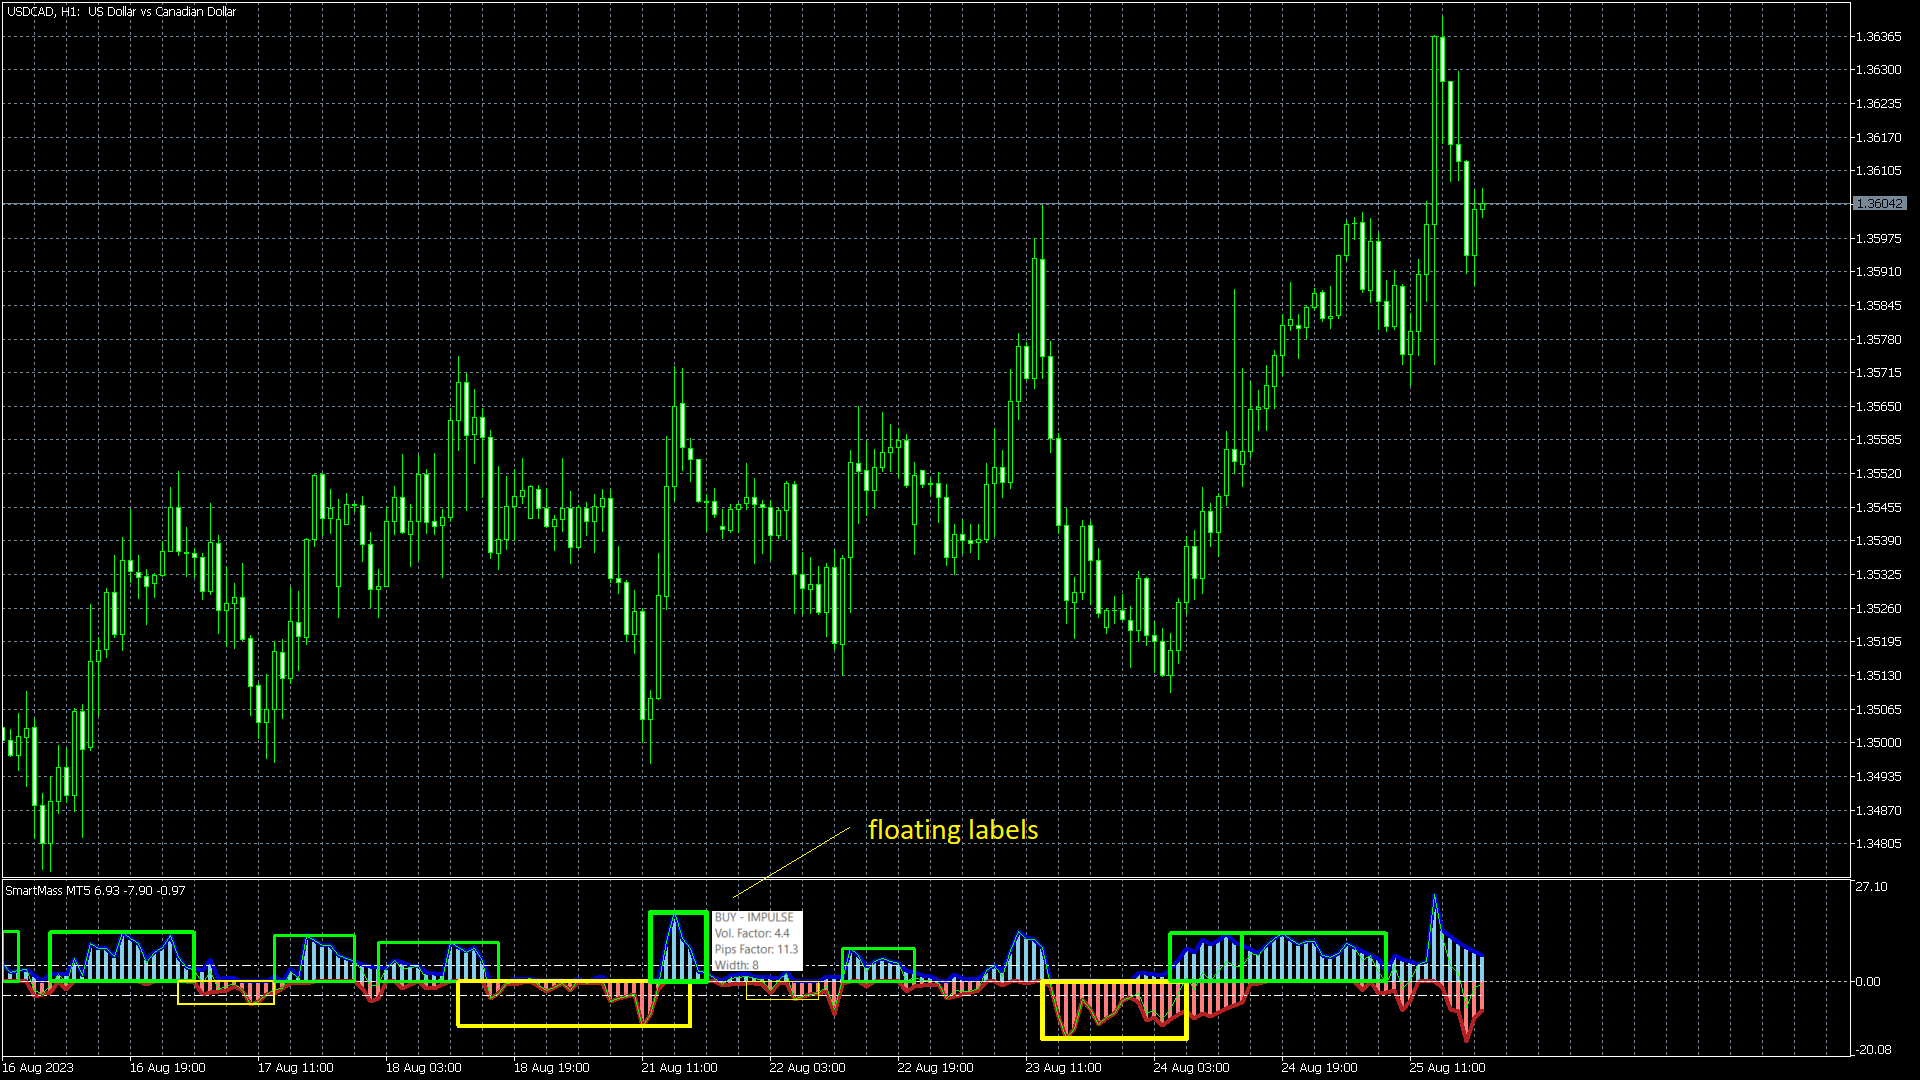
    To view this classification and the different parameters that make up the momentum, simply position the mouse pointer over the rectangle. The information is displayed through a floating label.


    Empfohlene Produkte
    Bar Sequential
    Maximiliano Frisione Figueroa
    This indicator can help you clearly identify trend changes in both bullish and bearish markets. The indicator compares the closing price of the last candle with the closing price of the candle "X" periods ago (input parameter). In an uptrend, an initial number '1' is plotted if a candle closes higher than the closing of a candle "X" periods ago. In a downtrend, an initial number '1' is plotted if a candle closes below the closing of a candle "X" periods ago. Subsequent numbers are plotted when e
    Kill Zones MT5
    Diego Arribas Lopez
    MT4 Version Kill Zones Kill Zones allows you to insert up to 3 time zones in the chart. The visual representation of the Kill Zones in the chart together with an alert and notification system helps you to ignore fake trading setups occurring outside the Kill Zones or specific trading sessions. Using Kill Zones in your trading will help you filter higher probability trading setups. You should select time ranges where   the market   usually reacts with high volatility. Based on   EST time zone, f
    SMA Fibonacci EA
    Christoph Kreher
    Simple EA with 1 SMA and Fibonacci. The Expertadvisor opens positions in the direction of the trend when price levels have exceeded or fallen below the Fibonacci levels. It depends on the market in question and which parameters to use. The EA is programmed in such a way that optimization runs consume little time. A news filter and filter by day of the week are built in.
    Graphic Shapes -using history, it projects four types of graphical shapes at the moment, allowing you to determine the main ranges of price movement in the future, as well as gives an understanding of the main market reversals, while giving entry points by priority!The panel contains three types of figure sizes expressed by timeframes. They allow you to conduct a complete market analysis without using additional tools! The indicator is a powerful tool for forecasting price movements in the forex
    Dieser Multi-Timeframe- und Multi-Symbol-Indikator scannt nach Pin-Bars, Morgen-/Abendsternen, Engulfings, Tweezers, Three Line Strikes, Inside Bars und Wimpel und Dreiecken.   Der Indikator kann auch im Single-Chart-Modus verwendet werden. Bitte lesen Sie mehr über diese Option in den Produktinformationen       bloggen   .       In Kombination mit Ihren eigenen Regeln und Techniken ermöglicht Ihnen dieser Indikator, Ihr eigenes leistungsstarkes System zu erstellen (oder zu verbessern). Merkmale
    Dieser auf künstlicher Intelligenz basierende Indikator identifiziert mögliche Marktumkehrpunkte durch Auslesen des Fußabdrucks und signalisiert im Voraus kleine Marktbewegungen, bevor sie auftreten. Im Gegensatz zu Preis- und Volumenindikatoren, die „späte“ Einträge generieren, d. h. wenn bei einer Richtungsänderung bereits eine Bestätigung des Preises oder Volumens erfolgt ist und die Bewegung daher oft bereits beendet ist, signalisiert dieser Indikator basierend auf dem, was er in der Tabell
    Trend Monitor VZ MT5
    Sergey Ermolov
    5 (1)
    MT4-Version  |   Valable ZigZag-Indikator   |   FAQ Die Elliott-Wellen-Theorie   ist eine Interpretation der Vorgänge auf den Finanzmärkten, die auf dem visuellen Modell der Wellen auf den Kurscharts beruht. Nach dieser Theorie können wir genau wissen, welcher Trend am Markt gerade vorherrscht, aufwärts oder abwärts. Der   Valable ZigZag-Indikator   zeigt die   Wellenstruktur des Marktes   an und gibt die Richtung des aktuellen Haupttrends auf dem aktuellen Zeitrahmen an. Zu Ihrer Bequemlichk
    MetaForecast M5
    Vahidreza Heidar Gholami
    5 (2)
    MetaForecast prognostiziert und visualisiert die Zukunft eines beliebigen Marktes basierend auf den Harmonien in den Preisdaten. Obwohl der Markt nicht immer vorhersehbar ist, kann MetaForecast, wenn es ein Muster im Preis gibt, die Zukunft so genau wie möglich voraussagen. Im Vergleich zu ähnlichen Produkten kann MetaForecast durch die Analyse von Markttrends genauere Ergebnisse erzeugen. Eingabeparameter Past size (Vergangene Größe) Gibt an, wie viele Balken MetaForecast verwendet, um ein Mo
    OutsideBar and InsideBar
    Alexander Josef Zeidler
    Dieser Indikator zeigt OutsideBars (OB) und InsideBars(IB) im Chart in Kerzenform. Die Farben der Kerzen können individuell eingestellt werden. Auch unterschiedliche Farben für bärische und bullische IBs oder OBs sind möglich. Zusätzlich ist auch die Farbe der Dochte bzw. Umrandung einstellbar. OutsideBars und InsideBars zeigen oft gute Zonen für Unterstützung oder Widerstand.
    Signal Eskiya, in addition to channel lines, reflects entry signals in the form of arrows. Trading strategies using the channel indicator belong to the classic methods of technical analysis, are easy to execute, and therefore available even to beginners. Price ranges work equally well on any trading assets and timeframes, they can be used both independently and with additional confirmation from oscillators and market volumes. American traders say: “Trend is your friend”, which means “Trend is
    I recommend you to read the   product's blog  (manual) from start to end so that it is clear from the beginning what the indicactor offers. This multi time frame and multi symbol trend indicator sends an alert when a strong trend or trend reversal has been identified. It can do so by selecting to build up the dashboard using Moving average (single or double (both MA:s aligned and price above/below both)), RSI, Bollinger bands, ADX, Composite index (Constance M. Brown), Awesome (Bill Williams), 
    Candle EA MT5
    Mansour Babasafary
    4.32 (41)
    This expert is based on patterns The main patterns of this specialist are candlestick patterns Detects trends with candlestick patterns It has a profit limit and a loss limit, so it has a low risk The best time frame to use this expert is M30 time frame The best currency pairs to use with this expert is the EURUSD, GBPUSD, AUDUSD, USDCAD currency pairs The price will increase by 100$ after every 10 purchases! Final price 2450$ Get a 50% bonus by buying (or even renting) any of our product
    High And Low MT5
    Dmitriy Parfenovich
    On the current chart, this indicator displays candlestick highs and lows of another time frame. Input Parameters: TimeFrame - chart time frame whose data will be displayed on the current price chart (by default, H12). Time Zone - shift of the indicator by time zone relative to the broker's time (by default, Broker-1). If the broker's time zone is UTC+1 and the Time Zone parameter is set to Broker-1, the bends of the indicator will be plotted in multiples of Greenwich Time. Indicator buffer value
    DM IND Exclusive
    Sergio Vidal Prado
    Indicador Para Opções Binarias. Indicator for Binary Options Usa dois gales. Instalar em mt5 Esse indicador é para ser usado no tempo de vela de 5 minutos e em M5. Este também funciona em M1, porém é mais eficiente em M5. Só descompactar e copiar os arquivos na pasta de dados do seu MT5. Arquivos indicator na pasta MQL5 - Indicator. Baixe também a Media Movel totalmente gratis: https://www.mql5.com/pt/market/product/50400 Esse Indicador é para a próxima vela. Apareceu a seta, só aguardar a pr
    Seasonal Pattern Trader
    Dominik Patrick Doser
    Disclaimer:   Bedenken Sie, dass saisonale Muster nicht immer zuverlässig sind. Deshalb ist ein durchdachtes Risikomanagement entscheidend, um Verluste zu minimieren. Saisonale Muster in der Finanzwelt sind wie ein gut gehütetes Geheimnis, das erfolgreiche Investoren für ihren Vorteil nutzen.  Diese Muster sind wiederkehrende Preisbewegungen, die in bestimmten Zeiträumen oder um besondere Ereignisse auftreten. Hier sind einige Beispiele und Hinweise zur optimalen Nutzung dieser Muster: Beispie
    Descriptions A point point is a technical analysis indicator, or calculations, used to determine the overall trend of market over different time frames. This indicator calculate the highest or lowest pivots among left x and right y bars and show the high/low level during that period.   From that, you could clearly see the top resistance & bottom support level and how market goes break out. Instructions pivotLeft - pivot left bar count pivotRight - pivot right bar count pivotHighColor - c
    AutoLevels
    Maxim Kuznetsov
    Automatic calculation and marking of resistance and price reversal levels. The script will perform statistical calculations and plot a regular grid on which the quote moves on the graph. These levels are very stable. Use them in trading planning and for placing pending orders. Just select a timeframe and AutoLevels will indicate the important places of the chart in the form of horizontal lines. Solid lines indicate more "dense" areas - areas of price reversal, where the quote happens more o
    Glider
    Vitalii Zakharuk
    The Glider indicator gives accurate and timely signals to enter and exit the transaction that appear on the current candle. Using the indicator is very simple. When a dot and a blue line appear, open a buy deal. When a dot and a red line appear, open a sell deal. The main purpose of this indicator is to determine the moments of entry and exit from transactions, therefore the Glider indicator will display only the trend line and entry points, i.e. displays displays the entry points to the mark
    Dieser Indikator ist ein perfekter automatischer Wellenanalyse-Indikator für den praktischen Handel! Die standardisierte Definition des Bandes ist nicht mehr eine Welle von verschiedenen Leuten, und das Ziehen von menschengemachten Interferenzen wird eliminiert, was eine Schlüsselrolle bei der gründlichen Analyse des Ansatzes spielt. =>Increase the choice of international style mode, (red fall green rise style)           Derzeit Kaufrabatt!   Inhalt des Index: 1.       Grundwelle:   Zue
    BoS CHoCH FVG Trader
    Usiola Oluwadamilol Olagundoye
    The Indicator for this Expert Advisor can be found here:  https://www.mql5.com/en/market/product/113694 Introducing the Break of Structure (BoS) and Change of Character with Fair Value Gap (FVG) Expert Advisor (EA), a sophisticated trading tool designed to automatically execute signals generated by the BoS CHoCH FVG indicator while offering advanced features for risk management and trade optimization. Key Features: Automatic Stoploss Detection : The EA intelligently detects optimal stop-loss lev
    Trend Ruby
    Ignacio Agustin Mene Franco
    Trend Ruby, indicator 3 of the ruby ​​pack. trend ruby ​​has the strategy of breaking the structure or trend line How well do the lines mark and gives you the signal of breaking or following the trend? and bounce! works for any temporality, It is used for scalping and also intraday It works for the forex markets all the pairs, also for synthetic indices all pairs ideal for volatility and jumps! also crash and boom!
    MT4-Version: https://www.mql5.com/en/market/product/90395 Wir stellen den No Marti No Party Expert Advisor vor: Ein revolutionäres komplexes Logik-Handelssystem Der No Marti No Party Expert Advisor (EA) stellt die Spitze der Handelstechnologie dar und beinhaltet ein hochkomplexes und voneinander abhängiges Logiknetz, um beispiellose Handelseinblicke zu liefern und profitable Geschäfte zu generieren. Dieser EA wurde von einem Team aus erfahrenen Mathematikern, Statistikern und erfahrenen
    Gold Dragon AI MT5
    Evgenii Aksenov
    5 (1)
    A unique Expert Advisor created with OpenAI Artificial Intelligence. The trading strategy has been tested since 2021. There has not been a single unprofitable month!!! As you can see on the account history, I deposited $10'000 in October 2021 and since then the account has made more than 980% income, which is perfect! I also withdrew funds in amount of $ 61'400 As you can see on the account history. I invested 10K in October of the 21st year and since then the account has brought me an income
    SupportResistence
    Eduardo Borges Mariani
    SupportResistance ist ein dynamischer Unterstützungs- und Widerstandsindikator, der auf dem Hoch und Tief früherer Kerzen basiert. Die Berechnungsparameter sind konfigurierbar. Sie können die Maximal- und Minimalwerte der vorherigen Kerze als Referenz verwenden, oder Sie können die Maximal- und Minimalwerte einer Gruppe vorheriger Kerzen verwenden. Der Indikator verwendet eine rote Linie, um den Widerstand anzuzeigen, und eine grüne Linie, um die Unterstützung anzuzeigen. Wenn eine Unters
    Optimistic trader may enter the market when the price crosses the Aqua line. More reliable entry will be when the price crosses the Blue line. When the price comes back and crosses the Red line you can open a position in the course of price movements.
    Ultimate Dynamic Levels MT5
    Hispraise Chinedum Abraham
    Derzeit auf Urlaub Rabatt bei $ 399! Die Preise können in Zukunft steigen. Lesen Sie die Beschreibung unten!   Einführung von Ultimate Dynamic Levels - der BESTE Einstiegsindikator für das Ultimate Sniper Dashboard! Extrem risikoarme, rechtzeitige Einstiege und hohe RR!! Finden Sie das Ultimate Sniper Dashboard HIER. Die wichtigste Fähigkeit sowohl für Anfänger als auch für Profis ist es, genau zu erkennen, wo und wann ein Markt am wahrscheinlichsten dreht, und wie man sicher einsteigt und m
    I recommend you to read the   product's blog  (manual) from start to end so that it is clear from the beginning what the indicactor offers. This multi time frame and multi symbol divergence dashboard indicator sends an alert when one or two different divergences have been identified. It can be used with all time frames from M1 to MN. Maximum 9 time frames can be shown in the dashboard at the same time. It is possible to enable moving average, RSI or Bollinger bands trend filter to filter out on
    Big Forex Players MT5
    Marzena Maria Szmit
    4.79 (38)
    We proudly present our cutting-edge robot, the Big Forex Players EA designed to maximize your trading potential, minimize emotional trading, and make smarter decisions powered by cutting-edge technology. The whole system in this EA took us many months to build, and then we spent a lot of time testing it. This unique EA includes three distinct strategies that can be used independently or in together. The robot receives the positions of the biggest Banks (positions are sent from our database to th
    The Rainbow Multiple Moving Average (MMA) is a technical analysis tool used to identify trends and potential reversal points in financial markets. It is based on a system of moving averages that are designed to be used together, with each moving average having a different time frame. The Rainbow MMA consists of multiple exponential moving averages (EMAs) of different lengths, with each EMA plotted in a different color. Typically, the Rainbow MMA includes EMAs of 2, 3, 4, 5, 6, 7, 8, 9, 10, 11, a
    Käufer dieses Produkts erwarben auch
    Zunächst einmal ist es wichtig zu betonen, dass dieses Handelssystem ein Nicht-Repainting-, Nicht-Redrawing- und Nicht-Verzögerungsindikator ist, was es sowohl für manuelles als auch für automatisches Trading ideal macht. Das "Smart Trend Trading System MT5" ist eine umfassende Handelslösung, die für neue und erfahrene Trader maßgeschneidert ist. Es kombiniert über 10 Premium-Indikatoren und bietet mehr als 7 robuste Handelsstrategien, was es zu einer vielseitigen Wahl für verschiedene Marktbe
    Atomic Analyst MT5
    Issam Kassas
    5 (11)
    Zunächst einmal ist es erwähnenswert, dass dieser Handelsindikator nicht neu malt, nicht neu zeichnet und keine Verzögerung aufweist, was ihn sowohl für manuellen als auch für Roboterhandel ideal macht. Der Atom-Analyst ist ein PA-Preisaktionsindikator, der die Stärke und das Momentum des Preises nutzt, um einen besseren Vorteil auf dem Markt zu finden. Ausgestattet mit fortschrittlichen Filtern, die helfen, Rauschen und falsche Signale zu entfernen, und das Handelspotenzial zu erhöhen. Durch
    Quantum Trend Sniper
    Bogdan Ion Puscasu
    5 (37)
    Wir stellen vor       Quantum Trend Sniper Indicator   , der bahnbrechende MQL5-Indikator, der die Art und Weise, wie Sie Trendumkehrungen erkennen und handeln, verändert! Entwickelt von einem Team erfahrener Händler mit über 13 Jahren Handelserfahrung,       Quantum Trend Sniper-Indikator       wurde entwickelt, um Ihre Trading-Reise mit seiner innovativen Methode zur Identifizierung von Trendumkehrungen mit extrem hoher Genauigkeit auf ein neues Niveau zu heben. ***Kaufe Quantum Trend Snipe
    FX Volume MT5
    Daniel Stein
    4.94 (17)
    Erhalten Sie Ihr tägliches Marktupdate mit Details und Screenshots über unser Morning Briefing hier auf mql5 und auf Telegram ! FX Volume ist der ERSTE und EINZIGE Volumenindikator, der einen ECHTEN Einblick in die Marktstimmung aus Sicht eines Brokers bietet. Es bietet fantastische Einblicke in die Positionierung von institutionellen Marktteilnehmern, wie z.B. Brokern, auf dem Forex-Markt, viel schneller als COT-Berichte. Diese Informationen direkt auf Ihrem Chart zu sehen, ist der wahre Game
    Trend Screener Pro MT5
    STE S.S.COMPANY
    4.89 (61)
    Nutzen Sie die Macht des Trendhandels mit Trend Screener Indicator: Ihrer ultimativen Trendhandelslösung, die auf Fuzzy-Logik und einem System mit mehreren Währungen basiert! Steigern Sie Ihren Trendhandel mit Trend Screener, dem revolutionären Trendindikator mit Fuzzy-Logik. Es handelt sich um einen leistungsstarken Trendfolgeindikator, der über 13 Premium-Tools und -Funktionen sowie 3 Handelsstrategien kombiniert und ihn zu einer vielseitigen Wahl macht, um Ihren Metatrader in einen Trendanaly
    Dies ist ein Indikator für MT5, der genaue Signale für den Einstieg in einen Handel ohne Repainting (Neuzeichnen) liefert. Er kann auf alle Finanzwerte angewendet werden: Forex, Kryptowährungen, Metalle, Aktien, Indizes. Er liefert ziemlich genaue Schätzungen und sagt Ihnen, wann es am besten ist, eine Position zu eröffnen und zu schließen. Sehen Sie sich das Video (6:22) mit einem Beispiel für die Verarbeitung nur eines Signals an, das sich für den Indikator gelohnt hat! Die meisten Händler ver
    FX Power MT5 NG
    Daniel Stein
    5 (4)
    Erhalten Sie Ihr tägliches Marktupdate mit Details und Screenshots über unser Morning Briefing hier auf mql5 und auf Telegram ! FX Power MT5 NG ist die nächste Generation unseres langjährig sehr beliebten Währungsstärkemessers FX Power. Und was bietet dieser Stärkezähler der nächsten Generation? Alles, was Sie am ursprünglichen FX Power geliebt haben PLUS GOLD/XAU-Stärkeanalyse Noch präzisere Berechnungsergebnisse Individuell konfigurierbare Analysezeiträume Anpassbares Berechnungslimit für noc
    Zunächst einmal ist es wichtig zu betonen, dass dieses Handelstool ein Nicht-Repaint-, Nicht-Redraw- und Nicht-Verzögerungsindikator ist, was es ideal für professionelles Trading macht. Der Smart Price Action Concepts Indikator ist ein sehr leistungsstarkes Werkzeug sowohl für neue als auch erfahrene Händler. Er vereint mehr als 20 nützliche Indikatoren in einem und kombiniert fortgeschrittene Handelsideen wie die Analyse des Inner Circle Traders und Strategien des Smart Money Concepts. Diese
    RelicusRoad Pro MT5
    Relicus LLC
    4.82 (22)
    Jetzt 147 US -Dollar (nach ein paar Aktualisierungen auf 499 US -Dollar) - Unbegrenzte Konten (PCs oder MACs) RelicusRoad Benutzerhandbuch + Schulungsvideos + Zugang zur privaten Discord-Gruppe + VIP-Status EINE NEUE ART, DEN MARKT ZU BETRACHTEN RelicusRoad ist der weltweit leistungsstärkste Handelsindikator für Forex, Futures, Kryptowährungen, Aktien und Indizes und gibt Händlern alle Informationen und Tools, die sie benötigen, um profitabel zu bleiben. Wir bieten technische Analysen un
    Auto Order Block with break of structure based on ICT and Smart Money Concepts Futures Break of Structure ( BoS )             Order block ( OB )            Higher time frame Order block / Point of Interest ( POI )    shown on current chart           Fair value Gap ( FVG ) / Imbalance   ,  MTF      ( Multi Time Frame )    Volume Imbalance     ,  MTF          vIMB Gap’s Equal High / Low’s     ,  MTF             EQH / EQL Liquidity               Current Day High / Low           HOD /
    Advanced Supply Demand MT5
    Bernhard Schweigert
    4.53 (15)
    Derzeit 33% Rabatt! Die beste Lösung für jeden Anfänger oder erfahrenen Händler! Dieser Indikator ist ein einzigartiges, qualitativ hochwertiges und erschwingliches Trading-Tool, da wir eine Reihe von proprietären Funktionen und eine neue Formel integriert haben. Mit diesem Update werden Sie in der Lage sein, doppelte Zeitrahmenzonen anzuzeigen. Sie können nicht nur einen höheren TF (Zeitrahmen) anzeigen, sondern sowohl den Chart-TF als auch den höheren TF: SHOWING NESTED ZONES. Alle Supply Dema
    AW Trend Predictor MT5
    AW Trading Software Limited
    4.76 (55)
    Die Kombination von Trend- und Aufschlüsselungsebenen in einem System. Ein fortschrittlicher Indikatoralgorithmus filtert Marktrauschen, bestimmt den Trend, Einstiegspunkte sowie mögliche Ausstiegsniveaus. Indikatorsignale werden in einem Statistikmodul aufgezeichnet, das es Ihnen ermöglicht, die am besten geeigneten Tools auszuwählen, die die Wirksamkeit der Signalhistorie zeigen. Der Indikator berechnet Take-Profit- und Stop-Loss-Marken. Handbuch und Anleitung ->   HIER   / MT4-Version ->   H
    TPSpro TRENDPRO  - is a trend indicator that automatically analyzes the market and provides information about the trend and each of its changes, as well as giving signals for entering trades without redrawing! The indicator uses each candle, analyzing them separately. referring to different impulses - up or down impulse. Exact entry points into transactions for currencies, crypto, metals, stocks, indices!  -  Version MT4                  DETAILED DESCRIPTION        /       TRADING SETUPS       
    A key element in trading is zones or levels from which decisions to buy or sell a trading instrument are made. Despite attempts by major players to conceal their presence in the market, they inevitably leave traces. Our task was to learn how to identify these traces and interpret them correctly. Reversal First Impulse levels (RFI)   -  Version MT4                  INSTRUCTIONS                 RUS                 ENG                         R ecommended to use with an indicator   -  TREND PRO  
    ICT, SMC, SMART MONEY CONCEPTS, SMART MONEY, Smart Money Concept, Support and Resistance, Trend Analysis, Price Action, Market Structure, Order Blocks, BOS/CHoCH,   Breaker Blocks ,  Momentum Shift,   Supply&Demand Zone/Order Blocks , Strong Imbalance,   HH/LL/HL/LH,    Fair Value Gap, FVG,  Premium  &   Discount   Zones, Fibonacci Retracement, OTE, Buy Side Liquidity, Sell Side Liquidity, BSL/SSL Taken, Equal Highs & Lows, MTF Dashboard, Multiple Time Frame, BigBar, HTF OB, HTF Market Structure
    Professional Scalping Tool on Deriv Attention! The indicator will be sold in limited quantities!!! Description: This trading indicator is designed for professional traders focused on scalping. Designed with the market in mind, it provides highly accurate spike trading signals. It works on the M1 timeframe and supports the following symbols: Boom 300 Index, Boom 500 Index, Boom 1000 Index, Crash 300 Index, Crash 500 Index, Crash 1000 Index. Functional Features: - Direction: - Trading is ca
    Blahtech Supply Demand MT5
    Blahtech Limited
    4.57 (14)
    Was: $299  Now: $99   Supply Demand uses previous price action to identify potential imbalances between buyers and sellers. The key is to identify the better odds zones, not just the untouched ones. Blahtech Supply Demand indicator delivers functionality previously unavailable on any trading platform. This 4-in-1 indicator not only highlights the higher probability zones using a multi-criteria strength engine, but also combines it with multi-timeframe trend analysis, previously confirmed swings
    Wir stellen vor       Quantum Breakout PRO   , der bahnbrechende MQL5-Indikator, der die Art und Weise, wie Sie mit Breakout-Zonen handeln, verändert! Entwickelt von einem Team erfahrener Händler mit über 13 Jahren Handelserfahrung,       Quantum Breakout PRO       ist darauf ausgelegt, Ihre Handelsreise mit seiner innovativen und dynamischen Breakout-Zone-Strategie auf ein neues Niveau zu heben. Der Quantum Breakout Indicator zeigt Ihnen Signalpfeile auf Breakout-Zonen mit 5 Gewinnzielzone
    XQ Indicator MetaTrader 5
    Marzena Maria Szmit
    5 (1)
    Step into the realm of Forex trading with confidence and precision using XQ, a cutting-edge Forex indicator designed to elevate your trading game to unprecedented heights. Whether you're a seasoned trader or just stepping into the world of currency exchange, XQ Forex Indicator empowers you with the insights and signals needed to make informed trading decisions. The signal conditions are a combination of three indicators, and XQ Forex Indicator only display  medium and long-term trends . The ind
    TrendDecoder Premium MT5
    Christophe, Pa Trouillas
    5 (1)
    Top bewertet auf anderem MarketPlace -  Jetzt verfügbar auf METATRADER Identifizieren Sie Bereiche und die nächsten wahrscheinlichen Bewegungen     |    Erhalten Sie früheste Signale und die Stärke von Trends     |    Klare Ausstiegssignale vor Umkehrung     |    Erkennen Sie die Fibo-Levels, die der Kurs testen wird    |  Indikator, der nicht zurückverfolgt, nicht verzögert - ideal für den manuellen und automatisierten Trading - geeignet für alle Vermögenswerte und Zeiteinheiten - 50% Rabatt  
    MetaBands M5
    Vahidreza Heidar Gholami
    4.67 (3)
    MetaBands verwendet leistungsstarke und einzigartige Algorithmen, um Kanäle zu zeichnen und Trends zu erkennen, sodass es Tradern potenzielle Punkte für den Einstieg und Ausstieg aus Trades bieten kann. Es ist ein Kanalindikator sowie ein leistungsstarker Trendindikator. Es umfasst verschiedene Arten von Kanälen, die einfach durch Verwendung der Eingabeparameter zusammengeführt werden können. MetaBands verwendet alle Arten von Warnmeldungen, um Benutzer über Marktereignisse zu informieren. Funkt
    Zunächst einmal ist es wichtig zu betonen, dass dieses Handelssystem ein Nicht-Repainting-, Nicht-Redrawing- und Nicht-Verzögerungsindikator ist, was es ideal für den professionellen Handel macht. Das "Smart Support and Resistance Trading System" ist ein fortschrittlicher Indikator, der für neue und erfahrene Trader entwickelt wurde. Es ermöglicht Tradern Präzision und Vertrauen auf dem Devisenmarkt. Dieses umfassende System kombiniert mehr als 7 Strategien, 10 Indikatoren und verschiedene Ha
    Was: $249  Now: $99   Market Profile defines a number of day types that can help the trader to determine market behaviour. A key feature is the Value Area, representing the range of price action where 70% of trading took place. Understanding the Value Area can give traders valuable insight into market direction and establish the higher odds trade. It is an excellent addition to any system you may be using. Inspired by Jim Dalton’s book “Mind Over Markets”, this indicator is designed to suit the
    Malaysian SNR Levels
    Matthias Horst Pieroth
    This indicator can be used to display Support and Resistance levels according to  the  Malaysian SNR concept , in which Support and Resistance are exact levels of a line chart. Malaysian SNR There are 3 different horizontal levels in Malaysian SNR: A-Level : This level is located at the peak of this line chart. (shape looks like the letter A) V-Level : Level at the valley of a line chart, (shape looks like the letter V) Gap-Leve l: This level is located at the Close/Open gap between two cand
    The Volume by Price Indicator for MetaTrader 5 features Volume Profile and Market Profile TPO (Time Price Opportunity). Get valuable insights out of currencies, equities and commodities data. Gain an edge trading financial markets. Volume and TPO histogram bar and line charts. Volume Footprint charts. TPO letter and block marker charts including split structures. Versatile segmentation and compositing methods. Static, dynamic and flexible ranges with relative and/or absolute visualizations. Lay
    Trend Line Map Pro MT5
    STE S.S.COMPANY
    4.67 (9)
    Trend Line Map Indicator ist ein Add-On für Trend Screener Indicator. Es arbeitet als Scanner für alle Signale, die vom Trendscreener (Trendliniensignale) erzeugt werden. Es ist ein Trend Line Scanner basierend auf dem Trend Screener Indicator. Wenn Sie keinen Trend Screener Pro Indicator haben, funktioniert die Trend Line Map Pro nicht. It's a Trend Line Scanner based on Trend Screener Indicator. If you don't have Trend Screener Pro Indicator,     the Trend Line Map Pro will not work .
    Account Graph MT5
    Kyra Nickaline Watson-gordon
    5 (1)
    An indicator to draw a graph of account current and historical state such as Balance, Equity, Margin, Free Margin, Margin Level, Drawdown, Account Profit, Deposit and Withdrawals. Indicator Inputs : Draw Balance Graph Draw Equity Graph Draw Margin Graph Draw Free Margin Graph Draw Margin Level Graph Draw Drawdown Graph Draw Account Profit Graph Hide Data on Chart and Buffers Connect Gaps by Lines Sign of DDs on Profit Sign of DDs on Loss Tips : The Indicator will draw historical balance gra
    Die beste Lösung für jeden Newbie oder Expert Trader! Dieser Indikator ist ein einzigartiges, qualitativ hochwertiges und erschwingliches Handelsinstrument, da wir eine Reihe von proprietären Funktionen und eine geheime Formel eingebaut haben. Mit nur EINEM Chart liefert er Alerts für alle 28 Währungspaare. Stellen Sie sich vor, wie sich Ihr Handel verbessern wird, weil Sie in der Lage sind, den genauen Auslösepunkt eines neuen Trends oder einer Scalping-Gelegenheit zu erkennen! Auf der Gru
    Der Forex TPA Indikator deckt die wahren Aktionen der Marktmacher auf, immer dann wenn sie passieren. "Kämpfe nicht gegen die Marktmacher an, sondern folge ihnen", ist wohl der beste Rat, den ein Trader bekommen kann. Der TPA Indikator zeigt jedesmal seine Signale an wenn die Bullen definitiv stärker sind als die Bären und umgekehrt. Dieser Indikator wurde VON Tradern FÜR Trader gemacht und ist 100% NICHT NACHZEICHNEND! Signale werden STRENG am Schluss einer Kerze  generiert. Das sagen unsere Ku
    IX Power MT5
    Daniel Stein
    5 (2)
    IX Power   bringt die unschlagbare Präzision von FX Power endlich auch zu Nicht-Forex-Symbolen. Es bestimmt präzise die Intensität von kurz-, mittel- und langfristigen Trends in Ihren Lieblingsindizes, Aktien, Rohstoffen, ETFs und sogar Kryptowährungen. Sie können   alles analysieren, was   Ihr Terminal zu bieten hat. Probieren Sie es aus und erleben Sie, wie   sich Ihr Timing   beim Handel   deutlich verbessert . IX Power Hauptmerkmale 100% präzise, nicht nachpinselnde Berechnungsergebni
    Weitere Produkte dieses Autors
    SmartMass
    Roberto Alvarez
    5 (2)
    SMARTMASS INDICATOR This indicator is different from all known volume indicators. It has a significant distinction; it is an algorithm that relates price movement to volume, attempting to find proportionality and efficient movement while filtering out noise and other movements that are more random and do not follow a trend or reversal. Ultimately, it reveals the true strength of the movement, indicating whether it has genuine support from bulls or bears or if it's merely a high-volume movement
    TrackingLevels MT4
    Roberto Alvarez
    5 (1)
    TRACKINGLEVELS (SUPPORTS AND RESISTANCES) TrackingLevels is a useful indicator that saves considerable time when a trader starts analyzing a chart. This indicator draw on the chart all the resistances and supports that the market is creating. The resistance and support levels are very important, this levels define areas where there can be a considerable accumulation of sell or buy orders. These are a key areas that every trader must know and keep in mind all the time. This indicator helps th
    TRACKINGLEVELS (SUPPORTS AND RESISTANCES) TrackingLevels is a useful indicator that saves considerable time when a trader starts analyzing a chart. This indicator draw on the chart all the resistances and supports that the market is creating. The resistance and support levels are very important, this levels define areas where there can be a considerable accumulation of sell or buy orders. These are a key areas that every trader must know and keep in mind all the time. This indicator helps the
    Auswahl:
    Keine Bewertungen
    Antwort auf eine Rezension
    Version 3.13 2024.01.16
    1. Remove the transient state when the terminal is loading data from the broker's server.
    2. Implementation of small improvements in the execution of sequences
    Version 3.12 2024.01.13
    1. Bug fixes and other minor improvements
    Version 3.11 2023.12.03
    1. Enhancements implemented in detecting impulses.
    2. Minor bugs fixed
    Version 3.10 2023.11.11
    1. Bug fixes and other minor improvements
    Version 3.9 2023.11.08

    1. Code organization improvements.
    2. Small errors fixed.
    Version 3.8 2023.10.29
    1. The impulses detection algorithm is improved when they are consecutive
    2. Minor errors fixed
    Version 3.7 2023.10.07
    1. Improvements in the impulse detection algorithm.
    2. Optimization of the rectangle objects size
    Version 3.6 2023.10.01
    1. Improved the algorithm for calculating impulse width
    Version 3.5 2023.09.30
    1. The algorithm for impulse detection has been improved
    2. Bugs caused by session end and start gaps have been fixed
    Version 3.4 2023.09.17
    1. Impulse detection algorithm update
    2. bugs fixed
    Version 3.3 2023.09.16
    1. Optimized code
    2. Some small bugs fixed
    3. Icon added
    Version 3.2 2023.09.15
    1. Improvements in graphic objects
    2. Floating labels of impulse rectangles with more information
    3. Improved impulse detection algorithm
    Version 3.1 2023.09.08
    1. Some little errors in the drawing of the objects are fixed.
    2. Improvements in alerts management
    Version 3.0 2023.08.27
    1. New feature for detecting bullish and bearish impulses.

    2. New alerts with valuable information about the detected impulses.(push notifications, sounds, emails)

    3. The arrows will be removed and replaced by new rectangular objects for visual assistance for each impulse.

    4. Data provided for each impulse that displays its own characteristics with floating labels.
    - Volumen factor: Measurement of the intensity of the impulse compared to the average value
    - Pips factor: pips variation from the start price to the end price of the impulse compared to the average candle body value.
    - Width of the impulse: Number of candles that make up the impulse.

    5. More efficient code
    Version 2.30 2023.04.23
    1. Improvements in the position of the objects in the graph
    2. Minor fixes and improvements
    Version 2.22 2023.04.22
    1. Improved management of divergence signals
    Version 2.21 2023.04.12
    1. Optimize the average positive and negative line
    2. Fixed some errors about arrays initializations
    Version 2.2 2023.04.11
    1. Improved premium type signal (high probability)
    Version 2.1 2023.04.11
    1. Increase indicator calculation frequency
    2. Fixed some minor errors
    Version 2.0 2023.04.10
    1. Added alerts (sounds, notifications, messages)
    2. Added text label of both volumes (actual candle)
    3. Added arrow objects from lowest to highest probability (weak, medium and premium signals)
    4. Divergences price-smartmass detection
    5. Improved volumen calculates
    6. New average lines (positive and negative smartmass)
    7. Fixed some minor errors
    Version 1.30 2023.01.21
    1. Fixed some minor bugs on last candle value
    Version 1.20 2022.09.17
    1. Improvements in the initialization process
    Version 1.10 2022.08.12
    Version 1.10
    1. Code efficiency is improved. Faster process and without lags
    2. Indicator behavior in the strategy tester visualization is optimized
    3. The updating of the value of the indicator corresponding to the last candle has been improved.
    4. fixed some minor errors