• Übersicht
  • Bewertungen
  • Diskussion
  • Neue Funktionen

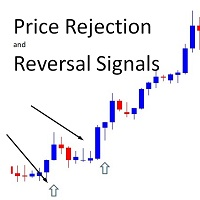
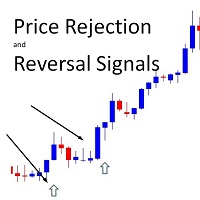
Price Rejection and Reversal Signals

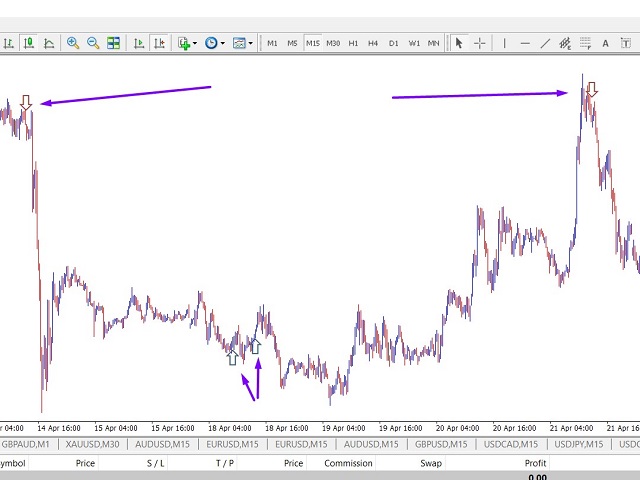
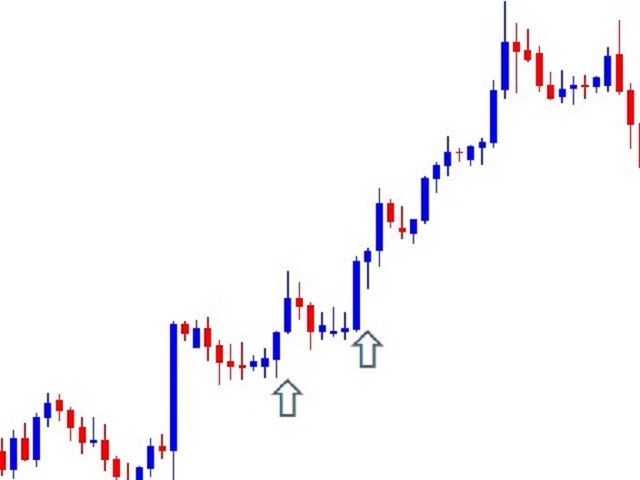
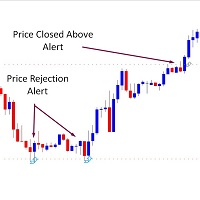
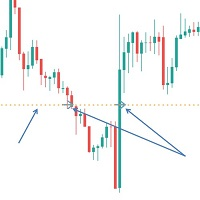
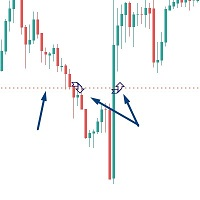
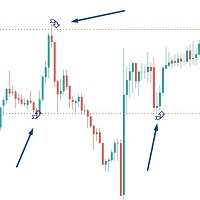
Buy And Sell Signal Arrows On The Chart When The Price Is About To Reverse.

Also Sends Alerts –On MT5

  • To Your Phone
  • To Your Email.

  • Does not repaint.

  • Works on any pair, any timeframe.  (Just ajust the settings for your pair and timeframe.)

  • 10 Activations allowed so you are free from limitations

MT4 version here.  

What is Price Rejection and Reversal and why is it important to you?

If price shows certain signs of rejection e.g. a large wick, this often means that it will then reverse and continue in the opposite direction from the wick.

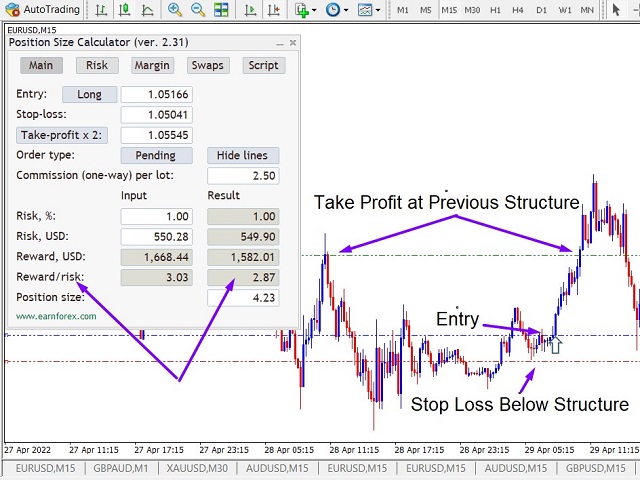
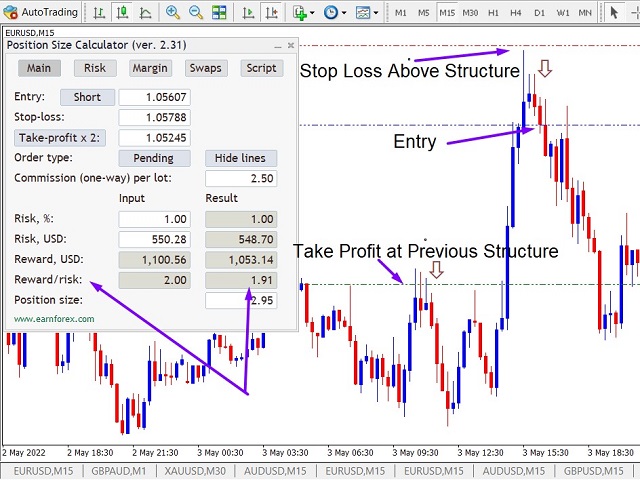
Price then normally will go to previous structure (support or resistance) and you can use those as your targets for Take Profits.

The Price Rejection and Reversal Signals Indicator tells you when the price is about to reverse. Using Price Rejection should be a part of every Trader’s strategy.


Works very well in conjunction with the Trend Continuation Alerts Indicator, Consolidation Breakout Indicator and Order Blocks For Trend Continuation Indicator.


Obviously, any indicator will not predict all reversals all the time – the markets are unpredictable – otherwise we would all be successful all the time.

This is still Forex and you will not win every trade. Practice on Demo before trading with live money and always use good money management.

I recommend that you only take a trade if there is a minimum Reward to Risk Ratio of 2:1 available. Personally, I only take trades of 3:1 or more.

You could also "filter" your trades using higher timeframe trend, or using an exponential moving average e.g. 100EMA


Please feel free to message me if you have any questions.  


SETTINGS:

 - Please make sure you adjust the settings for the timeframe and pair you are trading.

 -  Let me know if you need any help.


MinWickSize

This sets the minimum size of the "rejection" wicks in relation to the candles' body length. For price rejection, you want big wicks.

0.5 would mean the wick can be half of the size of the candle body. The lower the value, more signals, but less accurate.

MaxSignalCandleWickSize

This sets the maximum wick size of the signal candle in relation to the candle's body length.

Remember, this candle is in the direction of the trade you will take, so you want the opposite to a rejection i.e. a small wick.

0.5 would mean the wick can be half of the size of the candle body. The higher the value, more signals, but less accurate.

MinSR_Range

This sets the minimum range of the candles doing the rejection. A larger setting here stops you getting signals from tiny candles where there is not any real rejection or price movement.

    MinSignalBreakoutPips

    Minimum number of pips you want the signal candle to break above or below the temporary structure on the opposite side from the rejection to get a signal on the chart.

      TimeOfTheDay(from hour)

      The hour you want the Indicator to start each day.

        TimeOfTheDay(from mins)

        The number of minutes past the hour you want the Indicator to start each day.

          TimeOfTheDay(to hour)

          The hour you want the Indicator to stop each day.

            TimeOfTheDay(to min)

            The number of minutes past the hour you want the Indicator to stop each day.

              Send_Email

              Sends an alert to your email (if you have set this up).

                Audible_Alerts

                Gives a sound alert and pop-up message in MT5.

                  Push_Notifications

                  Sends an alert to your phone (if you have set this up).


                    Empfohlene Produkte
                    Thunder Scalper
                    Mr Fares Mohammad Alabdali
                    Buy and Sell Targets Indicator You can see the buying and selling goals in the box and they are inevitably achieved.      It consists of three lines: the first green color sets buying targets, the second red color sets selling targets, and the third blue color is the average price.      There are two ways to enter -      Method 1: The entry point when the average price with a long candle is broken from below and staying above the blue line with a green candle is considered a buy      When the av
                    30 000 USD
                    EYeQ Indicator ist ein leistungsstarkes Tool, um Einstiegssignale für STEP INDEX, VOLATILITY 10, 25,50,75 100, BOOM und CRUSH anzubieten. Es ist effektiver zum Fangen von SPIKES auf BOOM und CRUSH 300, 500 und 1000. Der EYeQ-Indikator analysiert Märkte über mehrere Zeiträume hinweg und findet basierend auf Trends die am besten geeigneten Einstiegspunkte. Sie müssen nur die Desktop-Benachrichtigungen einschalten, damit Sie benachrichtigt werden können, wenn Signale freigegeben werden. Erlaub
                    389 USD
                    A useful scanner/dashboard that shows the RSI values for multiple symbols and Time-frames. It can be easily hidden/displayed with a simple click on the scanner man top left of the dashboard. You can input upper and lower RSI values and the colours can be set to show when above/below these values. The default values are 70 and 30. There are also input colours for when the RSI is above or below 50 (but not exceeding the upper/lower levels Symbols and time-frames are input separated by commas.
                    80 USD
                    Drew Assistant
                    Andrew Adjetey Osae
                    Drew Assistant  a multi-timeframe indicator that is based on three standard indicators:   Stochastic oscillator ,   RSI   (Relative Strength Index), and   CCI   . It displays current trend directions for M1, M5, M15, M30, H1, H4, D1, W1, and MN1 timeframes. When you follow such an indicator you have a clear picture of the trends across all important timeframes. It doesn't matter which timeframe you attach this indicator to. The indicator can be downloaded for MT4 and MT5.
                    930 USD
                    Limitless MT5
                    Dmitriy Kashevich
                    Limitless MT5 is a universal indicator suitable for every beginner and experienced trader. works on all currency pairs, cryptocurrencies, raw stocks Limitless MT5 - already configured and does not require additional configuration And now the main thing Why Limitless MT5? 1 complete lack of redrawing 2 two years of testing by the best specialists in trading 3 the accuracy of correct signals exceeds 80% 4 performed well in trading during news releases Trading rules 1 buy signa
                    1 399 USD
                    We publish the indicator as a useful tool in trading and call this indicator the "Swiss Army Knife" because it provides many possibilities and combinations to help understand the material on the "Masters of Risk" trading system. The indicator itself is not part of the tools used in the "Masters of Risk" trading system. The indicator consists of 3 separate multi-timeframe indicators, which in combination with each other help to reduce the "noise" of false signals. The first of the indicators ar
                    150 USD
                    Price Cyclicality MT5
                    Cristian Mihail Pauna
                    The Price Cyclicality indicator defines the cycles of any price evolution. It shows clearly the ascending and descending intervals with asymptotic evolution near the minimal and maximal price values. The Price Cyclicality indicator can be used to generate automated entry signals near the minimal price values. Also, the Price Cyclicality indicator can be used to define limit conditions to generate automated exit signals near the maximal price values. The efficiency of this indicator was proved du
                    400 USD
                    Please note:- This product has been moved and combined with the   Trend Continuation Alerts Indicator   here . There is an new video and instructions. Please feel free to message me if you have any questions on how best to use it ir any of my other indicators. If any of my instructions are not clear or you are not sure about hoe I am explaining them, again, please message me. Thank you.
                    5 000 USD
                    Adaptive Cyclicality
                    Cristian Mihail Pauna
                    The Adaptive Cyclicality indicator defines the cycles of any price evolution. This indicator is computed by applying the "Cyclicality" mathematical transformation to the Adaptive Moving Average function introduced by Perry J. Kaufmann. The Adaptive Cyclicality defines very good entry and exit trading signals near the minimal and maximal points. It is a very accurate indicator that can be used on any market and any timeframe. The Adaptive Cyclicality indicator can be used to generate automated en
                    600 USD
                    Relative Cyclicality
                    Cristian Mihail Pauna
                    The Relative Cyclicality indicator defines the cycles of any price evolution. This indicator is computed by applying the "Cyclicality" mathematical transformation to the classic Relative Strength Index indicator made by J. Welles Wilder. The Relative Cyclicality defines very good entry and exit trading signals near the minimal and maximal points. It is better than RSI itself due to the unicity of the minimal and maximal points on a specific time interval. The Relative Cyclicality indicator can b
                    600 USD
                    This indicator is based on a mathematical formula which gives you the possibility to seek and find the right frequency of the movement, and to determine its key level; just adjust the frequency parameter! Simple and highly effective; using this indicator you can easily predict the next support and  resistance    levels of the day. Also, this indicator determines the range and the next two importants levels of the movement outside this range so far. SGFL3 and RGFL3  are levels with high certainty
                    180 USD
                    - This is an implementation of OCC ==> open close cross - This indicator applies twelve different averaging methods to open and close prices separately to signal the trend switching. - All MA methods are set as input as well as period and different offsets applied to linear regression and ALMA averaging. - Buffers 16 and 17 can be used in EAs to detect trend direction. - You can message in private chat for further changes you need.
                    40 USD
                    RadioMedia
                    Cesar Juan Flores Navarro
                    Indicador de MQL5 basado en 3 EMAs, en función del precio. El precio influye en las EMAs, de tal forma que los Máximos y Mínimos solo la alteran minimamente, este influjo lo llame radio. Considerando la influencia del radio como constante, por lo que no tiene valores de entrada. Ideal para todas las criptomonedas. Funciona en todos los tiempos. Se sugiere operar cuando el precio este abajo y en bajada.... o cuando el precio este encima y en subida.
                    1 000 USD
                    Impulse fractals indicator - is counter-trend oriented complex market fractal pattern.  Market creates bull/bear impulse, trend starts, fractals on impulsed wave are an agressive pullback signals. Buy arrow is plotted when market is bearish and it's impulse showed up-side fractal, and sell arrow is plotted when market is bullish and it's impulse showed dn-side fractal. Main indicator's adjustable inputs : impulsePeriod - main period of impulse histogram  filterPeriod  - smoothes impulse accordi
                    199 USD
                    Bands trend
                    Mihail Matkovskij
                    This trend Expert Advisor is based on an original interpretation of the Bollinger Bands indicator. This signal generation method allows entering the market at the very beginning of the trend with a tight stop loss. The EA contains 6 options for position closure signals, which allows selecting the best one depending on the instrument, as well as market conditions. All positions are protected by virtual and fail-safe stop loss. The virtual stop loss triggers only after a bar closes beyond its leve
                    230 USD
                    Floating peaks oscillator - it the manual trading system. It's based on Stochastik/RSI type of oscillator with dynamic/floating  overbought and oversold levels. When main line is green - market is under bullish pressure, when main line is red - market is under bearish pressure. Buy arrow appears at the floating bottom and sell arrow appears at floating top. Indicator allows to reverse signal types. Main indicator's adjustable inputs : mainTrendPeriod; signalTrendPeriod; smoothedTrendPeriod; tre
                    199 USD
                    Premium-Level ist ein einzigartiger Indikator mit mehr als 80% Genauigkeit der richtigen Vorhersagen! Dieser Indikator wurde von den besten Trading-Spezialisten seit mehr als zwei Monaten getestet! Den Indikator des Autors finden Sie nirgendwo anders! Anhand der Screenshots können Sie sich von der Genauigkeit dieses Tools überzeugen! 1 ist ideal für den Handel mit binären Optionen mit einer Ablaufzeit von 1 Kerze. 2 funktioniert bei allen Währungspaaren, Aktien, Rohstoffen, Kryptowähr
                    1 100 USD
                    This MT5 indicator has been designed to be used on any currency pair or indices and on the daily time frame or higher . The indicator looks for medium-term high-probability continuations in price and will indicate you to go long (buy) or short (sell) if you see a green or red arrow next to the current candlestick respectively. The indicator paints an arrow when the specific criteria are met, however, you must wait until the current candlestick has closed until you enter a trade . Therefore you w
                    199 USD
                    Live accounts monitoring can be found here:  bit.ly/stocks_cfd Live Signals Monitoring can be found here:  2783 6918 1566 7984 Introduction The fundamental difference in Stocks compared to Forex market is that the stock price of financially sound companies will grow over time. The  Money Printing Machine MT5 Stocks CFD  EA is designed to trade in the Stocks CFD market. This EA has been tested to work well in the following symbols: Adobe;AdvMicroDev;Amazon;Alibaba;Apple;Berk
                    499 USD
                    TPO Profile MT5
                    Kyra Nickaline Watson-gordon
                    Definition : TPO is a Time Price Opportunity. Instead of using bars or candles with an Open, High, Low, and Close price, each "bar" in a Market Profile is represented by horizontal bars against the price It is called Market Profile terminology. In other words time-price-opportunity (TPO) profiles are histograms of how much time was spent at each price within the span of the profile. By using a TPO chart, you are able to analyze the amount of trading activity, based on time, for each price leve
                    60 USD
                    Gold Super Trends AutoTrader Robot
                    Hesham Ahmed Kamal Barakat
                    5 (5)
                    60% Discount General description; This EA is made to be used in the Gold market. It's made for trading Gold in mind. This Trading Robot is based on more than 14 years of winning patterns and will open trades by the minute, 24 hours a day. It will handle everything, from opening positions, closing them, managing risk. Features; - Timeframe-Less Expert Advisor that works by the second and recalculate everything with whichever situation that might exist. - Dynamic market watcher that adjust it
                    1 999 USD
                    A professional tool for trading - the divergence indicator between the WPR and the price, which allows you to receive a signal about a trend reversal in a timely manner or catch price pullback movements (depending on the settings). The indicator settings allow you to adjust the strength of the divergence due to the angle of the WPR peaks and the percentage change in price, which makes it possible to fine-tune the signal strength. The indicator code is optimized and is tested very quickly as par
                    37 USD
                    Dieses DYJ-Signal ist ein vollständiges Handelssystem, das auf ATR-Spezifikationen basiert. Diese Indikatoren zeichnen den aktuellen Status jedes Krafttrends in jedem Zeitrahmen und in jedem analysierten Währungspaar auf. Durch die Auswertung dieser Daten erstellt das DYJ-Energiesignal eine Liste von Trendintensität und Eingangssignalen. Wenn eines der beiden Paare genau übereinstimmt, wird eine entsprechende Warnung angezeigt. Zu den Listendaten gehören Symbol, M5 MN1, BuTypeContent, SellPerce
                    125 USD
                    Cycles Forecast
                    Pooriya Alirezaee
                    This indicator is based on a mathematical formula and an ANN combined, designed to make a model(using previous prices) of the most recent market condition (any chart*) in order to use the model as a forecasting tool. *This indicator can operate on any chart/timeframe, but it's suggested you use multiple timeframes for each trade because this method relies solely on the time factor, you can not use this indicator to predict price volatility, but if it's fit correctly it will show you when the nex
                    1 449 USD
                    Phoenix Plus
                    Dang Cong Duong
                    At first, I got my teeth into  Phoenix  Ultra   Expert Advisor. This   Expert Advisor  will support automatic close order if the direction is correct and perform recovery if the direction is wrong. If you enter an order: 1. The price goes in the right direction and hits the   Min Profit Point ,   trailing stop 20% of the current profit. 2. The price goes in the opposite direction, the Expert Advisor will place the order with the volume is   Recovery Volume Percent  at the input, the distance t
                    409 USD
                    QXS Market Scanner
                    Netlux Digital Kft.
                    QuantXMarketScanner is a multi assets indicator for MT5 - Mathematical model based on 7 custom moving averages indicators  - Adaptable on Currencies, Stocks and Crypto - Automatic setup, self optimized About QuantXsystem Products: –         Simple installation & integration into MT5   –         Unlimited License after purchase (for one user) –         Automatic pattern recognition to identify the best timing and price levels. –         Trading indicators are displayed directly and automatica
                    465 USD
                    Tools zum Verdienen und Forschen. Der Kern der Handelssignale und -strategie basiert auf dem Algorithmus des Autors zur Bildung von Preisprognosemustern. Für jedes Instrument anwendbar! Ergänzt um ein Kontrollsystem basierend auf dem MA "Nine-Tailed Fox" , das das Signal so genau wie möglich für den Markt, das Instrument und den Arbeitszeitraum aktualisiert und anpasst. Zugelassen: Alle Instrumente in allen Märkten (es gibt Ausnahmen). Für wen: Hedgefonds, Fonds- und Vermögensverwalter, Anlag
                    25 920 USD
                    Helios Gold
                    Duc Phong Ha
                    2 (1)
                    Discount 20% within 7 days as request of someone from 7 Oct - Helios Gold Trade for two-way scalping Trade with the trend and use a fairly large SL, so when Gold is likely to reverse, it will open a hedging trade. - Use the optimal analysis tools to confirm the trend of gold. - no Grid, no martingale - H1 time frame - Defauls Setting - The optimal capital for Helios is 0.01 for every $500. Use accounts with low spreads for accurate indicators. - link live signal:  https://www.mql5.com/en/signals
                    1 500 USD
                    Советник скальпер торгует в тиковом канале основанном на канале Дончиана. Уникальный алгоритм расчета канала учитывает тиковые движения рынка и подстраивается под канал, для получения максимальной прибыли.  Советник рассчитан на брокеров с минимальным спредом и комиссиями. Работает на многих кроссах. В роботе возможна торговля фиксированным лотом или лотом пропорциональным депозиту.  Так же предусмотрен виртуальный стоплосс который отрабатывает расширения спреда в Ролловер и на новостях.
                    2 000 USD
                    Vorstellung von Three Moving Averages Pro, einer Sammlung von Strategien, die gleitende Durchschnitte mit leistungsstarken benutzerdefinierten Optimierungsmetriken verwenden. Three Moving Averages Pro hilft Ihnen, die besten Handelssysteme mit geringer Stagnation und hohem Nettoertrag zu finden. Diese Strategie verwendet zwei Einstiegsbedingungen und eine Ausstiegsbedingung, um Trades mit Präzision und Genauigkeit auszuführen. Mit einer Vielzahl von Optionen wie dem Einstiegszeitpunkt beim Öffne
                    270 USD
                    Käufer dieses Produkts erwarben auch
                    ToolBox 360 is the swiss knife of all indicators. It is full packed with useful tools to help you with your trading. It can be used to find best entry and exit points and help you to decide if you should open a trade or not. It shows market trends, candlestick formations outside / inside bars and you can sett time based allerts. Main features: Time based Fibonacci lines Choose a start and end time and the indicator shows you Fibonacci lines within the selected time range including range high
                    399 USD
                    VTrende Pro
                    Andrey Dyachenko
                    VTrende Pro - MTF indicator for trend trading with a display panel for MT5 *** Videos can be translated into any language using subtitles (video language - Russian) Although the signals of the VTrende Pro indicator can be used as signals of a full-fledged trading system, it is recommended to use them in conjunction with the Bill Williams TS. VTrende Pro is an extended version of the VTrende indicator. Difference between Pro version and VTrende: - Time zones - Signal V - signal 1-2 waves
                    697 USD
                    IVISTscalp5
                    Vadym Zhukovskyi
                    Wir stellen Ihnen den iVISTscalp5-Indikator vor, der nicht nur einzigartig, sondern auch effektiv im Handel ist. Dieser Indikator basiert auf Zeitdaten und ist das Ergebnis jahrelanger Erfahrung und eingehender Analyse der Finanzmärkte. Der iVISTscalp5-Indikator ist ein ausgezeichnetes Werkzeug für manuellen Handel. Bequemlichkeit, Einfachheit und Visualisierung - die gesamte Komplexität ist verborgen. Wir haben die Einstellungen und Verwendung des iVISTscalp5-Indikators auf das Maximum vereinfa
                    500 USD
                    Seconds Charts
                    Aleksandr Goryachev
                    Micro  ******************* Секундные графики MT5 ********************** Более точного инструмента для входа в сделку вы не найдёте. Входные параметры: Timeframe, sek - период построения графика, секунды Displayed bars - отображаемые бары Step of price levels, pp, 0-off - шаг отрисовки ценовых уровней, пункты Scale points per bar, 0-off - масштаб в пунктах на бар Show lines - отображение текущих уровней Show comment - отображение комментария Standard color scheme - стандартная цветовая сх
                    1 500 USD
                    Mystery Signal
                    Cristian Mihail Pauna
                    Mystery Signal is a reliable trading signal based on pure price action and filtered with Relative Momentum and Relative Cyclicality. If you love simple charts, Mystery Signal is fitting your needs and it is providing efficient entries for any market and any timeframe. There are more than 20 years of work behind this indicator, and it was tested with good results on M15, H1, H4, and D1 timeframes. Mystery Signal confirmed by Order Blocks is giving us good leverage. A stable  Risk and Capital M
                    500 USD
                    Robos
                    Namu Makwembo
                    5 (1)
                    Big promotion on the Robos, Get yours now Robos Indicator The   ROBOS   indicator is a multi timeframe oscillator that targets the   overbought   and   oversold  regions of a price chart, a signal is indicated by the two lines crossing, compatible with all tradable instruments Latest Release The latest release is the version 4.0 #What's new in version 4.0 ? Features Extreme oversold and overbought levels ROBOS version  4.0  comes with cool new feature , the ability to target on
                    499 USD
                    Big promotion! , prices are now on discount , get your copy now  The   Rubdfx Price Tracker   that is used to show price price bound , the price almost never goes out of the channel and most of the time price will react when it touches the channel limits .It determines the best highest and lowest prices at which you can sell and buy respectively Suitable for scalping & swing trading It Draws arrows that appear after a candle close , The arrows indicate bullish or bearish pressure For bearish an
                    499 USD
                    This is my own modified version of the RMI indicator. Its one of the best indicators i've found to take small profits from the market and i've been able to make it slightly better by modifying and fine tuning some parts Default settings works best for M1 timeframe The Relative Momentum Index calculates a ratio of upwards changes to downwards changes in prices over N-period bars. The RMI values range between 0 and 100. 30 and 70 are the two levels of oversold and overbought market conditions re
                    500 USD
                    Incinerat8
                    Paulos Ngwenya
                    This algorithm uses real time data to generate signals with an accuracy rate of 80%. It shows entries and where you should place both the stoploss and the take profit for each trade. It determines trend! It can even help you to become a signal provider! And it can generate up to 8 signals a day! You get access to a free forex trading community  Operates on any broker compatible to synthetic indices and forex   if you need any assistance whatsapp +2774 35 35 744 or telegram link @pipsempire01
                    400 USD
                    Weis Wave with Alert MT5
                    Trade The Volume Waves Single Member P.C.
                    4.93 (14)
                    Rental Package Options and Privilages  * For optimum results the yearly package is suggested due to live training and Discord  channel trading with the  creator! Rent Monthly Six Months   Yearly Weis Wave with Speed with Alert+Speed Index x x x Manual  x x x Quick Set up Video x x x Blog x x x Lifetime Updates x x x Setup and Training Material x x Free Rectangle Break Alert Tool      x Discord Access Channel "The SI traders" x 2-hour live methodology training x ** NEW PLUTUS SIGN
                    379 USD
                    Fibonacci Suavizado
                    Cesar Juan Flores Navarro
                    Indicador en MQL5, que obtiene el promedio de 10 EMAS, que son alineadas según Fibonacci, obteniendo un promedio, que sera suavizado.  Se puede ingresar un numero desde 2 a N, que multiplica a los EMA-Fibonacci. Funciona en cualquier criptomoneda, etc. etc... pudiendo calcular el futuro segun la tendencia de las EMAS. Funciona excelentemente en tramos largos, determinando exactamente el mejor inicio/salida. El precio inicial por apertura sera por un periodo de tiempo, luego aumentará.
                    1 000 USD
                    WanaScalper
                    Isaac Wanasolo
                    1 (1)
                    A scalping indicator based on mathematical patterns, which on average gives signals with relatively small SL, and also occasionally helps to catch big moves in the markets (more information in the video) This indicator has three main types of notifications: The first type warns of a possible/upcoming signal on the next bar The second type indicates the presence of a ready signal to enter the market/open a position The third type is for SL and TP levels - you will be notified every time price r
                    1 350 USD
                    SQN Max indicator for MT5 by ITC
                    Renaud Herve Francois Candel
                    Sqn Max Indicator Sqn Max is an exclusive indicator to trade the market with high effectiveness. The indicator is based on price action, volatility and trend. This indicator is as simple as possible but not too simple. The indicator can generate alerts to ease the trading process. You don't have to stay all day in front of your screen. The indicator can be used with any class of assets and with any time frame. It is possible to achieve better results trading our list of selected assets. W
                    397 USD
                    Smooth price for Monarch
                    Konstantin Gruzdev
                    5 (1)
                    The Smooth Price technical indicator is used for plotting a smoothed line as close to the price of the financial instrument as possible, and serves to eliminate its noise components. The indicator is part of the Monarch trading system, but here it is presented as an independent technical analysis tool. The indicator is based on the cluster digital filter , which, unlike the ClusterSMA , is applied directly to the price time series. Smooth Price does not redraw (except the very last, zero bar) an
                    999 USD
                    Классификатор силы тренда. Показания на истории не меняет. Изменяется классификация только незакрытого бара. По идее подобен полной системе ASCTrend, сигнальный модуль которой, точнее его аппроксимация в несколько "урезанном" виде, есть в свободном доступе, а также в терминале как сигнальный индикатор SilverTrend . Точной копией системы ASCTrend не является. Работает на всех инструментах и всех временных диапазонах. Индикатор использует несколько некоррелируемых между собой алгоритмов для класси
                    6 250 USD
                    Nostradamus
                    Andrey Spiridonov
                    Nostradamus is a powerful indicator from the set of professional trader. The indicator is based on Andrei Spiridonov's original price calculation method (ESTIMATED PRICE) for the current candle price. Advantages of the indicator The indicator does not redraw. It works on any timeframes. Works with any trading instruments. Perfectly suitable for scalping and trading binary options. Parameters ESTIMATED PRICE - indicator line color. Color - color of the ESTIMATED PRICE FUTURE line. How to wo
                    1 800 USD
                    Currency Index Watcher is a simple and user-friendly tool for whoever wish to trade Forex using currencies indexes. Currency Index Watcher is configurable and usable directly from the panel. Indexes of 8 custom currencies EUR, USD, GBP, JPY, CHF, AUD, CAD, NZD (default) Any 3-chars symbol from your market watch could be used (BTC = bitcoin, RUB = ruble, CNH = yuan etc ...) : double click the symbol label  Ability to select which currencies and made-of pairs will be analyzed : check/uncheck want
                    360 USD
                    SmartTrendMt5
                    Andrey Spiridonov
                    The SmartTrendMt5 trend indicator generates signals based on the principle of combined analysis of calculated reference points within the Keltner channel. The indicator plots the Keltner channel in a separate window (by default, red lines and a blue line - the middle of the channel), and also draws the histogram of calculated reference points for each candle (by default, the histogram bars are yellow). The should be attached to a chart of any timeframe and any trading symbol in the usual way.
                    450 USD
                    PowerBaseColour
                    Capota Adrian Ionut
                    - Trading Guide PowerBase But how do I use this indicator in the daily trading of Heikin Ashi traders?  Here are some answers and recommendations that can help you improve or create a trading system -  strategy:   Stop Loss. A very useful method to reduce the risk of a transaction is to set the stop loss even behind the last Heikin Ashi bar, assuming that if the next bar is touched the initial signal is invalidated and it is best to close with a limited loss than to you hope the market returns t
                    1 000 USD
                    Forex Relative Performance indicator This indicator calculates the relative strength of major currencies against the US dollar. The basic idea behind this indicator is "to buy strong currency and to sell weak currency". This indicator allows you to quickly identify the best forex pair to trade according to your trading style (Intraday, Scalping, Swing, or Long Term)
                    324 USD
                    The latest most requested Binary Options arrow indicator in the Garuda Signals product line is now on MT5! Binary options signal based on multiple time frame cross over analysis. Gets confirmation from the most consistent signals known to man; Ichimoku, SMA, Bollinger Bands; and also uses the 1 Hour time frame as trend confirmation , so you don't have to open up multiple chart and waste time. - Can be used for all time frames up to 1 hour, but is most POWERFUL for 1 and 5 min options. - Place yo
                    300 USD
                    SuavizadorDePrecio
                    Cesar Juan Flores Navarro
                    Funciona identificando picos de máximos y mínimos, para luego eliminarlos haciendo una linea o curva, pudiendo el usuario ingresar el valor de que tanto puede suavizar. Nos facilita poder ver la tendencia así como ver el cruce que puede hacer con otros indicadores, mostrando a simple vista los inicios y salidas de una tendencia u operación. Así también facilita la visualización de subidas y bajadas.
                    300 USD
                    Pendiente de Precio
                    Cesar Juan Flores Navarro
                    Indicador en base a la pendiente de la linea de precio, dibuja una línea de color cuando sube a base de los precios que previamente has sido procesados o linealizados, y cuando baja la pendiente la linea linealizada toma otro color. En este caso se a considerado 6 lineas de diferentes procesos desde pendientes largas hacia las cortas, observándose que cuando coincidan las pendientes se produce un máximo o mínimo, lo que a simple vista nos permitirá hacer una COMPRA O VENTA.
                    1 000 USD
                    Adx scalper arrow
                    Dmitrii Melnikov
                    2 (1)
                    Dial indicator based on one ADX indicator. Gives buy and sell signals when DI + and DI - lines intersect. The indicator works on all timeframes and currency pairs. In the premium version the signals are filtered, they are less, but they are more reliable. There are settings of the indicator period, you can experiment. ADXPeriod=14 - The period of the indicator. The indicator gives high-quality buy and sell signals, suitable for intraday trading.
                    300 USD
                    Индикатор Coefficient Of Determination (COD) представляет собой значение коэффициента детерминации или квадрат коэффициента корреляции между зависимой переменной — ценой и объясняющей переменной — тиковым объемом. Что это дает нам на практике? COD отлично распознает кульминацию трендовых движений, что позволяет подбирать оптимальные точки и ловить развороты рынка. Как использовать индикатор: Наиболее популярная торговая стратегия строится совместно с трендовым индикатором Moving Average (MA), пе
                    600 USD
                    Fibonacci Multiple 12
                    Cesar Juan Flores Navarro
                    Fibonacci Múltiple 12, utiliza la serie fibonacci plasmado en el indicador fibonacci, aumentadolo 12 veces según su secuencia. El indicador fibonacci normalmente muestra una vez, el presente indicador se mostrara 12 veces empezando el numero que le indique siguiendo la secuencia. Se puede utilizar para ver la tendencia en periodos cortos y largos, de minutos a meses, solo aumentado el numero MULTIPLICA.
                    1 000 USD
                    Recommended TimeFrame >= H1. 100% Non Repainted at any moment.  Use it carefully, only with Trend Direction. Trading Usage: 2 Variants: as Range System or as BreakOut System (Both Only With Trend Direction)::: (Always use StopLoss for minimise Risk); [1] as Range System: (Recommended) in UP TREND:  - BUY in Blue Line , then if price goes down by 50 points (on H1) open Second BUY.   Close in any Profit you wish: TrailingStop(45 points) or Close when Price touches upper Gold Line. in DOWN TR
                    5 500.95 USD
                    SWing3
                    AHMED KHALIFA AHMED ABULFATEH ALI ABULFATEH
                    5 (5)
                    Ein Indikator, der von der Liquidität und dem gleitenden Durchschnitt abhängt > der Ihnen die 98 % der richtigen Kauf- und Verkaufsentscheidung liefert. und die Zeit, den Handel zu schließen. Der PREIS wird von Zeit zu Zeit steigen > und wann der erste EA gestartet wird, hängt von diesem Indikator ab und wird mehr als 2.000 betragen. 1-wann Kauf- oder Verkaufspositionen eröffnet werden (abhängig vom Kreuz zweier Linien X und Punktberechnungen abhängig vom ausgewählten Rahmen) (das Kreuz sollte a
                    350 USD
                    En base a cálculos matemáticos de determino una linea Horizontal que cruza a todas las señales de trading, mostrando los máximos y mínimos. La linea horizontal parte en dos las subidas y bajadas de las señales de trading, de tan manera que es fácil identificar los máximos y mínimos, y es inteligente por que es sensible a las subidas y bajadas, afín de no quedarse en un solo lado por siempre, trabaja excelentemente con otros indicadores suavizadores ya que les garantiza que en un intervalo de tie
                    1 000 USD
                    INTRODUCING WORLD'S FIRST MT4 & MT5  Gann Dynamic Square and Circle To Analyze Markets Geometric Relationship. Gann Dynamic Square  has some of the most impressive features you will ever find in Gann & Geometric Analysis world. The Gann Dynamic Square is a Powerful method of squaring TIME AND PRICE .It is a free-hand drawing tool giving you control of the size of the box. The internal diagonals, grid-lines and angles can be Enabled/ Disabled. All square diagonals like 45 Degree, 60 Degree 9
                    399 USD
                    Weitere Produkte dieses Autors
                    Buy and Sell Arrows when price is about to retrace. It Also Sends Alerts – On MT4 To Your Phone To Your Email Does not repaint. Works ony any pair, any timeframe. 10 Activations allowed so you are free from limitations See an example of alerts from today (23 May 2020) using this and 2 more of my indicators  here . MT5 Version here . What is a Retracement and why is it important to you? As you know, the market goes through phases of trend and retracement. Price can only move so fa
                    297 USD
                    Buy and Sell Alerts when price breaks out following strict price action. Sends Alerts – #On MT5 To Your Phone To Your Email Does not repaint . Works on any Forex pair, any timeframe. 10 Activations allowed so you are free from limitations >> MT4 Version Here Description When the indicator detects a possible trade, it sends you an alert. It shows you where to place your trade and even suggests Stop Loss and Take Profits for you. How To Trade With The Breakout Entry Signals Indicator
                    297 USD
                    Buy and sell arrows on the chart when the trend is about to continue. Aslo Sends Alerts – On MT4 To Your Phone To Your Email. Does not repaint. Works on any pair, any timeframe.   (Just ajust the settings for your pair and timeframe.) 10 Activations allowed so you are free from limitations See an example of alerts from today (23 May 2020) using this and 2 other indicators  here . MT5 version here . The indicator provides accurate buy and sell arrows on the chart when the trend is
                    297 USD
                    Buy and Sell Arrows On The Chart According To Price Action Sends Alerts On MT4 To Your Phone To You Email Does NOT repaint. Works on any pair, any timeframe.     10 Activations allowed so you are free from limitations. MT5 Version here . When you get a signal, all you need to do is check the previous structue highs and lows to use as your stop loss and take profit. See the video below. Settings: Apart from the times you want to get signals and where you want alerts, there is only o
                    297 USD
                    Buy And Sell Signal Arrows On The Chart When The Price Is About To Reverse. Also Sends Alerts – On MT4 To Your Phone To Your Email. Does not repaint. Works on any pair, any timeframe.   (Just ajust the settings for your pair and timeframe.) 10 Activations allowed so you are free from limitations MT5 version here .   What is Price Rejection and Reversal and why is it important to you? If price shows certain signs of rejection e.g. a large wick, this often means that it will then r
                    297 USD
                    Buy and Sell Arrows when price breaks away from mean price. Sends Alerts – On MT4 To Your Phone To Your Email Does not repaint . Works on any Forex pair, any timeframe. 10 Activations allowed so you are free from limitations >> MT5 Version Here What Is The Meaning Of Mean Reversion? Mean reversion, or reversion to the mean, is  a theory used in Forex Trading which uses the fact that asset price will come back to the mean (or average) price level . Similarly, therefore, it also breaks
                    297 USD
                    Buy and Sell Signals Directly Onto Your Charts.  It couldn't be EZ-er! Aslo Gives Alerts – On Your MT4 To Your Phone To Your Email. Does not repaint! This couldn't be EZ-er to use - just drag it onto your chart (any timeframe, any pair) set the time of day you want signals and where you want alerts, and wait for the signals. How To Trade With The EZ Buy And Sell Signals Indicator:  https://youtu.be/8s5bc261460 SETTINGS: Just set the time of day you want signals and where you want alert
                    297 USD
                    Sends Alerts – On MT5 To Your Phone To Your Email Does not repaint . Works on any Forex pair, any timeframe. 10 Activations allowed so you are free from limitations >> MT4 Version Here What Is An Order Block? An Order Block  (or Banker Candle, or Institutional Candle)  is an opportunity to get very high risk to reward trades (often 5:1 or more) but you have to know how to trade them. >>>> Please see my video below on how to maximise the winners. An Order Block is formed when the banks
                    297 USD
                    Buy and Sell Alerts when price breaks out following strict price action. Sends Alerts – On MT4 To Your Phone To Your Email Does not repaint . Works on any Forex pair, any timeframe. 10 Activations allowed so you are free from limitations >> MT5 Version Here Description When the indicator detects a possible trade, it sends you an alert. It shows you where to place your trade and even suggests Stop Loss and Take Profits for you. How To Trade With The Breakout Entry Signals Indicator
                    297 USD
                    Marks Market Imbalance On The Chart As traders continue to search for the best trading indicators to guide their investments, the I mbalance / I mproper P rice A ction / F air V alue G ap I ndicator has become increasingly popular. This indicator helps to identify opportunities for taking profit . The indicator begins by scanning the markets for imbalance-improper price action events, allowing traders to immediately see when markets are not functioning efficiently. In particular, the indicator f
                    297 USD
                    Buy And Sell Arrows On The Chart When The Trend Is About To Continue. Sends Alerts – On MT5 To Your Phone To Your Email. Does not repaint. Works on any pair, any timeframe.   (Just ajust the settings for your pair and timeframe.) 10 Activations allowed so you are free from limitations See an example of alerts from today (23 May 2020) using this and 2 other indicators  here . MT4 version here. The indicator provides accurate buy and sell arrows on the chart when the trend is about
                    297 USD
                    Get The Most Out Of Your Trades! No More Sitting And Watching Your Trades All Day! Have you ever … ??? Had a trade go into good profit only to turn round and lose? Had a trade where you could have got more profit because your Take Profit was too tight? Wondered how to get the most out of your trades in a trend? Of course! We all have! Before, you had to sit and watch your trades … and trail by … A fixed amount of pips – easily done on MT4. A moving average (see Moving Average Trailing St
                    297 USD
                    The Consolidation Breakout Alerts Indicator will revolutionize your trading strategy. Our innovative indicator offers unique buy and sell arrows when price breaks out from consolidation, allowing you to get in at the most optimal entry with minimal risk and maximum reward potential. Never again will you miss out on the lucrative trading opportunities available in volatile markets. Let the Consolidation Breakout Alerts Indicator do the work for you and reap the rewards! Buy and Sell Arrows when
                    297 USD
                    The Consolidation Breakout Alerts Indicator will revolutionize your trading strategy. Our innovative indicator offers unique buy and sell arrows when price breaks out from consolidation, allowing you to get in at the most optimal entry with minimal risk and maximum reward potential. Never again will you miss out on the lucrative trading opportunities available in volatile markets. Let the Consolidation Breakout Alerts Indicator do the work for you and reap the rewards! Buy and Sell Arrows when p
                    297 USD
                    Please note:- This product has been moved and combined with the Trend Continuation Alerts Indicator here . There is an new video and instructions. Please feel free to message me if you have any questions on how best to use it ir any of my other indicators. If any of my instructions are not clear or you are not sure about hoe I am explaining them, again, please message me. Thank you.
                    5 000 USD
                    Marks Market Imbalance On The Chart. As traders continue to search for the best trading indicators to guide their investments, the   I mbalance   / I mproper   P rice   A ction   / F air   V alue   G ap   I ndicator has become increasingly popular. This indicator helps to identify opportunities   for taking profit . The indicator begins by scanning the markets for imbalance-improper price action events, allowing traders to immediately see when markets are not functioning efficiently. In particul
                    297 USD
                    Sends Alerts – On MT4 To Your Phone To Your Email Does not repaint . Works on any Forex pair, any timeframe. 10 Activations allowed so you are free from limitations >> MT5 Version Here What Is An Order Block? An Order Block  (or Banker Candle, or Institutional Candle)  is an opportunity to get very high risk to reward trades (often 5:1 or more) but you have to know how to trade them. >>>> Please see my video below on how to maximise the winners. An Order Block is formed when the banks
                    297 USD
                    Introductory Offer!  ***  Only $32 - normal price $97 !! *** Ends on 30th April - do not miss it! The Price Break Alerts Indicator is part of my suite of Price and Trendline Alerts Indicators . I'm excited to introduce the Price Break Alerts Indicator – part of my new suite of Price and Trendline Alert Indicators – fantastic tools designed to alert you of any significant prices in the markets you trade. With this indicator, you can set up to 4 price alerts on any asset, allowing you to quickl
                    32 USD
                    Introductory Offer!  *** Only $32 - normal price $97 !! *** Ends on 30th April - do not miss it! The Close Above or Below Price Indicator is part of my suite of Price and Trendline Alerts Indicators. I'm excited to introduce the  Close Above or Below Price Indicator  – part of my new suite of Price and Trendline Alert Indicators – fantastic tools designed to alert you when candles close above or below significant prices in the markets you trade. With this indicator, you can set up to 4 price al
                    32 USD
                    Please note:- This product has been moved and combined with the   Trend Continuation Alerts Indicator   here . There is an new video and instructions. Please feel free to message me if you have any questions on how best to use it ir any of my other indicators. If any of my instructions are not clear or you are not sure about hoe I am explaining them, again, please message me. Thank you.
                    5 000 USD
                    Buy and Sell Arrows when price is about to retrace. It Also Sends Alerts – On MT5 To Your Phone To Your Email Does not repaint. Works ony any pair, any timeframe. 10 Activations allowed so you are free from limitations See an example of alerts from today (23 May 2020) using this and 2 other indicators  here . MT4 Version here . What is a Retracement and why is it important to you? As you know, the market goes through phases of trend and retracement. Price can only move so far i
                    297 USD
                    Buy and Sell Arrows On The Chart According To Price Action Sends Alerts On MT5 To Your Phone To You Email Does NOT repaint. Works on any pair, any timeframe.     10 Activations allowed so you are free from limitations. MT4 Version here . When you get a signal, all you need to do is check the previous structue highs and lows to use as your stop loss and take profit. See the video below. Settings: Apart from the times you want to get signals and where you want alerts, there is only o
                    297 USD
                    Buy and Sell Arrows when price breaks away from mean price. Sends Alerts – On MT5 To Your Phone To Your Email Does not repaint . Works on any Forex pair, any timeframe. 10 Activations allowed so you are free from limitations >> MT4 Version Here What Is The Meaning Of Mean Reversion? Mean reversion, or reversion to the mean, is  a theory used in Forex Trading which uses the fact that asset price will come back to the mean (or average) price level . Similarly, therefore, it also breaks
                    297 USD
                    Auswahl:
                    Keine Bewertungen
                    Antwort auf eine Rezension
                    Version 1.1 2022.05.18
                    Minor bug fixed in Alert delay