Support and Resistance Levels Finder MT5
- Indikatoren
- Issam Kassas
- Version: 1.40
- Aktualisiert: 28 Oktober 2022
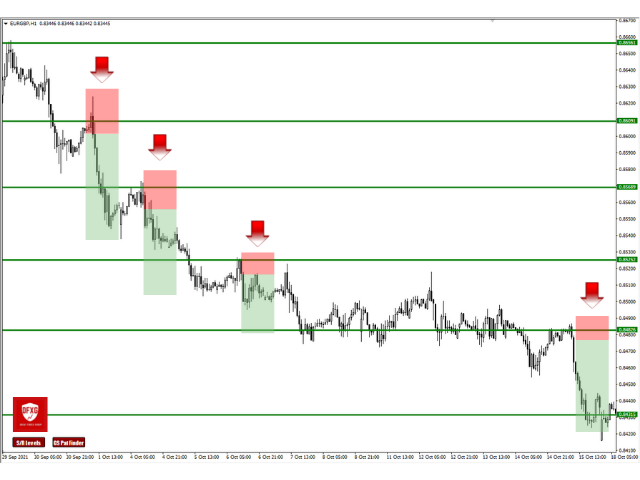
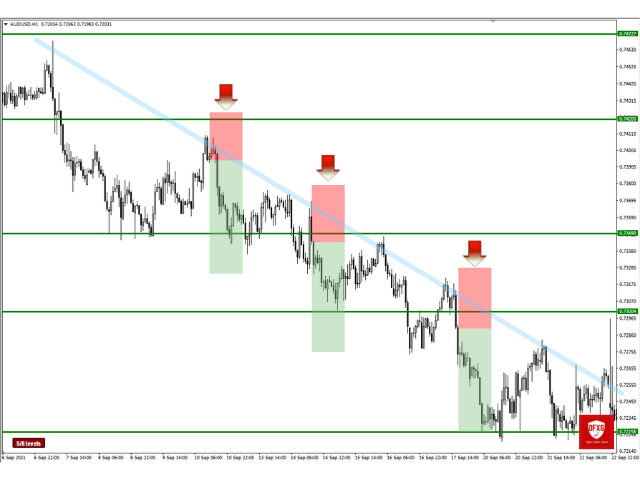
Der Unterstützungs- und Widerstandsniveaufinder:
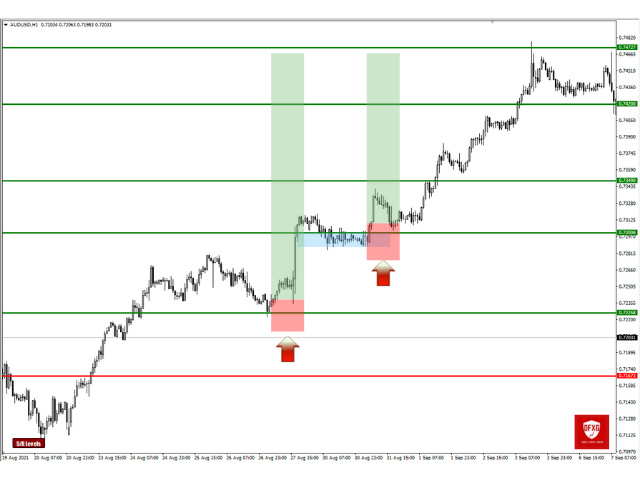
Der Unterstützungs- und Widerstandsniveaufinder ist ein fortschrittliches Werkzeug, das dazu entwickelt wurde, die technische Analyse beim Handel zu verbessern. Mit dynamischen Unterstützungs- und Widerstandsniveaus passt er sich in Echtzeit an, während sich neue Schlüsselpunkte im Chart entfalten, und bietet so eine dynamische und reaktionsschnelle Analyse. Seine einzigartige Multi-Zeitrahmen-Fähigkeit ermöglicht es Benutzern, Unterstützungs- und Widerstandsniveaus aus verschiedenen Zeitrahmen auf jedem gewünschten Zeitrahmen anzuzeigen und so eine differenzierte Perspektive zu bieten, beispielsweise indem tägliche Niveaus auf einem Fünf-Minuten-Chart angezeigt werden. Durch die Verwendung eines intelligenten Algorithmus, der historische Datensätze einbezieht, hebt er sich von anderen S&R-Indikatoren ab und gewährleistet eine umfassende Analyse. Das Tool verwendet bei der Erkennung von Niveaus Mehrparameterberechnungen, was zu seiner Genauigkeit beiträgt. Benutzer können die Farben der Unterstützungs- und Widerstandsniveaus individuell anpassen und so ein personalisiertes visuelles Erlebnis schaffen. Das Tool enthält auch Alarmfunktionen, um Händler zu benachrichtigen, wenn der Preis wichtige Niveaus erreicht, was die zeitnahe Entscheidungsfindung verbessert. Mit praktischen Funktionen wie einem Ausblenden- und Einblenden-Button sowie einer Schnelltastenfunktion zum schnellen Umschalten der Sichtbarkeit der Niveaus bietet der Unterstützungs- und Widerstandsniveaufinder eine vielseitige und benutzerfreundliche Lösung für Händler, die Präzision und Flexibilität in ihrer technischen Analyse suchen.
Eigenschaften:
- Dynamisches Unterstützungs- und Widerstandsniveau: Passt sich an, wenn sich im Chart neue wichtige Schlüsselpunkte zeigen.
- Unterstützungs- und Widerstandsniveaus für mehrere Zeitrahmen: Möglichkeit, Niveaus aus beliebigen Zeitrahmen auf jedem anderen Zeitrahmen anzuzeigen. Beispielweise tägliche Niveaus auf M5.
- Verwendet einen intelligenten Algorithmus, der historische Daten einschließt im Gegensatz zu anderen S&R-Indikatoren.
- Verwendet bei der Erkennung von Niveaus Mehrparameterberechnungen.
- Genaue Unterstützungs- und Widerstandsniveaus.
- Individuelle Farben für jedes Unterstützungs- und Widerstandsniveau.
- Alarm, wenn der Preis wichtige Niveaus erreicht.
- Kommt mit Ausblenden- und Einblenden-Button.
- Kommt mit einer Schnelltastenfunktion zum Ausblenden und Einblenden von Niveaus.


master pi