• Übersicht
  • Bewertungen (12)
  • Diskussion (52)
  • Neue Funktionen

Harmonic Pattern Scanner

4.58

** All Symbols x All Timeframes scan just by pressing scanner button **

***Contact me after the purchase to send you instructions and add you in "Harmonic Scanner group" for sharing or seeing experiences with other users.

Introduction

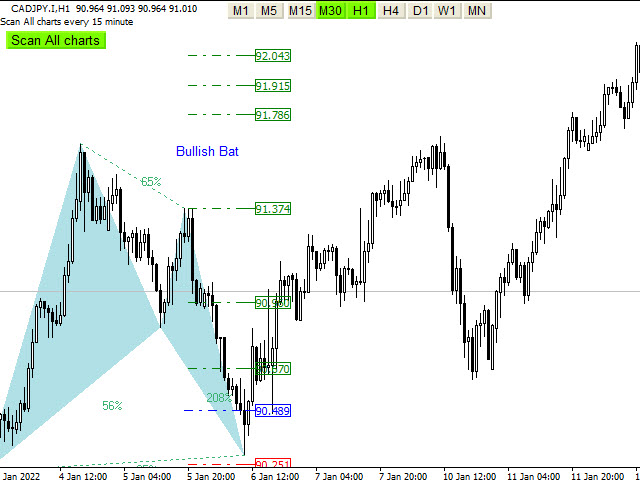
Harmonic Patterns are best used to predict turning point. Harmonic Patterns give you high win rate and high opportunities for trade in during one day. This indicator detects the best and successful patterns base on Harmonic Trading books by Mr. Scott M.

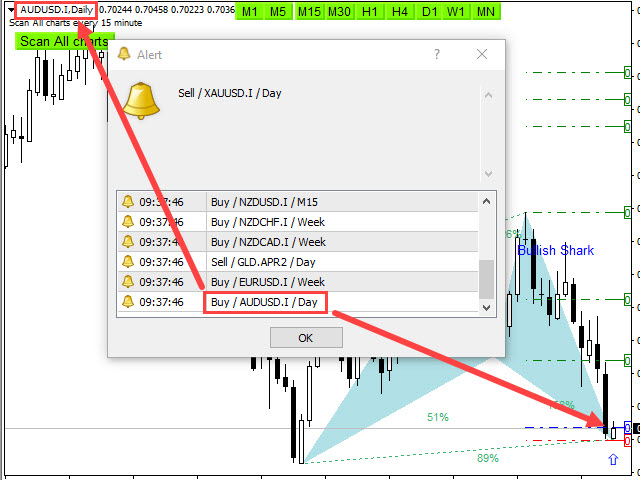
The Harmonic Patterns Scanner Scans All charts just by pressing one click. It has stop loss, Take profits and entry point levels with using Fibonacci levels and candlestick checking to find the best entry point and exit of trading. It finds signals immediately with alarm and notification for easy trading.

Main Features

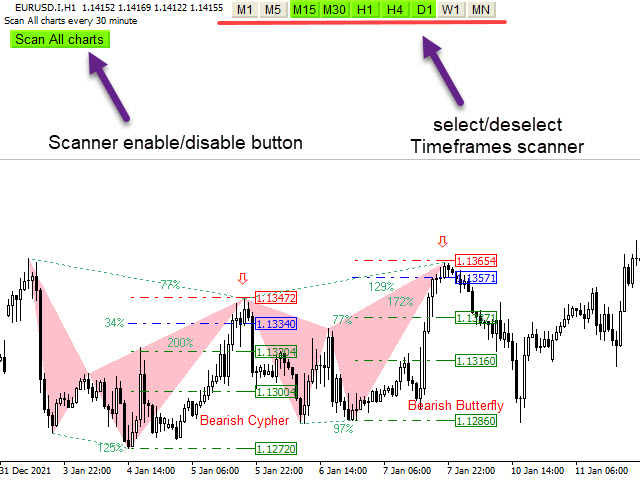
  • Detect the best and  most successful patterns : Gartley, Bat, Crab, Butterfly, Cypher, Shark, Alt Bat, Deep Crab
  • Easy-to-use and user friendly indicator
  • Scan all charts button ( Forex, Crypto, Indices and commodities )
  • Select and deselect time frames button for scan (M5,M15,M30,H1,H4,D1,W1,MN)
  • It displays and pushes notification stop-loss, entry-point and take-profit levels
  • Candlestick check for the best entry Point
  • Method to choose how appearing pattern : breakout(after breakout) or pattern(in leg 4)
  • Use Fibonacci levels
  • It draws the ABCD projection
  • Potential Reversal Zone (PRZ) detection for Reversal identification
  • Potential Continuation Zone (PCZ) detection for price movement prediction
  • Pattern Completion Interval (PCI) detection for more trading opportunities
  • Sending the alert and push notification
  • Alert enable/disable base on your setting time
  • Adjust the pattern setting

How to test:

You can download the demo version here for testing. It is free and usable on the USDCHF & AUDCHF.

Input Parameters

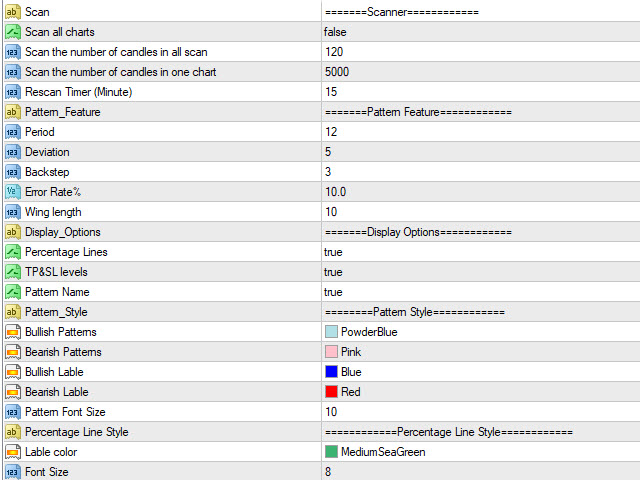
=========Scanner============

  • Scan All Charts – Scan in all charts and all time frames
  • Scan the number of candles – Amount of history bars to evaluate
  • Re-scan Timer – Re-scan all chart and all time frames after passing time
  • Method - choose how appearing a pattern : breakout(after breakout) or pattern(in leg 4)

=======Pattern Feature============

  • Pattern Feature(Period, Deviation, Back step) - Algorithm Parameters for pattern recognition
  • Error Rate – Maximum allowable error relative to pattern percentage
  • Wing length - Minimum distance between two legs in a pattern

=======Display/style Options============

  • Display Options – Display or do not display Percentage Lines, TP & SL levels or Pattern Name
  • Pattern, Percentage Line, Stop Loss/Take Profit levels and Breakout Style - Set the Fonts and colors of patterns

========ALERT SETTINGS ==========

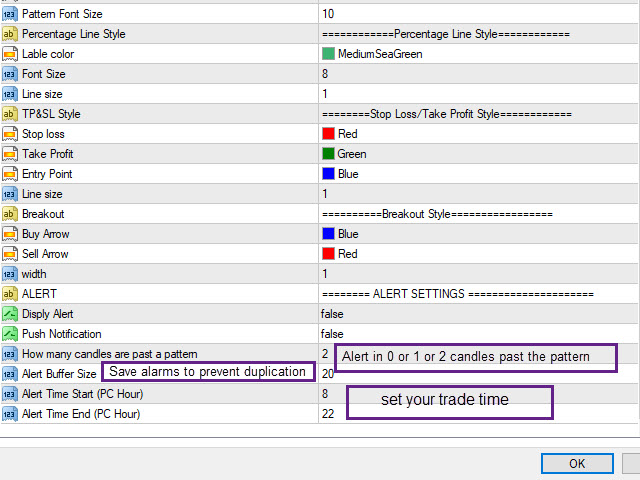
  • Display Alert or Push Notification – Enable or disable Alert or Push Notification
  • How many candles are past a pattern – Maximum Number of candles Passed from a pattern to allow alert
  • Alert Buffer Size – Maximum save alert to prevent duplicate alerts
  • Alert start/end time  – Determine trading hours based on the computer clock to activate and deactivate the alarm
      Bewertungen 12
      Chiedozie
      112
      Chiedozie 2023.02.06 12:18 
       

      I just bought the indicator and it is super great! I highly recommend

      JACK_LE_CHAT
      270
      JACK_LE_CHAT 2023.01.18 03:01 
       

      Here is a very useful, simple to use yet complete indicator. It provides accurate and reliable alerts while relieving the operator from the tedious task consisting in drawing by hand numerous and sometimes tricky to define harmonic patterns. The scanner works as a charm to find useful patterns applicable to as many instruments as one likes. Once a valid set-up is identified, the Entry / SL / TP levels displayed in a clear fashion on the chart with the graphic representation of the found pattern are logic and easy to control. They are moreover part of the alerts, which is a gain of time when setting the future trade parameters. This tool keeps its promises, and it is truly an asset when used conjointly with some other technics within the framework of a comprehensive strategy. However, even though the Harmonic Pattern Scanner is a great addition to any trader's arsenal, it is not whatever magic bullet: it shall be reminded that harmonics require some training and a good understanding of the market's dynamics to be traded properly. Aside of this, the author of this very nice and well built indicator, M. Reza, is very responsive and supportive, which is definitely a plus. Thank you and keep up the great work ! MF

      LUIS HUMBERTO LEAL MONTOYA
      575
      LUIS HUMBERTO LEAL MONTOYA 2023.01.10 01:45 
       

      Excellent indicator!!

      Empfohlene Produkte
      MetaForecast M4
      Vahidreza Heidar Gholami
      MetaForecast predicts and visualizes the future of any market based on the harmonics in price data. While the market is not always predictable, if there is a pattern in the price, MetaForecast can predict the future as accurately as possible. Compared to other similar products, Metaforecast can generate more accurate results by analyzing market trends. Input Parameters Past size Specifies the number of bars (points) that MetaForecast uses to create a model for generating future predictions. T
      69 USD
      Note : The slow loading of the indicator issue has been addressed . This new version loads fast and does not slow the platform. Version 1.3 : We have updated the indicator to include an historical bar scanning option . So instead of scanning all bars in the history (which can make the indicator slow sometimes ) , you can select the maximum number of bars it can scan which can increase the performance and make the indicator faster. This indicator scans the 1-3 Trendline pattern . The indic
      89 USD
      Market Profile
      Artem Titarenko
      5 (1)
      The "Market Profile" indicator displays the profiles and volumes of periods – weekly, daily, session (8-hour), 4-hour, hour, summary. The VAH/VAL price area is automatically highlighted by a dotted line for each profile (except for the summary). The indicator includes chroma Delta, which colors the profile areas. The areas of prevailing Buys is colored in green, that of Sells - in red. The intensity histogram features blue/red respectively. In the filter mode, the indicator displays the volume a
      100 USD
      This product shows you a different view of the market by examining the performance of volume and continuous patterns in the market, then by calculating the behavior of traders and market patterns, calculates the probability of the next movement of the market by calculations. Function. How to receive the signal: If the candlestick is currently a bullish candlestick, according to a market scan, if the next bullish candlestick is below 5%, you can open a free trade by hitting the wisdom areas.
      1 499 USD
      A useful scanner/dashboard that shows the RSI values for multiple symbols and time-frames. It can be easily hidden/displayed with a simple click on the scanner man top left of the dashboard. You can input upper and lower RSI values and the colours can be set to show when above/below these values. The default values are 70 and 30. There are also input colours for when the RSI is above or below 50 (but not exceeding the upper/lower levels Symbols and time-frames are input separated by comma
      80 USD
      Introduction to Fractal Pattern Scanner Fractal Indicator refers to the technical indicator that makes use of the fractal geometry found in the financial market. Fractal Pattern Scanner is the advanced Fractal Indicator that brings the latest trading technology after the extensive research and development work in the fractal geometry in the financial market. The most important feature in Fractal Pattern Scanner is the ability to measure the turning point probability as well as the trend probabi
      185 USD
      Cupid Signal Fx
      Damrongwit Kongtong
      The principle of this indicator is very simple: detecting the return point with Stochastic Oscillator, then monitoring the trend by using the Moving Average and finally predicting BUY and SELL signal with arrows, alerts and notifications. The parameters are fixed and automatically calculated on each timeframe. Example: If you install indicator on EURUSD, the indicator will detect the return point when the Stochastic Oscillator show "cross up" of the main line/signal line at the below position of
      95 USD
      Dieser Indikator ist ein perfekter automatischer Wellenanalyse-Indikator für den praktischen Handel! Die standardisierte Definition des Bandes ist nicht mehr eine Welle von verschiedenen Leuten, und das Ziehen von menschengemachten Interferenzen wird eliminiert, was eine Schlüsselrolle bei der gründlichen Analyse des Ansatzes spielt. =>Increase the choice of international style mode, (red fall green rise style)             Derzeit Kaufrabatt!   Inhalt des Index: 1.         Grundwelle:  
      188 USD
      Retracement Feeder
      Innovicient Limited
      5 (1)
      The Retracement Feeder checks for retracement opportunities after the first move has occurred.  Basically it scans for the second wave of trend. Works with any financial instrument,  It does not repaint/change color or cancel arrows, Easy to set and use. Works great with Renko Charts MT5 version:  https://www.mql5.com/en/market/product/71340 How it works The indicator is based on RSI and Stochastics.  The algorithm used in the Retracement Feeder allows the Stochastic and RSI to minimiz
      60 USD
      Arrows appear after Reversal-Pattern and when the confirmation-candle reaches its value, it won't disappear (no repaint). but with fix settings no additional settings necessary Entry : immediately after arrow Stop loss : a few pips above the high of the arrow - candle / below the low of the arrow - candle Take Profit : at least the next candle / move to break even after candle closed / trail the SL works on : Major Forex-pairs / M15 and higher time-frames The Value of the  confirmation-candle =>
      69 USD
      Recommended on M5 and higher timeframes Sends alerts and notifications when the zone is create Sends alerts and notifications if zones are retested You will see the trading zones and identify the most profitable points to open positions. The indicator marks the supply and demand zones. With this show you will now make profitable trades that will set the trends. Shows all support and resistance zones. Can work in all time zones. No need to mess with complicated settings, all settings are optimiz
      30 USD
      M W Pattern Pro
      Nesimeye Oswald
      4 (6)
      M & W Pattern Pro is an advanced scanner for M and W patters , it uses extra filters to ensure scanned patterns are profitable. The indicator can be used with all symbols and time frames. The indicator is a non repaint indicator with accurate statistics calculations. To use , simply scan the most profitable pair using the statistics dashboard accuracy , then enter trades on signal arrow and exit at the TP and SL levels. STATISTICS : Accuracy 1 : This is the percentage of the times price hit
      89 USD
      TheStrat Patterns
      Robert Gerald Wood
      This indicator will draw patterns based on Rob Smith's The Strat as they emerge in real time on your chart. As price evolves, TheStrat offers 18 distinct price action patterns that can help you get good entries in the market. Each pattern involves two or three candles, and this indicator will draw a bounding box around the candles and name the pattern. The indicator also shows when a potential setup is forming, known by stratters as an Actionable signal. Candles Each candle is defined by i
      90 USD
      Essential Trader
      Innovicient Limited
      The Essential Trader indicator pinpoints the important entry areas for any trading instrument you through at it. This indicator is more comfortable with whipsaw/ranging market conditions. It is not a complicated trading indicator and can be used on any timeframe with high level of confidence. Besides, it has notifications and alerts. ONLY 6 OUT OF 10 COPIES FOR $35 NEXT PRICE $48 The dotted essential points show spots where you can make immediate entries and benefit from breakout on either side
      35 USD
      The Th3Eng PipFinite indicator is based on a very excellent analysis of the right trend direction with perfect custom algorithms. It show the true direction and the best point to start trading. With StopLoss point and Three Take Profit points. Also it show the right pivot of the price and small points to order to replace the dynamic support and resistance channel, Which surrounds the price. And Finally it draws a very helpful Box on the left side on the chart includes (take profits and Stop loss
      89 USD
      NewsReady
      Joel Protusada
      NewsReady is a semi-automated Expert Advisor that uses a smart straddle methods It needs to be set in charts 2 to 10 minutes before Economic Data release with a red-flag impact on currencies related to the news. Then it run pending orders in specified number of minutes indicated in the time-period parameter. After the specified time, it will stop trading and will remove all pending orders. Important You can not backtest this tool because it is semi-automated and can only be set and run a few mi
      999 USD
      DoAid
      Samuel Akinbowale
      5 (1)
      DoAid DoAid indicator is a simple channel indicator with an advance timeframe correlation board. DoAid indicator: can be used with any instrument provided by your broker and MetaTrader, be it Currency , Commodity ,Stock, or Cryptocurrencies. DoAid indicator   can be used for swing, scalping and day trading. DoAid indicator   is also a multi time-frame indicator {MTF}. DoAid indicator can be used with any timeframe. It does not repaint.It does not repaint. When To Buy if the market
      30 USD
      ABCD Pattern Scanner
      Reza Aghajanpour
      5 (13)
      ** All Symbols x All Timeframes scan just by pressing scanner button ** *** Contact me after the purchase to send you instructions and add you in "ABCD scanner group" for sharing or seeing experiences with other users. Introduction This indicator scans AB=CD retracement patterns in all charts. The ABCD is the basic foundation for all harmonic patterns and highly repetitive with a high success rate . The ABCD Scanner indicator is a scanner reversal ABCD pattern that helps you identify when the p
      39 USD
      Price Strength
      Vincenzo Maria Arricale
      This indicator computes two lines representing the price bar strength. Close, high and low of each bar are compared with the highest high and lowest low of the last N bars, where N is a parameter set by user. Two lines are computed, a red one and a green one, with values between 0 and 100. High values of the red line means that close is very far from the bar high, while high value of the green line means price  is very far from the bar low . The indicator provides alerts when red or green line a
      30 USD
      Retracement Pip Catcher
      Christopher Graham Parish
      !! FLASH SALE !!   Over 75% off !!     For ONE week only. Now only $57 - normally $297! Ends on 31 March - Don't miss it! Buy and Sell Arrows when price is about to retrace. It Also Sends Alerts – On MT4 To Your Phone To Your Email Does not repaint. Works ony any pair, any timeframe. 10 Activations allowed so you are free from limitations See an example of alerts from today (23 May 2020) using this and 2 more of my indicators  here . MT5 Version here . What is a Retracement and
      57 USD
      Trend Ray
      Andriy Sydoruk
      The indicator shows the potential trend direction by cyclical-wave dependence. Thus, all the rays of the intersection will be optimal rays, in the direction of which the price is expected to move, taking into account the indicator period. Rays can be used as a direction for potential market movement. But we must not forget that the approach must be comprehensive, the indicator signals require additional information to enter the market.
      59 USD
      Top Gun
      Lucky Susandji
      PART #3 : TOOLS TREND MA  The tool makes it easy to get the fastest information about the movement of the pair and a measure of the strength of the momentum that is causing the trend [UPTREND | DOWNTREND]. Also when an asset is overbought or oversold that causes a reversal. Serves to provide active signals that provide recommendations for the momentum of a trend that is predicted through directional arrows. Settings adapt to individual observations & choices. Its creation is specialized
      68 USD
      Trend Line Chart Pattern Signals  Is a traders Tool for Signals based on Strong  Patterns Formed By a pair of robust trend lines. They FOR WITH DIFFERENT POPULAR PATTERNS ON CHARTS LIKE – TRIANGLES, FLAGS,RANGE , ASCENDING TRIANGLES, DESCENDING PATTERNS, PENNANTS ETC. The TREND LINES  form  dynamically  on running bars. The  sensitivity  of the trend lines can be changed by custom settings. The  Buy and Sell Signals Generate upon Break Of the Trend Line + "Close" of the same bar above the previo
      80 USD
      ArchIntel Pivot Point
      Raphael Adetunji Olaiyapo
      This tool draws all the pivot point lines on chart. It is important to remind/tell you that there are 5 pivot method according to BabyPips website. All these methods have their unique mathematical formula. 1. Floor Method. 2. Woodie Method. 3. Camarilla Method. 4. DeMark Method. 5. Fibonacci Method. What makes this pivot tool unique is that you can click the "Fibonacci" button to select the pivot method you want. You can click the "Monthly" button to select the Period you want to use for the piv
      38 USD
      My Point MT4
      Claudia Ramona Angerer
      5 (1)
      Diagnosis of major and minor pivot Trend detection with many signals Can be used in all symbols Can be used in all time frames Settings: Back Show: The number of candles it displays If you need any adjustments, or have any questions or suggestions, message me How to trade: Blue: sell signal Red: buy signal Blue and red at the same time: no signal Exit signal: Opposite signal
      90 USD
      The indicator detects and displays the White Swan and Black Swan harmonic pattern on the chart according to the scheme provided in the screenshot. The pattern is plotted by the extreme values of the ZigZag indicator (included in the resources, does not require additional installation). After detecting the pattern, the indicator notifies of that by the pop-up window, a mobile notification and an email. The indicator highlights not only the complete figure, but also the time of its formation. Duri
      30 USD
      Trend Suffer
      Philip Effiong Philip
      Alerts you on new trends, with ENTRY and EXIT points. INSTRUCTIONS  Select asset of choice, activate the indicator on the chart and just follow the signals from the arrows. ITS FREE, GIVE ME A GOOD RATING! Platform : Metatrader4 Asset : All Currencies, Gold, BTCUSD, NASDAQ PS : F or newbie and pro traders. Used by more 3,000 traders around the world. Send  a mail for further help and information...........
      30 USD
      (FOR MT4)   Ultimate Engulfing Scanner Multi Pair And Multi Time Frame :   This indicator has been designed to find the strongest engulfing patterns in the forex market. - An engulfing pattern is very simple to trade, without the need for any complicated analysis. - This patterns provides an excellent risk and reward ratio. Because your potential wins will     always be considerably larger than your potential losses. And this is CRITICAL to your long term     trading success.  - You have t
      79 USD
      I  recommend you to read the   product's blog  (manual) from start to end so that it is clear from the beginning what the indicator offers. This multi time frame and multi symbol indicator scans for engulfing and tweezer formations. The indicator can also be used in single chart mode. Combined with your own rules and techniques, this indicator will allow you to create (or enhance) your own powerful system. Features Can monitor all symbols visible in your Market Watch window at the same time. Ap
      30 USD
      Fibonacci colores
      Carlos Augusto Cedeno Rocha
      Fibonacci por color en niveles para aplicar estrategia profesional inicialmente se coloca en el punto mas alto del dia y mas bajo con esto es para ubicar operaciones a una distancia exacta con lo cual se busca generar ganancias residuales internas en el mismo dia con esto las lineas fusias es para colocar las entrdas sell y las lineas verdes amarillas van los buy
      30 USD
      Käufer dieses Produkts erwarben auch
      RelicusRoad Pro
      Relicus LLC
      4.94 (87)
      JETZT 147 $ (602 $ RABATT) - UNBEGRENZTE KONTEN - PREISERHÖHUNGEN BEIM NÄCHSTEN UPDATE - VERGESSEN SIE NICHT, EINE 5-STERNE-BEWERTUNG ZU VERLASSEN RelicusRoad Benutzerhandbuch + Schulungsvideos + Zugang zur privaten Discord-Gruppe + VIP-Status EINE NEUE ART, DEN MARKT ZU BETRACHTEN RelicusRoad ist der weltweit leistungsstärkste Handelsindikator für Forex, Futures, Kryptowährungen, Aktien und Indizes und gibt Händlern alle Informationen und Tools, die sie benötigen, um profitabel zu bleib
      147 USD
      Ultimate Sniper Dashboard
      Hispraise Chinedum Abraham
      4.78 (18)
      Ermäßigt auf $299! Die Preise können in Zukunft steigen! Lesen Sie die Beschreibung unten! Bestes Einstiegssystem für Ultimate Sniper Dashboard: ULTIMATIVE DYNAMISCHE EBENEN. (Bitte überprüfen Sie meine Produkte) Das Ultimate Sniper Dashboard funktioniert NUR auf Live-Märkten aufgrund der MT4 Multicurrency Testlimits. Wir stellen Ihnen das Ultimate-Sniper Dashboard vor! Unser bestes, das sowohl HA-Sniper, MA-Sniper und viele spezielle Modi enthält. Das Ultimate Sniper Dashboard ist ein
      299 USD
      Gold Stuff
      Vasiliy Strukov
      4.89 (147)
      Gold Stuff-Ein Trendindikator, der speziell für Gold entwickelt wurde, kann auch auf allen Finanzinstrumenten verwendet werden. Der Indikator wird nicht neu gezeichnet und verzögert sich nicht. Empfohlener Zeitrahmen H1. Nach diesem Indikator geschrieben EA Gold Stuff Berater, können Sie es in meinem Profil finden. WICHTIG! Kontaktieren Sie mich sofort nach dem Kauf, um Anweisungen und Bonus zu erhalten! DATEN Draw Arrow - inkl.aus. zeichnen von Pfeilen in einem Diagramm. Alerts-inkl.aus.
      125 USD
      Advanced Supply Demand
      Bernhard Schweigert
      4.94 (286)
      Derzeit 33% Rabatt! Die beste Lösung für jeden Anfänger oder erfahrenen Händler! Dieser Indikator ist ein einzigartiges, qualitativ hochwertiges und erschwingliches Trading-Tool, da wir eine Reihe von proprietären Funktionen und eine neue Formel integriert haben. Mit diesem Update werden Sie in der Lage sein, doppelte Zeitrahmenzonen anzuzeigen. Sie können nicht nur einen höheren TF (Zeitrahmen) anzeigen, sondern sowohl den Chart-TF als auch den höheren TF: SHOWING NESTED ZONES. Alle Supply Dema
      148 USD
      A top and bottom indicator that can intuitively identify the trend of the band. It is the best choice for manual trading, without redrawing or drifting. How to get this indicator for free: Learn more For any novice and programming trading friend, you can write the signal into the EA to play freely. Array 3 and array 4, for example, 3>4 turns green, 3<4 turns red. If you don't understand, please contact me. Original price of USD 198 ( current price of USD 69 ) - Next update price increase- unlimi
      69 USD
      DERZEIT 26% RABATT Die beste Lösung für jeden Newbie oder Expert Trader! Dieser Indikator ist ein einzigartiges, qualitativ hochwertiges und erschwingliches Trading-Tool, da wir eine Reihe von proprietären Funktionen und eine neue Formel integriert haben. Mit nur EINEM Chart können Sie die Währungsstärke für 28 Forex-Paare ablesen! Stellen Sie sich vor, wie sich Ihr Handel verbessern wird, weil Sie in der Lage sind, den genauen Auslösungspunkt eines neuen Trends oder einer Scalping-Gelegenh
      148 USD
      Scalper Vault
      Oleg Rodin
      5 (11)
      Scalper Vault ist ein professionelles Scalping-System, das Ihnen alles bietet, was Sie für erfolgreiches Scalping benötigen. Dieser Indikator ist ein komplettes Handelssystem, das von Forex- und Binäroptionshändlern verwendet werden kann. Der empfohlene Zeitrahmen ist M5. Das System liefert Ihnen genaue Pfeilsignale in Richtung des Trends. Es liefert Ihnen auch Top- und Bottom-Signale und Gann-Marktniveaus. Die Indikatoren bieten alle Arten von Warnungen, einschließlich PUSH-Benachrichtigungen.
      65 USD
      DERZEIT 31% RABATT! Die beste Lösung für jeden Newbie oder Expert Trader! Dieser Indikator ist ein einzigartiges, qualitativ hochwertiges und erschwingliches Handelsinstrument, da wir eine Reihe von proprietären Funktionen und eine geheime Formel eingebaut haben. Mit nur EINEM Chart liefert er Alerts für alle 28 Währungspaare. Stellen Sie sich vor, wie sich Ihr Handel verbessern wird, weil Sie in der Lage sind, den genauen Auslösepunkt eines neuen Trends oder einer Scalping-Gelegenheit zu e
      88 USD
      Owl smart levels
      Sergey Ermolov
      5 (7)
      Indikator-Leitfaden  |  Owl Smart Levels-Strategie  |   MT5-Version  |  Wie installiert man?   |   FAQ Der   Owl Smart Levels Indikator   ist ein komplettes Handelssystem innerhalb eines Indikators, der so beliebte Marktanalysetools wie die   fortschrittlichen Fraktale von Bill Williams , Valable ZigZag, das die   richtige Wellenstruktur   des Marktes aufbaut, und   Fibonacci-Levels , die die genauen Einstiegslevels markieren, enthält in den Markt und Orte, um Gewinne mitzunehmen. Eine detailli
      97 USD
      Ultimate Dynamic Levels
      Hispraise Chinedum Abraham
      4.86 (7)
      Derzeit auf Urlaub Rabatt bei $ 399! Die Preise können in Zukunft steigen. Lesen Sie die Beschreibung unten!  Einführung von Ultimate Dynamic Levels - der BESTE Einstiegsindikator für das Ultimate Sniper Dashboard! Extrem risikoarme, rechtzeitige Einstiege und hohe RR!! Finden Sie das Ultimate Sniper Dashboard HIER. Die wichtigste Fähigkeit sowohl für Anfänger als auch für Profis ist es, genau zu erkennen, wo und wann ein Markt am wahrscheinlichsten dreht, und wie man sicher einsteigt und mi
      199 USD
      Italo Volume Indicator
      Italo Santana Gomes
      4.96 (70)
      BUY INDICATOR AND GET EA FOR FREE AS A BONUS + SOME OTHER GIFTS! ITALO VOLUME INDICATOR  is the best volume indicator ever created, and why is that? The Indicator works on all time-frames and assets, indicator built after 6 years of experience on forex and many other markets. You know many volume indicators around the internet are not complete, does not help, and it's difficult to trade, but the Italo Volume Indicator is different , the Italo Volume Indicator shows the wave volume, when market
      65 USD
      Werden Sie Breaker Trader und profitieren Sie von Änderungen der Marktstruktur, wenn sich der Preis umkehrt. Der Order Block Breaker Indikator zeigt an, wann sich eine Trend- oder Preisbewegung der Erschöpfung nähert und bereit ist, sich umzukehren. Es weist Sie auf Änderungen in der Marktstruktur hin, die normalerweise auftreten, wenn eine Umkehrung oder ein größerer Rückzug bevorsteht. Der Indikator verwendet eine proprietäre Berechnung, die Ausbrüche und Preisdynamik identifiziert. Jedes
      49 USD
      ICT, SMC, SMART MONEY CONCEPTS, SMART MONEY, Smart Money Concept, Support and Resistance, Trend Analysis, Price Action, Market Structure, Order Blocks, BOS/CHoCH,   Momentum Shift, HH/LL/HL/LH,    Fair Value Gap, FVG,  Premium  &   Discount   Zones, Fibonacci Retracement, OTE, Buy Side Liquidity, Sell Side Liquidity, BSL/SSL Taken, Equal Highs & Lows, MTF Dashboard, Multiple Time Frame, BigBar, HTF OB, HTF Market Structure,  Liquidity Voids, Long Wicks, Candle Timer, Fractals, ZigZag, Time Zone,
      63 USD
      Entry Points Pro
      Yury Orlov
      4.72 (214)
      Dies ist ein Indikator für MT4, der genaue Signale für den Einstieg in einen Handel ohne Repainting (Neuzeichnen) liefert. Er kann auf alle Finanzwerte angewendet werden: Forex, Kryptowährungen, Metalle, Aktien, Indizes. Er liefert ziemlich genaue Schätzungen und sagt Ihnen, wann es am besten ist, eine Position zu eröffnen und zu schließen. Sehen Sie sich das Video (6:22) mit einem Beispiel für die Verarbeitung nur eines Signals an, das sich für den Indikator gelohnt hat! Die meisten Händler ver
      125 USD
      Cycle Sniper
      Elmira Memish
      4.6 (30)
      NEW YEAR SALE PRICE FOR LIMITED TIME!!! Please contact us after your purchase and we will send you the complimentary indicators to complete the system. Cycle Sniper is not a holy grail but when you use it in a system which is explained in the videos, you will feel the difference. If you are not willing to focus on the charts designed with Cycle Sniper and other free tools we provide, we recommend not buying this indicator. We recommend watching the videos about the indiactor and system before
      200 USD
      Derzeit 20% Rabatt! Die beste Lösung für jeden Neueinsteiger oder Expert Händler! Dieses Dashboard arbeitet mit 28 Währungspaaren. Es basiert auf 2 unserer Hauptindikatoren (Advanced Currency Strength 28 und Advanced Currency Impulse). Es bietet einen hervorragenden Überblick über den gesamten Forex-Markt. Es zeigt die Werte der Advanced Currency Strength, die Veränderungsrate der Währungen und die Signale für 28 Devisenpaare in allen (9) Zeitrahmen. Stellen Sie sich vor, wie sich Ihr Hande
      199 USD
      PRO Renko System ist ein hochpräzises Handelssystem, das speziell für den Handel mit RENKO-Charts entwickelt wurde. Dies ist ein universelles System, das auf verschiedene Handelsinstrumente angewendet werden kann. Das System neutralisiert effektiv so genannte Marktgeräusche, die Ihnen Zugang zu genauen Umkehrsignalen geben. Der Indikator ist sehr einfach zu bedienen und hat nur einen Parameter, der für die Signalerzeugung verantwortlich ist. Sie können das Tool einfach an jedes Handelsinstr
      75 USD
      Trend Screener
      STE S.S.COMPANY
      4.75 (57)
      Trendindikator, bahnbrechende, einzigartige Lösung für Trendhandel und -filterung mit allen wichtigen Trendfunktionen in einem Tool! Es handelt sich um einen 100 % nicht neu zu malenden Multi-Timeframe- und Multi-Währungs-Indikator, der für alle Symbole/Instrumente verwendet werden kann: Forex, Rohstoffe, Kryptowährungen, Indizes und Aktien. Trend Screener ist ein effizienter Trendfolgeindikator, der Pfeiltrendsignale mit Punkten im Diagramm liefert. Die Funktionen, die im Trendanalysator-Indika
      50 USD
      Dieses Dashboard ist ein Warntool zur Verwendung mit dem Indikator für die Umkehrung der Marktstruktur. Sein Hauptzweck besteht darin, Sie auf Umkehrmöglichkeiten in bestimmten Zeitrahmen und auch auf die erneuten Tests der Warnungen (Bestätigung) aufmerksam zu machen, wie es der Indikator tut. Das Dashboard ist so konzipiert, dass es auf einem eigenen Chart sitzt und im Hintergrund arbeitet, um Ihnen Benachrichtigungen zu Ihren ausgewählten Paaren und Zeitrahmen zu senden. Es wurde entwickelt,
      49 USD
      Trend Scanner GS
      Vasiliy Strukov
      5 (15)
      Trend Scanner scannt Markttrends aus Multi-Symbolen und Multi-Time-Frames und zeigt sie auf einem beweglichen Panel auf dem Chart an, den er zur Analyse verwendet. Der Händler kann mehrere Paare seiner Wahl zur Anzeige auswählen. Trend Scanner ist ein großartiges Tool, um die Richtung des Trends zu sehen, und kann für den manuellen Handel oder den EA-Handel verwendet werden, indem nur Kauf- oder Verkaufsaufträge gemäß dem Trend zugelassen werden. Echtzeit-Ergebnisse können hier eingesehen wer
      125 USD
      Blahtech Supply Demand
      Blahtech Limited
      4.62 (34)
      Supply Demand uses previous price action to identify potential imbalances between buyers and sellers. The key is to identify the better odds zones, not just the untouched ones. Blahtech Supply Demand indicator delivers functionality previously unavailable on any trading platform. This 4-in-1 indicator not only highlights the higher probability zones using a multi-criteria strength engine, but also combines it with multi-timeframe trend analysis, previously confirmed swings and engulfing detector
      142 USD
      M1 Arrow
      Oleg Rodin
      5 (6)
      Eine Intraday-Strategie, die auf zwei Grundprinzipien des Marktes basiert. Der Algorithmus basiert auf der Analyse von Volumina und Preiswellen mit zusätzlichen Filtern. Der intelligente Algorithmus des Indikators gibt nur dann ein Signal, wenn sich zwei Marktfaktoren zu einem vereinen. Der Indikator berechnet Wellen eines bestimmten Bereichs auf dem M1-Diagramm unter Verwendung der Daten des höheren Zeitrahmens. Und um die Welle zu bestätigen, verwendet der Indikator eine Volumenanalyse. Dieser
      65 USD
      Der ADR-Umkehrindikator zeigt Ihnen auf einen Blick, wo der Preis derzeit im Verhältnis zu seiner normalen durchschnittlichen Tagesspanne gehandelt wird. Sie erhalten sofortige Benachrichtigungen per Pop-up, E-Mail oder Push, wenn der Preis seine durchschnittliche Spanne und darüber liegende Niveaus Ihrer Wahl überschreitet, sodass Sie schnell in Pullbacks und Umkehrungen einsteigen können. Der Indikator zeichnet horizontale Linien auf dem Chart an den durchschnittlichen täglichen Range-Extreme
      49 USD
      Italo Trend Indicator
      Italo Santana Gomes
      4.76 (29)
      BUY INDICATOR AND GET EA FOR FREE AS A BONUS + SOME OTHER GIFTS! ITALO TREND INDICATOR  is the best trend indicator on the market, the Indicator works on all time-frames and assets, indicator built after 6 years of experience on forex and many other markets. You know many trend indicators around the internet are not complete, does not help, and it's difficult to trade, but the Italo Trend Indicator is different , the Italo Trend Indicator shows the signal to buy or sell, to confirm the signal t
      65 USD
      Strong Support
      Vasiliy Strukov
      5 (14)
      Unterstützungs- und Widerstandsniveaus sind seit der Antike ein mächtiges Werkzeug für die Marktanalyse. Strong Support Der Indikator baut Unterstützungsniveaus auf lokalen Preistiefs und Widerstandsniveaus auf lokalen Preishochs auf.  Meine anderen Entwicklungen finden Sie hier Es wird empfohlen, in Verbindung mit einem Trendindikator wie Gold Stuff zu verwenden, um den Trend zu handeln und gleichzeitig Konsolidierungs- oder Umkehrzonen zu definieren sowie Stop-Loss und Take-Profit auf Unt
      125 USD
      TrendLine PRO MT4
      Evgenii Aksenov
      4.88 (248)
      The Trend Line PRO indicator is an independent trading strategy. It shows the trend change, the entry point to the transaction, as well as automatically calculates three levels of Take Profit and Stop Loss protection Trend Line PRO is perfect for all Meta Trader symbols: currencies, metals, cryptocurrencies, stocks and indices Advantages of Trend Line PRO Never redraws its signals The possibility of using it as an independent strategy It has three automatic levels Take Profit and Stop Loss leve
      75 USD
      Das RSI / TDI-Warnungs-Dashboard ermöglicht es Ihnen, RSIs (von Ihnen wählbar) für jedes wichtige Paar, das Sie handeln, sofort zu überwachen. Sie können es auf zwei Arten verwenden: 1. Wählen Sie mehrere Zeitrahmen aus und der Strich zeigt Ihnen, wenn es mehrere Zeitrahmen gibt, die über die normalen Handelsbedingungen hinausgehen. Ein großartiger Indikator dafür, dass der Preis in letzter Zeit stark nach oben gedrückt hat, da er über mehrere Zeiträume hinweg ein überkauftes oder überver
      49 USD
      Forex Master Pattern MT4
      Alberto Gauer Borrego
      4.62 (13)
      The Forex Master Pattern  is an alternative form of technical analysis that provides a framework which will help you to find and follow the hidden price pattern that reveals the true intentions of financial markets. This algorithm here does a good job detecting the Phase 1 of the Forex Master Pattern cycle, which is the contraction point (or Value).  On Phase 2 we get higher timeframe activation (also called Expansion), which is where price oscillates above and below the average price defined
      49 USD
      Der Forex TPA Indikator deckt die wahren Aktionen der Marktmacher auf, immer dann wenn sie passieren. "Kämpfe nicht gegen die Marktmacher an, sondern folge ihnen", ist wohl der beste Rat, den ein Trader bekommen kann. Der TPA Indikator zeigt jedesmal seine Signale an wenn die Bullen definitiv stärker sind als die Bären und umgekehrt. Dieser Indikator wurde VON Tradern FÜR Trader gemacht und ist 100% NICHT NACHZEICHNEND! Signale werden STRENG am Schluss einer Kerze  generiert. Das sagen unsere Ku
      168 USD
      Supply and Demand Dashboard PRO
      Bernhard Schweigert
      4.79 (19)
      Derzeit 20% reduziert! Dieses Dashboard ist eine sehr leistungsfähige Software, die mit mehreren Symbolen und bis zu 9 Zeitrahmen arbeitet. Es basiert auf unserem Hauptindikator (Beste Bewertungen: Advanced Supply Demand ).   Das Dashboard gibt einen guten Überblick. Es zeigt: Gefilterte Angebots- und Nachfragewerte einschließlich der Zonenstärkebewertung, Pips-Abstände zu/und innerhalb von Zonen, Es hebt verschachtelte Zonen hervor, Es gibt 4 Arten von Alarmen für die gewählten Symbole in
      199 USD
      Weitere Produkte dieses Autors
      Swing Scanner
      Reza Aghajanpour
      4.6 (20)
      ** All Symbols x All Timeframes scan just by pressing scanner button ** *** Contact me after the purchase to send you instructions and add you in "Swing scanner group" for sharing or seeing experiences with other users. CURRENT PRICE $39..... Future Price $200 Introduction: Swing Scanner is the indicator designed to detect swings in the direction of the trend and possible reversal swings. The indicator studies several price and time vectors to track the aggregate trend direction and detects si
      39 USD
      Market Structure MT5
      Reza Aghajanpour
      5 (1)
      **   All Symbols   x   All Timeframes   scan just by pressing scanner button ** *** Contact me immediately after the purchase to send you instructions and add you in "Market Structure group" for sharing or seeing experiences with other users. CURRENT PRICE $39..... Future Price $200 Introduction: Market structure is important for both new and professional traders since it can influence the liquidity and price action of a market. It’s also one of the most commonly used techniques to understand tr
      39 USD
      Trend Reversal MT4
      Reza Aghajanpour
      5 (4)
      **   All Symbols   x   All Timeframes   scan just by pressing scanner button ** *** Contact me after the purchase to send you instructions and add you in "Trend Reversal group" for sharing or seeing experiences with other users. CURRENT PRICE $39..... Future Price $200 Introduction: Trendlines are the most famous technical analysis in trading . Trendlines continually form on the charts of markets across all the different timeframes providing huge opportunities for traders to jump in and profit o
      39 USD
      Market Structure
      Reza Aghajanpour
      4.6 (10)
      ** All Symbols x All Timeframes scan just by pressing scanner button ** *** Contact me immediately after the purchase to send you instructions and add you in "Market Structure group" for sharing or seeing experiences with other users. CURRENT PRICE $39..... Future Price $200 Introduction: Market structure is important for both new and professional traders since it can influence the liquidity and price action of a market. It’s also one of the most commonly used techniques to understand trends, id
      39 USD
      ** All Symbols x All Timeframes scan just by pressing scanner button ** ***Contact me after purchase to send you instructions and add you in "123 scanner group" for sharing or seeing experiences with other users. After 15 years of experience in the markets and 3 years of programming, Winner indicator is ready. I would like to share with you! Introduction The 123 Pattern Scanner indicator with a special enhanced algorithm is a very repetitive common pattern finder with a high success rate . Inte
      39 USD
      Head and Shoulder MT4
      Reza Aghajanpour
      5 (2)
      **   All Symbols   x   All Timeframes   scan just by pressing scanner button ** *** Contact me after the purchase to send you instructions and add you in "Head & Shoulders Scanner group" for sharing or seeing experiences with other users. CURRENT PRICE $39..... Future Price $200 Introduction: Head and Shoulders   Pattern  is a very repetitive common type of price reversal patterns. The pattern appears on all time frames and can be used by all types of traders and investors.   The  Head and Shoul
      39 USD
      M W Scanner MT5
      Reza Aghajanpour
      5 (2)
      **   All Symbols   x   All Timeframes   scan just by pressing scanner button ** *** Contact me after the purchase to send you instructions and add you in "M W Scanner group" for sharing or seeing experiences with other users. CURRENT PRICE $39..... Future Price $200 Introduction: Double Top(M) and Double Bottom(W) is a very repetitive common type of price reversal patterns. Double Top resembles M pattern and indicates bearish reversal whereas Double Bottom resembles W pattern and indicates a bul
      39 USD
      ** All Symbols x All Timeframes scan just by pressing scanner button ** ***Contact me after purchase to send you instructions and add you in "All Divergences scanner group" for sharing or seeing experiences with other users. CURRENT PRICE $49 ..... Future Price $200 Introduction Divergence is a main technique used to determine trend reversing when it’s time to sell or buy because prices are likely to drop or pick in the charts. All Divergence indicator can help you locate the top and bottom of t
      49 USD
      Order Block Scanner
      Reza Aghajanpour
      5 (1)
      ** All Symbols x All Timeframes scan just by pressing scanner button ** *** Contact me after the purchase to send you instructions and add you in "Order Block group" for sharing or seeing experiences with other users. CURRENT PRICE $39..... Future Price $200 Introduction: The central banks and financial institutions mainly drive the market, Order block is considered a market behavior that indicates accumulation of orders from banks and institutions, then the market tends to make a sharp move(Imb
      39 USD
      ** All Symbols x All Timeframes scan just by pressing scanner button ** *** Contact me after the purchase to send you instructions and add you in "ABCD scanner group" for sharing or seeing experiences with other users. Introduction This indicator scans AB=CD retracement patterns in all charts. The ABCD is the basic foundation for all harmonic patterns and highly repetitive with a high success rate . The ABCD Scanner indicator is a scanner reversal ABCD pattern that helps you identify when the pr
      39 USD
      Wolfe Wave Scanner MT4
      Reza Aghajanpour
      5 (4)
      **  All Symbols  x  All Timeframes  scan just by pressing scanner button ** *** Contact me after the purchase to send you instructions and add you in "Wolfe Wave Scanner group" for sharing or seeing experiences with other users. Introduction: A Wolfe Wave is created with five-wave patterns in price. It shows supply and demand and a fight towards a balance price. T hese waves of price actions can help traders identify the boundaries of   the trend . Also  It helps forecast how the price will move
      39 USD
      Swing Scanner MT5
      Reza Aghajanpour
      5 (2)
      **   All Symbols   x   All Timeframes   scan just by pressing scanner button ** ***Contact me after the purchase to send you instructions and add you in "Swing scanner group" for sharing or seeing experiences with other users. CURRENT PRICE $39..... Future Price $200 Introduction: Swing Scanner   is the indicator designed to detect swings in the direction of the trend and possible reversal swings. The indicator studies several price and time vectors to track the aggregate trend direction and de
      39 USD
      The 1 2 3 Pattern Scanner
      Reza Aghajanpour
      4.74 (43)
      ** All Symbols x All Timeframes scan just by pressing scanner button ** After 15 years of experience in the markets and 3 years of programming, Winner indicator is ready. I would like to share with you! *** Contact me after purchase to send you instructions and add you in "123 scanner group" for sharing or seeing experiences with other users. Introduction The 123 Pattern Scanner indicator with a special enhanced algorithm is a very repetitive common pattern finder with a high success rate . Inte
      39 USD
      M W Scanner
      Reza Aghajanpour
      5 (3)
      **   All Symbols   x   All Timeframes   scan just by pressing scanner button ** *** Contact me after the purchase to send you instructions and add you in "M W Scanner group" for sharing or seeing experiences with other users. CURRENT PRICE $39..... Future Price $200 Introduction: Double Top(M) and Double Bottom(W) is a very repetitive common type of price reversal patterns. Double Top resembles M pattern and indicates bearish reversal whereas Double Bottom resembles W pattern and indicates a bul
      39 USD
      ** All Symbols x All Timeframes scan just by pressing scanner button ** ***Contact me after purchase to send you instructions and add you in "RSI scanner group" for sharing or seeing experiences with other users. Introduction RSI divergence is a main technique used to determine trend reversing when it’s time to sell or buy because prices are likely to drop or pick in the charts. The RSI Divergence indicator can help you locate the top and bottom of the market. This indicator finds Regular diver
      30 USD
      Channel Scanner
      Reza Aghajanpour
      5 (4)
      ** All Symbols x All Timeframes scan just by pressing scanner button ** *** Contact me after the purchase to send you instructions and add you in "Channel Scanner group" for sharing or seeing experiences with other users. Introduction: The Channel pattern is described as the area located between two trend lines. This area is used for a measure of a trading range. In this case, the upper trend line connects price highs while the lower trend line connects price lows. Also when it comes to breakout
      39 USD
      RSI Divergence Scanner
      Reza Aghajanpour
      4.55 (11)
      ** All Symbols x All Timeframes scan just by pressing scanner button ** ***Contact me after purchase to send you instructions and add you in "RSI scanner group" for sharing or seeing experiences with other users. Introduction RSI divergence is a main technique used to determine trend reversing when it’s time to sell or buy because prices are likely to drop or pick in the charts. The RSI Divergence indicator can help you locate the top and bottom of the market. This indicator finds Regular div
      30 USD
      Wolfe Wave Scanner MT5
      Reza Aghajanpour
      5 (1)
      **  All Symbols  x  All Timeframes  scan just by pressing scanner button ** *** Contact me after the purchase to send you instructions and add you in "Wolfe Wave Scanner group" for sharing or seeing experiences with other users. Introduction: A Wolfe Wave is created with five-wave patterns in price. It shows supply and demand and a fight towards a balance price. T hese waves of price actions can help traders identify the boundaries of   the trend . Also  It helps forecast how the price will move
      39 USD
      **   All Symbols   x   All Timeframes   scan just by pressing scanner button ** *** Contact me after the purchase to send you instructions and add you in "Order Block group" for sharing or seeing experiences with other users. CURRENT PRICE $39..... Future Price $200 Introduction: The central banks and financial institutions mainly drive the market,   Order block is considered a market behavior that indicates accumulation of orders from banks and institutions, then   the market tends to make a sh
      39 USD
      ** All Symbols x All Time frames scan just by pressing scanner button ** *** Contact me after the purchase to send you instructions and add you in "Harmonic Scanner group" for sharing or seeing experiences with other users. Introduction Harmonic Patterns are best used to predict turning point. Harmonic Patterns give you high win rate and high opportunities for trade in during one day. This indicator detects the best and successful patterns based on Harmonic Trading concepts . The   Harmonic Patt
      39 USD
      ABCD Pattern Scanner
      Reza Aghajanpour
      5 (13)
      ** All Symbols x All Timeframes scan just by pressing scanner button ** *** Contact me after the purchase to send you instructions and add you in "ABCD scanner group" for sharing or seeing experiences with other users. Introduction This indicator scans AB=CD retracement patterns in all charts. The ABCD is the basic foundation for all harmonic patterns and highly repetitive with a high success rate . The ABCD Scanner indicator is a scanner reversal ABCD pattern that helps you identify when the p
      39 USD
      Market Heartbeat
      Reza Aghajanpour
      5 (3)
      Market Heartbeat in your hand! Introduction The Market Heartbeat indicator with a special enhanced algorithm (volume, money flow, cycle of market and a secret value) is a very repetitive trend finder with a high success rate . Interestingly, this Winner indicator indicates that the trend has changed its direction or the end of a trend retracement or even appears at the range market. The Market Heartbeat can use in scalping trading or trend trading. It finds immediately with alarm, notification a
      39 USD
      Supply Demand Scalper
      Reza Aghajanpour
      5 (1)
      *** Contact me after purchase to send you instructions. Introduction : Supply and demand zones are a popular analysis technique. The zones are the periods of sideways price action that come before explosive price moves. The Supply Demand Scalper indicator with a special enhanced algorithm is a very repetitive common price action and trend finder with a high success rate . The Supply Demand Scalper indicator draws zones with trend line for finding the best time to enter or exit a trade. This in
      39 USD
      You can download the Full version here with more features . Introduction: Market structure is important for both new and professional traders since it can influence the liquidity and price action of a market. It’s also one of the most commonly used techniques to understand trends, identify potential reversal points, and get a feel for current market conditions.  it provides incredible insight into how the market is behaving. It can provide vital signals about where the price action is heading n
      FREE
      **   All Symbols   x   All Timeframes   scan just by pressing scanner button ** *** Contact me after the purchase to send you instructions and add you in "Channel Scanner group" for sharing or seeing experiences with other users. Introduction: The Channel pattern is described as the area located between two trend lines. This area is used for a measure of a trading range. In this case, the upper trend line connects price highs while the lower trend line connects price lows. Also when it comes to
      39 USD
      You can download the Full version   here. Introduction: The central banks and financial institutions mainly drive the market,   Order block is considered a market behavior that indicates accumulation of orders from banks and institutions, then   the market tends to make a sharp move(Imbalance) on either side once the order block is completed. On the other hand, mostly the price pullback to   order block zone and then   reverse   sharply   again . The Order Block Scanner indicator   detects imbal
      FREE
      Order Block Limited
      Reza Aghajanpour
      4 (1)
      You can download the Full version   here. Introduction: The central banks and financial institutions mainly drive the market, Order block is considered a market behavior that indicates accumulation of orders from banks and institutions, then the market tends to make a sharp move(Imbalance) on either side once the order block is completed. On the other hand, mostly the price pullback to order block zone and then reverse sharply again . The Order Block Scanner indicator detects imbalance movement,
      FREE
      ** All Symbols x All Timeframes scan just by pressing scanner button ** *** Contact me after purchase to send you instructions and add you in "Divergence group" for sharing or seeing experiences with other users. Introduction MACD divergence is a main technique used to determine trend reversing when it’s time to sell or buy because prices are likely to drop or pick in the charts. The MACD Divergence indicator can help you locate the top and bottom of the market. This indicator finds Regular dive
      30 USD
      **   All Symbols   x   All Timeframes   scan just by pressing scanner button ** *** Contact me after the purchase to send you instructions and add you in "Trend Reversal group" for sharing or seeing experiences with other users. CURRENT PRICE $39..... Future Price $200 Introduction: Trendlines are the most famous technical analysis in trading . Trendlines continually form on the charts of markets across all the different timeframes providing huge opportunities for traders to jump in and profit o
      39 USD
      You can download the Full version   here . Introduction: Trendlines are the most famous   technical analysis in trading . Trendlines continually form on the charts of markets across all the different timeframes providing huge opportunities for traders to jump in and profit on the action. In the other hand,  The trendline reversal strategy has high win rate on the price action in the market that let You catch the big fish at the edge of the waterfall. The Trend Reversal indicator   has stop loss
      FREE
      Auswahl:
      Chiedozie
      112
      Chiedozie 2023.02.06 12:18 
       

      I just bought the indicator and it is super great! I highly recommend

      Reza Aghajanpour
      53285
      Antwort vom Entwickler Reza Aghajanpour 2023.02.06 12:25
      Thank you for your awesome feedback.
      Enjoy your trading. 🌹🌹🙏
      ⭐⭐⭐⭐⭐
      JACK_LE_CHAT
      270
      JACK_LE_CHAT 2023.01.18 03:01 
       

      Here is a very useful, simple to use yet complete indicator. It provides accurate and reliable alerts while relieving the operator from the tedious task consisting in drawing by hand numerous and sometimes tricky to define harmonic patterns. The scanner works as a charm to find useful patterns applicable to as many instruments as one likes. Once a valid set-up is identified, the Entry / SL / TP levels displayed in a clear fashion on the chart with the graphic representation of the found pattern are logic and easy to control. They are moreover part of the alerts, which is a gain of time when setting the future trade parameters. This tool keeps its promises, and it is truly an asset when used conjointly with some other technics within the framework of a comprehensive strategy. However, even though the Harmonic Pattern Scanner is a great addition to any trader's arsenal, it is not whatever magic bullet: it shall be reminded that harmonics require some training and a good understanding of the market's dynamics to be traded properly. Aside of this, the author of this very nice and well built indicator, M. Reza, is very responsive and supportive, which is definitely a plus. Thank you and keep up the great work ! MF

      Reza Aghajanpour
      53285
      Antwort vom Entwickler Reza Aghajanpour 2023.01.18 05:20
      Thank you for your awesome feedback.
      Enjoy your trading. 🌹🌹🙏
      ⭐⭐⭐⭐⭐
      LUIS HUMBERTO LEAL MONTOYA
      575
      LUIS HUMBERTO LEAL MONTOYA 2023.01.10 01:45 
       

      Excellent indicator!!

      Reza Aghajanpour
      53285
      Antwort vom Entwickler Reza Aghajanpour 2023.01.10 04:41
      Thank you for your great feedback. 😍🙏🌹🌹
      I am so glad and I will be here to be ensure that you have more win trade.
      ⭐⭐⭐⭐⭐
      Hozifa Berti
      274
      Hozifa Berti 2022.10.04 16:23 
       

      Highly recommend this indicator

      Reza Aghajanpour
      53285
      Antwort vom Entwickler Reza Aghajanpour 2022.10.04 20:20
      Thank you for your awesome feedback.
      Enjoy your trading. 🌹🌹🙏
      ⭐⭐⭐⭐⭐
      tunck
      879
      tunck 2022.08.22 10:11 
       

      Works well. Good support.

      Reza Aghajanpour
      53285
      Antwort vom Entwickler Reza Aghajanpour 2022.08.22 11:19
      Thank you for your positive feedback.🌹🌹🙏
      ⭐⭐⭐⭐⭐
      Naky S
      246
      Naky S 2022.07.22 12:34 
       

      As it provides a good profit/loss ratio, I think it is a very good indicator for money management. It's so good because the target is displayed. Based on this target, you can make good profits by moving and responding to Stop Loss.

      Reza Aghajanpour
      53285
      Antwort vom Entwickler Reza Aghajanpour 2022.08.16 21:59
      Enjoy your trading. 🌹🌹🙏
      ⭐⭐⭐⭐⭐
      Roczaye
      125
      Roczaye 2022.07.03 19:52 
       

      I got me all your indicators I'm happy... This one is one of the money profitable once. Try it

      Reza Aghajanpour
      53285
      Antwort vom Entwickler Reza Aghajanpour 2022.08.16 21:59
      Thank you for your awesome feedback.
      Enjoy your trading. 🌹🌹🙏
      ⭐⭐⭐⭐⭐
      Suvashish Halder
      2564
      Suvashish Halder 2022.04.12 17:28 
       

      You won't regret it if you get this indicator but make sure you understand how does this harmonic patterns work 💚

      Reza Aghajanpour
      53285
      Antwort vom Entwickler Reza Aghajanpour 2022.04.14 11:56
      Thank you for your positive feedback. 🌹🙏🌹
      Please after purchase, "contact me to send you instructions".
      ⭐⭐⭐⭐⭐
      samsnz
      95
      samsnz 2022.03.27 16:51 
       

      good indicator, creator's support is very good, development is ongoing and good, creator responds to feedback. Have all the indicators of Reza, and am still working out on the indicators, but these seem to be good.

      Reza Aghajanpour
      53285
      Antwort vom Entwickler Reza Aghajanpour 2022.03.27 17:35
      Thank you for your positive feedback.🌹🌹🙏
      JAM T
      764
      JAM T 2022.03.08 16:28 
       

      the perfect harmonic indicator I found for my strategy..... so it all depends on your strategy......with the alerts I need congratulating the author good work excellent

      Reza Aghajanpour
      53285
      Antwort vom Entwickler Reza Aghajanpour 2022.04.12 17:46
      Thank you for your great feedback. 😍🙏🌹🌹
      I am so glad and I will be here to be ensure that you have more win trade.
      ⭐⭐⭐⭐⭐
      Kyogo
      2077
      Kyogo 2022.02.22 14:12 
       

      Great work and support by author. Constantly improving and adding value.

      Reza Aghajanpour
      53285
      Antwort vom Entwickler Reza Aghajanpour 2022.04.12 17:46
      Thank you for your positive feedback.🌹🌹🙏
      ⭐⭐⭐⭐⭐
      mikebills
      41
      mikebills 2022.02.09 19:20 
       

      A welcome development but the win rates are not that good. less than 30% and it repaints. Will give a better review if this can be fixed. Until then,, this is a below-par indicator

      Reza Aghajanpour
      53285
      Antwort vom Entwickler Reza Aghajanpour 2022.11.05 07:05
      Please contact me after purchase to send you instruction and add you in group, if you use "mode=breakout", it doesn't repaint! 🌹🙏
      Antwort auf eine Rezension
      Version 1.24 2023.02.05
      - Added new option : Select Time Frames for scan in input setting
      Version 1.23 2023.02.01
      - Added email notification
      Version 1.21 2023.01.17
      - Improved printing alert
      Version 1.20 2023.01.17
      - Improved Printing Alert
      Version 1.19 2022.09.14
      - Set default mode to "Pattern"
      Version 1.18 2022.09.12
      - Added "breakout" mode (Please contact me for send you instruction)
      Input settings :
      ======================
      Mode = Breakout
      Error Rate % = 30.0
      How many candles are passed the pattern = 5
      =====================
      Mode = Pattern
      Error Rate % = 10.0
      How many candles are passed the pattern = 1
      Version 1.17 2022.07.18
      - Added buy/sell Signal buffers.
      Version 1.16 2022.05.13
      Improved some features :
      - Removed M1 Timeframe
      - "How many candles are past a pattern" in input part changed from 2 to 1
      Version 1.15 2022.03.29
      - Added chart view option(white,Black,Don't change)
      Version 1.14 2022.03.27
      - Add Name indicator option, "Name in chart" at input part for a user request.
      Version 1.13 2022.02.26
      - Fixed small bug, please download new version
      Version 1.12 2022.02.25
      - Improved print
      - Little Black view changed for a user request
      Version 1.11 2022.02.24
      Fixed print bug, Please download new version.
      Version 1.10 2022.02.22
      - Add Stop Loss level 2
      Version 1.9 2022.02.22
      - scan just your market watch,
      Please download new version
      Version 1.8 2022.02.09
      Enhanced view features :
      1- Add "H" button : Hidden all buttons on chart
      2- Add "Scan just open chart" in input section: it is for some users that don't need scan all chart. it works on just open chart.
      3- Add "Chart View black" in input section: change color chart to black(Default MT4)
      Version 1.7 2022.02.08
      - Add "Market watch" or "just currency pairs" button for scan
      Version 1.6 2022.02.03
      Improved win rate, please download new version
      Version 1.5 2022.01.31
      Improve quality
      Version 1.4 2022.01.30
      Enhanced alert buffer
      Version 1.3 2022.01.20
      Improve input parameter
      Version 1.2 2022.01.19
      Upgrade message on chart
      Version 1.1 2022.01.19
      Enhanced Print