Mega Spikes Max
- Indikatoren
- Niccyril Chirindo
- Version: 2.0
- Aktualisiert: 20 August 2024
- Aktivierungen: 8
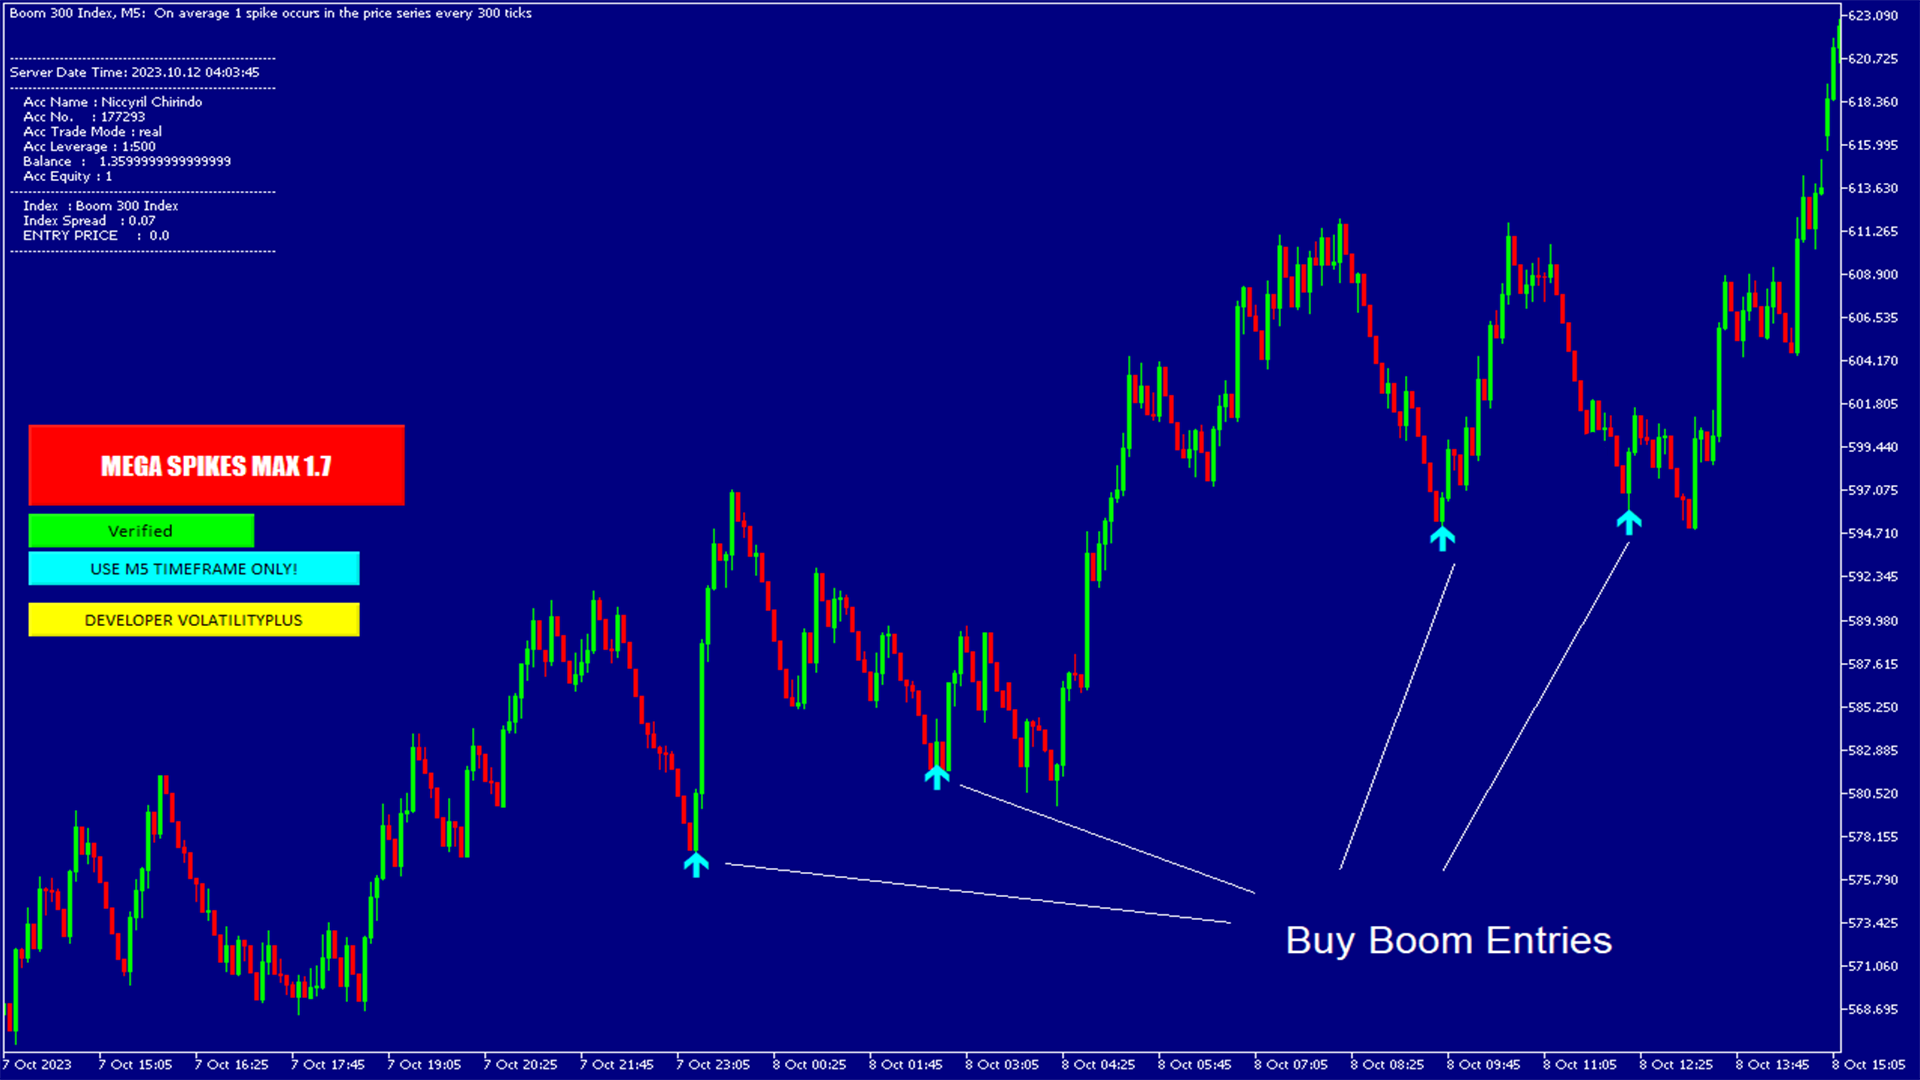
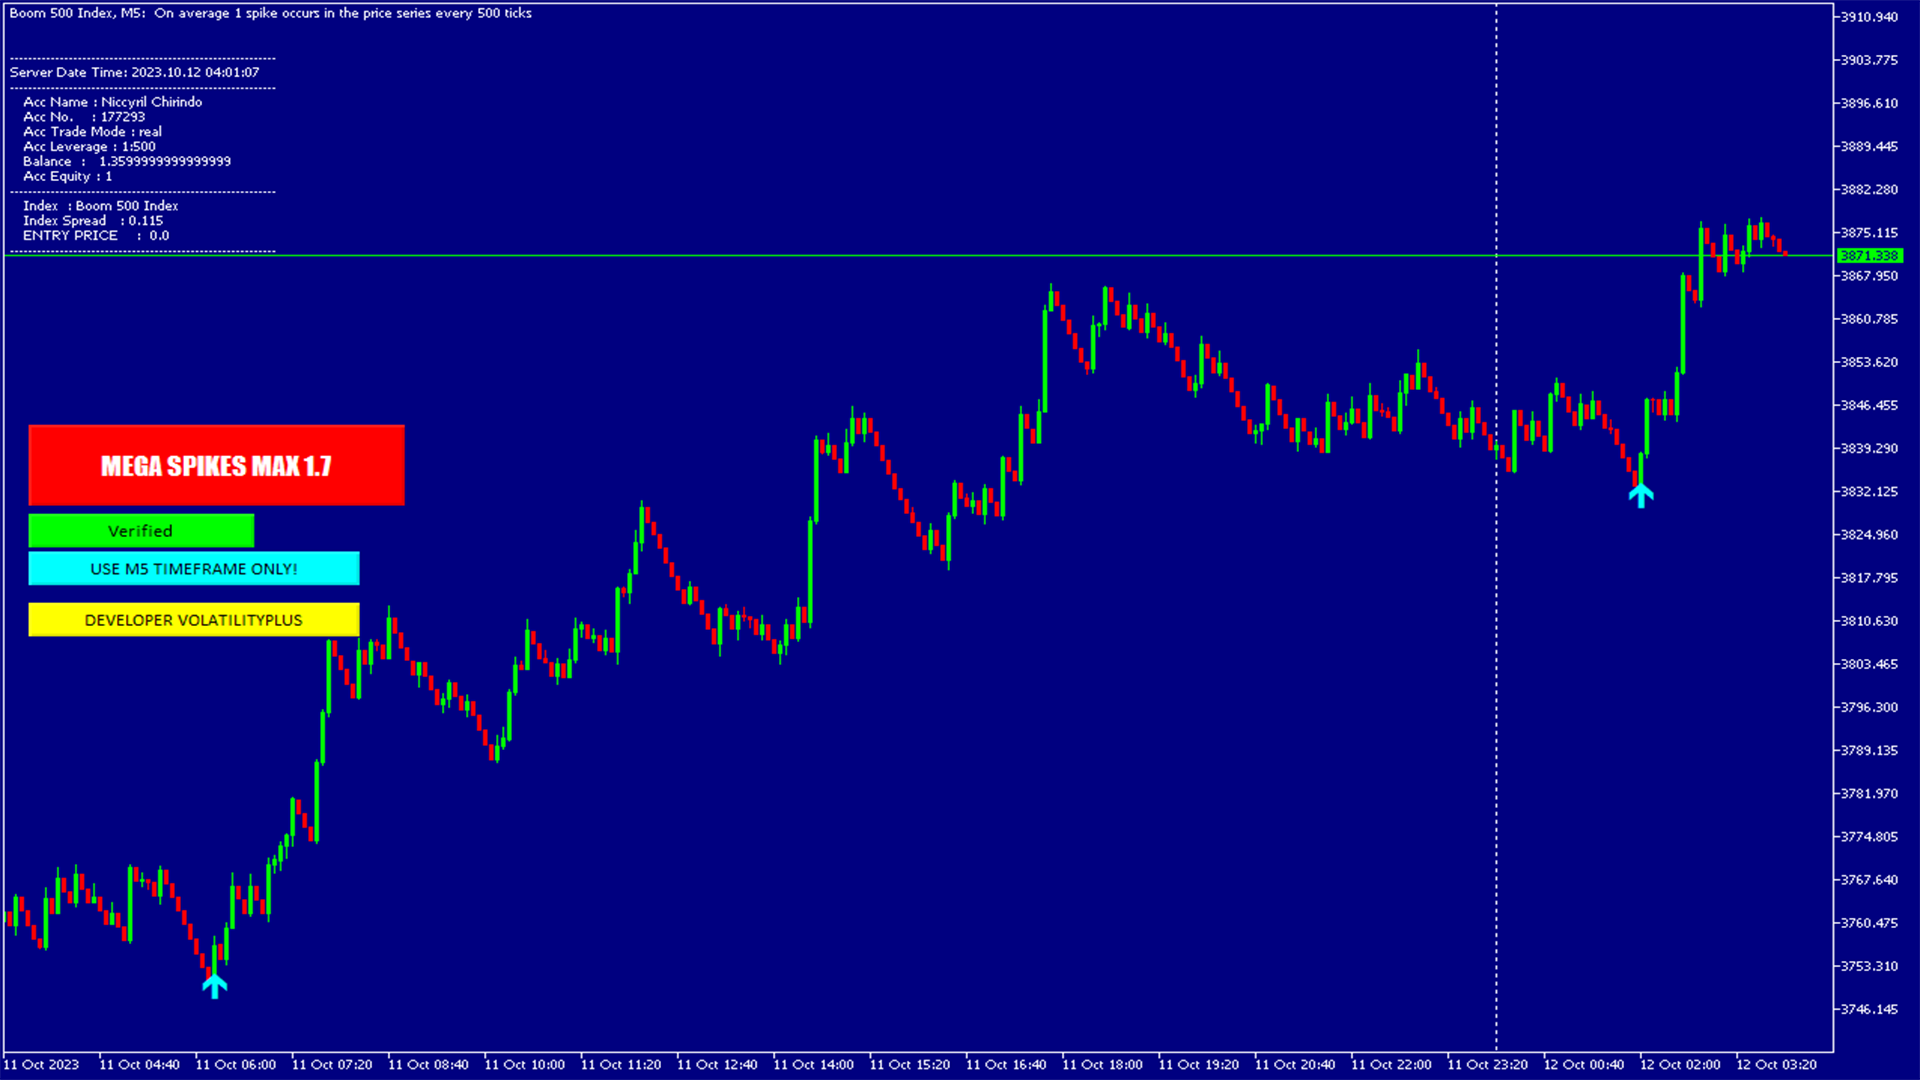
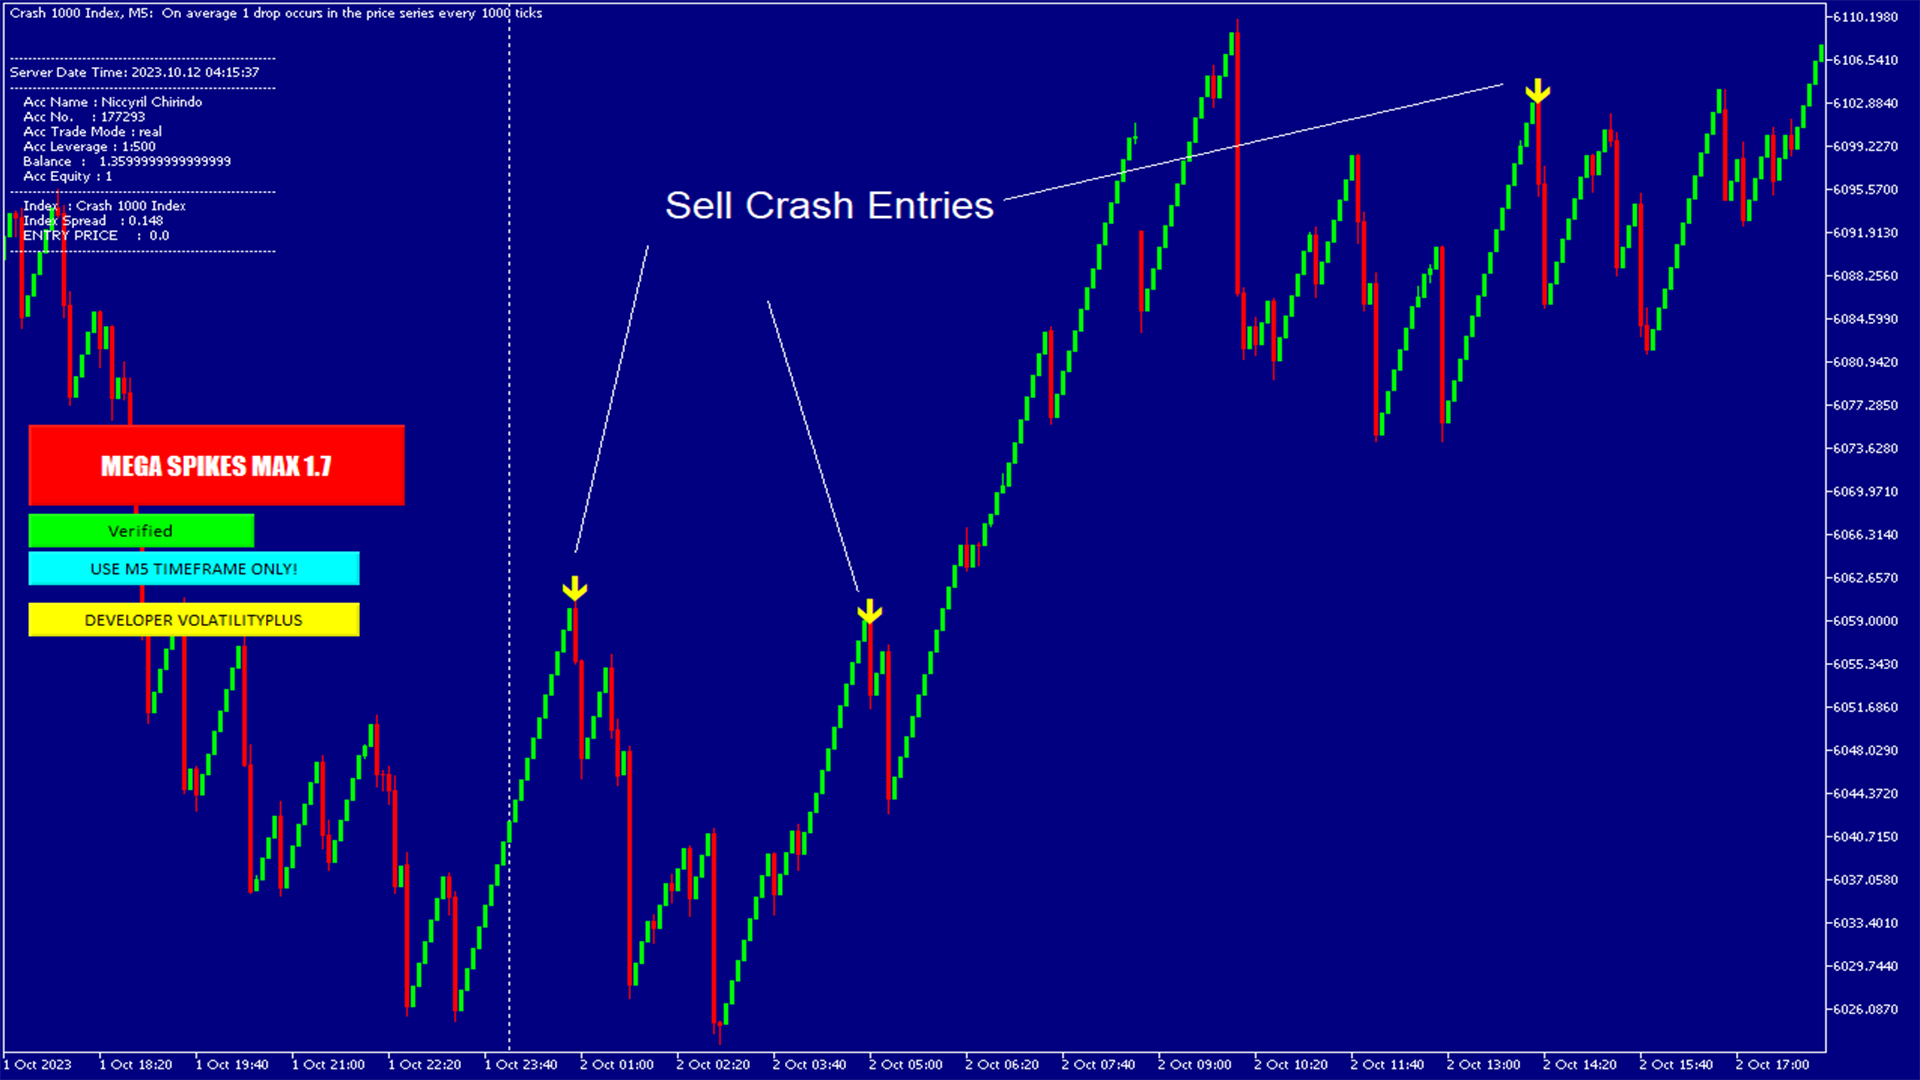
Boom and Crash Indicator - MT5 Spike Detector with Trade Alerts
Unlock the secrets of trading Boom and Crash spikes with our powerful MT5 indicator! This spike detection tool provides accurate buy and sell signals, trade alerts, and High success rate entries. Perfect for scalping, day trading, and swing trading. Get the best Boom and Crash strategy with our Deriv Boom and Crash spike indicator. Indicator does not redraw or repaint.
- Accurate Boom and Crash spike detection
- Reliable buy and sell signals with no repainting
- Take Profit targets
- Real-time trade alerts and mobile notifications
- Compatible with all MT5 Boom & Crash charts
- Ideal for traders of all skill levels, from beginner to expert
Advanced spike detection Algorithm
Mobile Notifications - Receive alerts on-the-go!
TP Targets - Precise exit points
Real-Time Signals - Stay ahead of the market with instant notifications
No Repainting: Reliable, No Lagging Signals
Upgrade your trading strategy with our Boom and Crash Indicator and start catching those massive spikes today!
- Compatible with MT5 platform
- System requirements: Windows , macOS
Setup Instructions
Download and install the indicator
Attach to your MT5 chart
Customize settings as needed, Like Mobile Notifications