Laguerre SuperTrend Clouds MT5
- Indikatoren
- Libertas LLC
- Version: 1.5
- Aktivierungen: 20
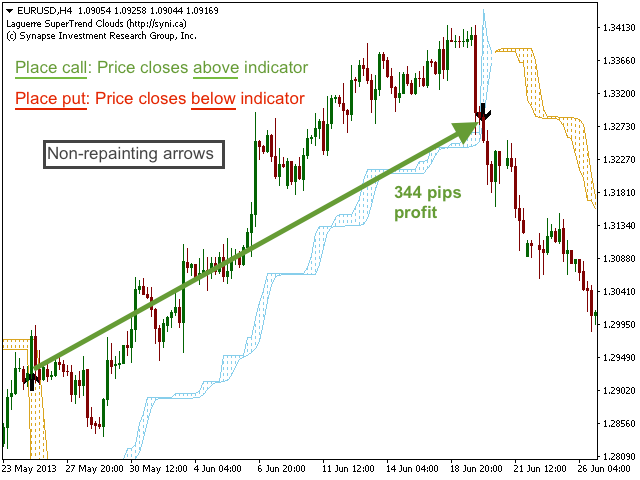
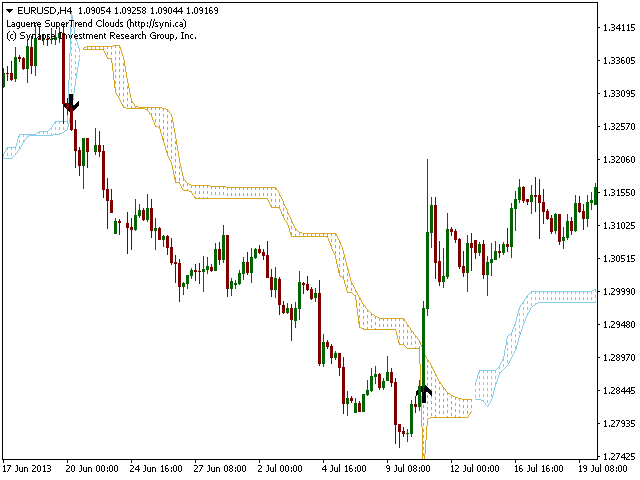
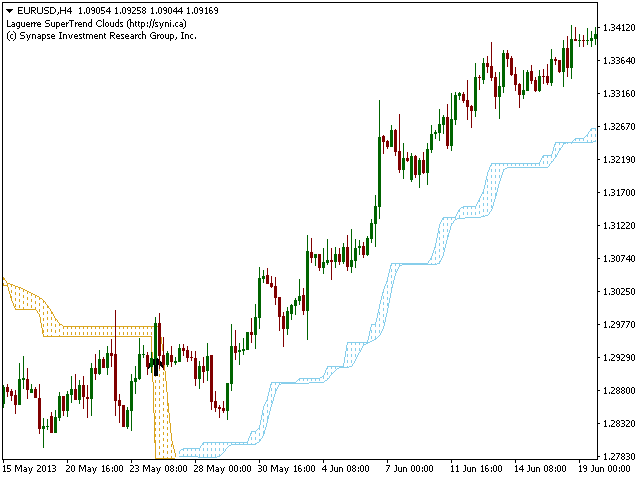
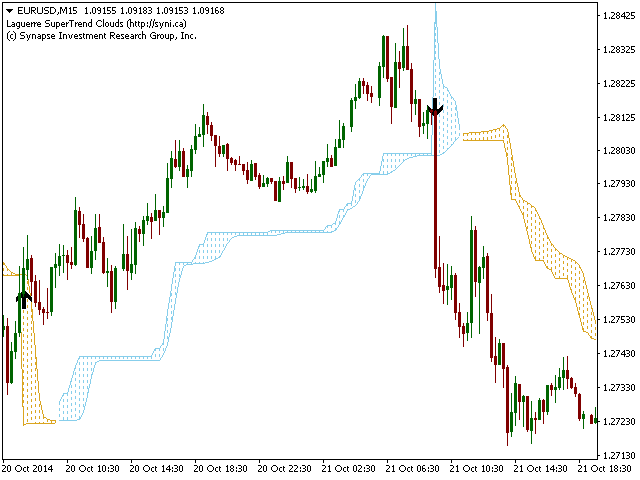
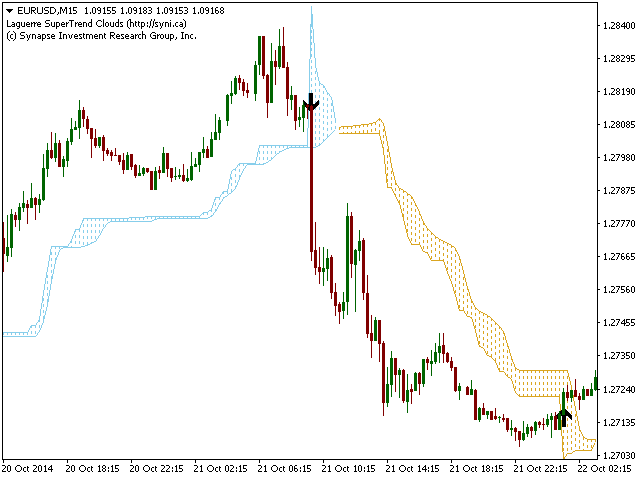
Laguerre SuperTrend Clouds adds an Adaptive Laguerre averaging algorithm and alerts to the widely popular SuperTrend indicator. As the name suggests, Laguerre SuperTrend Clouds (LSC) is a trending indicator which works best in trendy (not choppy) markets.
The SuperTrend is an extremely popular indicator for intraday and daily trading, and can be used on any timeframe. Incorporating Laguerre's equation to this can facilitate more robust trend detection and smoother filters. The LSC uses the improved version of Adaptive Laguerre's equation (that applies Laguerre polynomials of any order), to create SuperTrend Confidence Clouds that flexibly adjust over time, giving more information on growing and fading trend strengths.
Place a call when the price closes above the leading line, and place a put when the price closes below the leading line. These crossovers are highlighted by non-repainting up/down arrows.
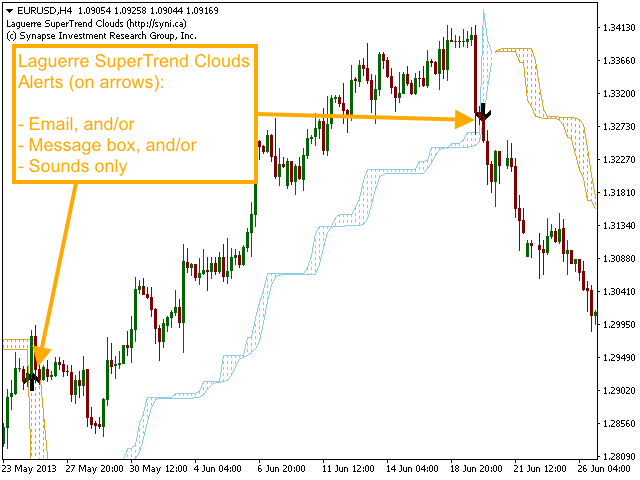
Alerts
Email, message and sound alerts can be turned on/off for the following events. Please note that email recipient and SMTP information should be specified in MetaTrader 4 options before using email alerts.
- Price closed above leading LSC line (call)
- Price closed below leading LSC line (put)
Parameters
- SuperTrend # Bars used for calculation (Default=10) - number of bars used to calculate SuperTrend.
- SuperTrend Multiplier (Default=4.0) - multiplication factor for calculating average true range in SuperTrend. Higher value = less signals, lower value = more signals but higher chance of false positive.
- Laguerre Clouds Length (Default=10) - number of bars used to calculate Laguerre Clouds.
- [opt] Laguerre Clouds Order (Default=4) - order of the Laguerre Polynomial [advanced option].
- [opt] Adaptive Factor Smoothing Period (Default=5) - period to smooth the Laguerre Gamma adaptive factor [advanced option].
- [opt] Adaptive Factor Smoothing Method (Default=Median) - averaging method used for smoothing Gamma adaptive factor [advanced option].
- Alert when price crosses LSC leading edge - True = alerts are allowed, false = all alerts are paused.
- Turn on alerts message - message box alerts.
- Turn on alerts sound - sound alerts.
- Turn on alerts email - email alerts.
Laguerre SuperTrend Clouds is most effective during trendy (not choppy) market conditions, and so it pairs well with our Choppiness Index indicator.