Flat finder MT4
- Indikatoren
- Yuriy Lyachshenko
- Version: 1.0
- Aktivierungen: 5
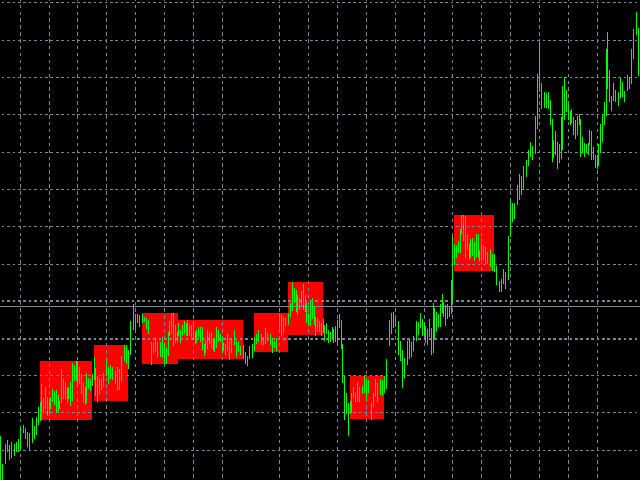
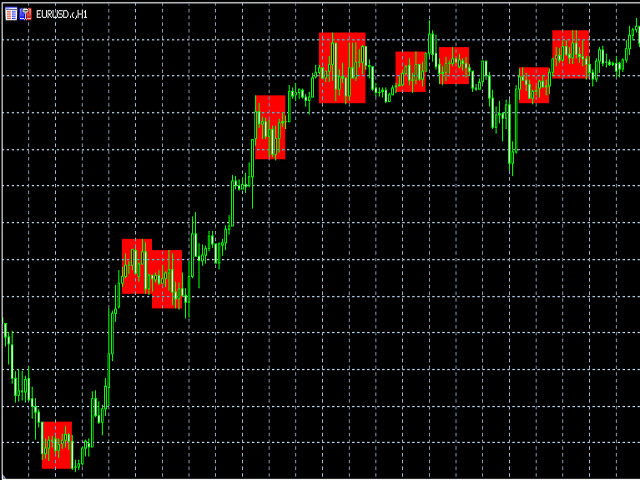
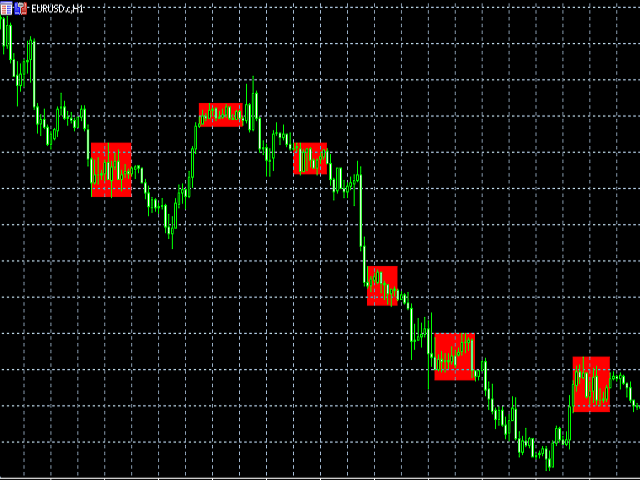
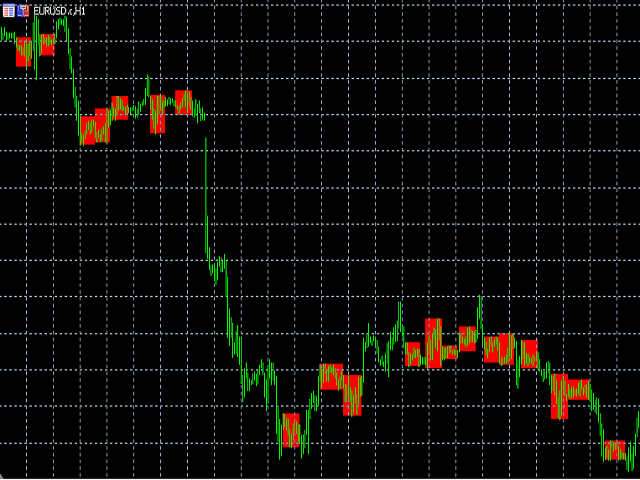
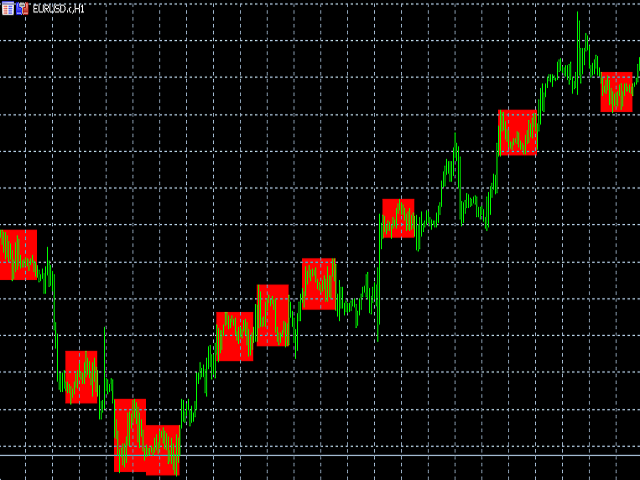
Dieser Indikator erkennt ein Flat und malt den gefundenen Bereich mit einem farbigen Rechteck aus.
Die Hauptidee dieses Indikators ist es, ein Flat zu erkennen, wenn der Preis einen bestimmten Bereich auf dem Chart füllt.
Eingabeparameter:
Color rectangle - Farbe des Rechtecks, das schattiert werden soll.
Bars in rectangle - Mindestanzahl von Balken in einem Rechteck.
Density in % - Dichte des Flats, angegeben als Prozentsatz der Rechteckfläche.