DashMarketProfile
- Indikatoren
- Fillipe Dos Santos
- Version: 1.0
- Aktivierungen: 5
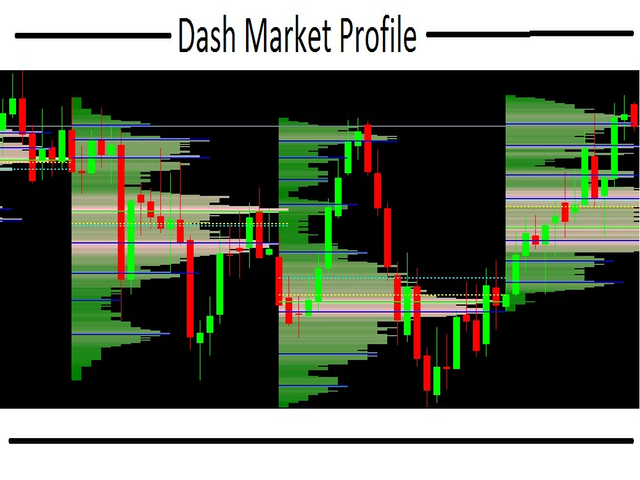
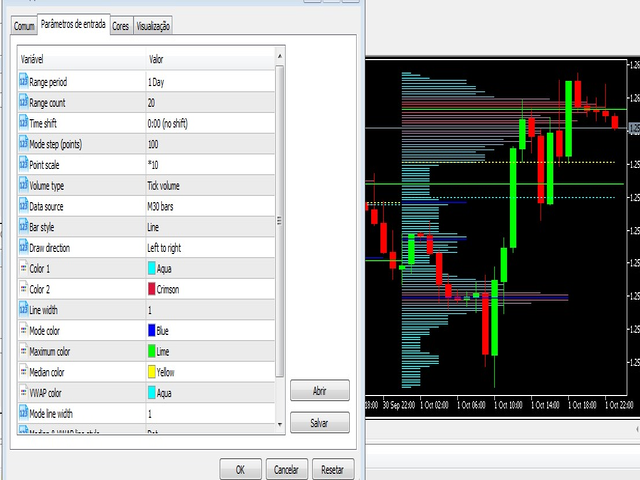
this indicator is essential when it's necessary to identify trade locations on chart. You can initially get an idea of the candlestick's direction with other graphical tools and then identify the best regions with the DMP. The Dash Market Profile is a statistical indicator, that mean it is an indicator that is based on mathematical calculations, identifying the best regions and observing the candles of the best regions to trade. The financial market is not as easy as it seems, it is necessary to have indicators, so it will also be necessary to know the regions where there was a large number of accumulations and graphic distributions, and this is where you can see the usefulness of the Dash Market Profile. you will see the best regions for trade, from the worst regions to the best regions. If you want, you can do a test for a few months and draw your conclusions, after using this indicator it is very likely that you will no longer be able to see the market in any other way. As it is a multi-time-frame indicator you can select the graphic period you want (monthly, weekly, daily, hour, minute etc), this will bring you a great advantage, because if you are used to a specific timeframe, you will already be familiar with this indicator. You can also use this indicator on any asset, forex assets, Indexes, Cryptocurrencies and whatever your broker makes available to you. Be aware that this is an indicator for the metatrader5 platform and not the 4, if you need an indicator from this model for a metatrader 4 platform, just leave a message. If you wish, you can change the color of the indicator any way you want,


