Rubdfx Trend Snatcher
- Indikatoren
- Namu Makwembo
- Version: 1.0
- Aktivierungen: 10
Version 1.0
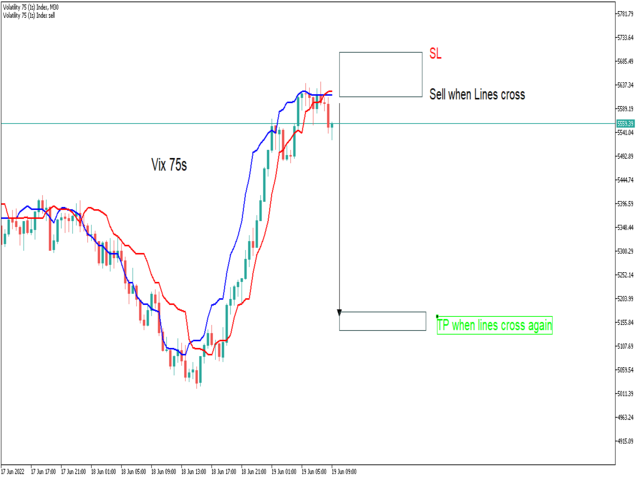
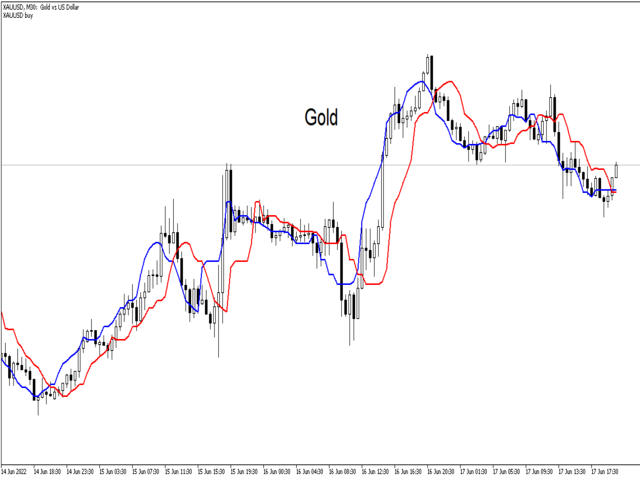
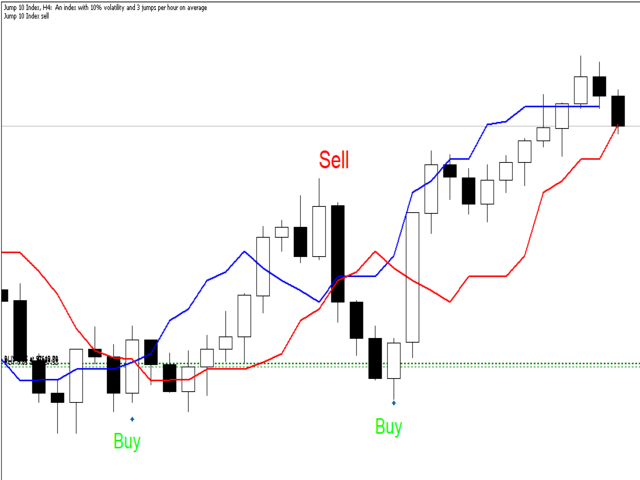
The Trend Snatcher is Multi timeframe indicator that can be used to catch swings on the price market chart
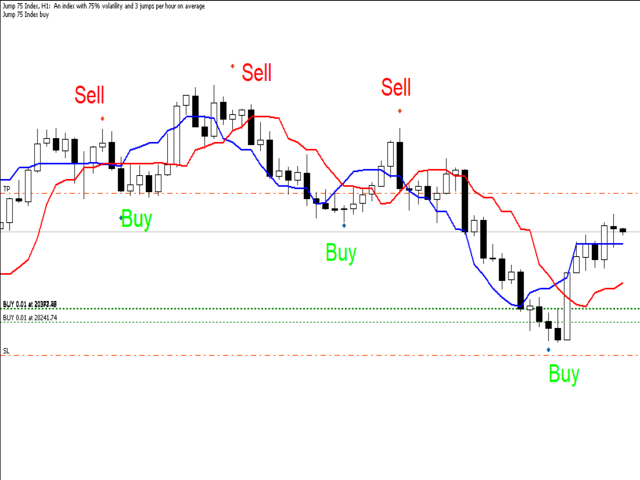
The indicator uses two lines that targets the highest buying and lowest selling levels , the signal indicated by the two lines crossing
The indicator is suitable for scalping and Swing trading, It can also be used as additional Confluence to enter a trade when Price is at a significant level of supply and demand or Trendline touch
HOW IT WORKS?
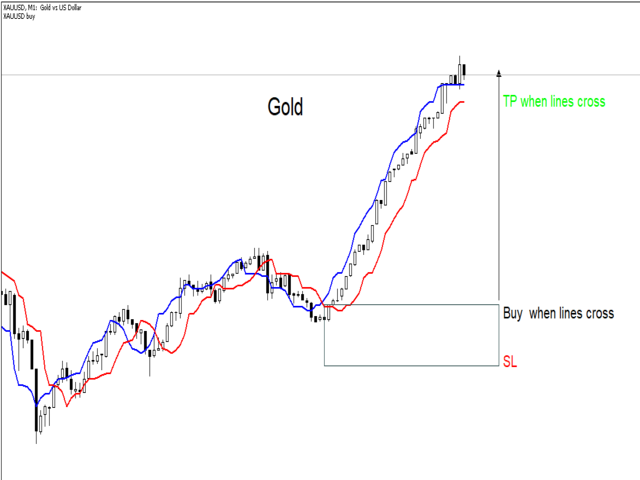
Buying:
- Place your Buy Entry when the blue line is above the red line , an alert signal will also be generated
- Stop loss just a few pips below the entry candle
- A good exit strategy will be when the lines cross ( opposite signals)
- You can lock profits when the price goes a safe distance from the entry price
Selling:
- Place your Sell Entry when the red line is above the blue line , an alert signal will also be generated
- Stop loss just a few pips above the entry candle
- A good exit strategy will be when the lines cross ( opposite signals)
- You can lock profits when the price goes a safe distance from the entry price
FEATURES
- Mobile alerts: True
- Email alerts : false
- Sound alerts: - True
- Mobile alerts: -True
- Settings Available. : Yes
Recommended Timeframes
- 15M
- 30M
- 1H
- 4H
Hello, I am very disappointed. The indicator is very much over redrawing, where there was a hammer and line crossing and buy entry, a few candles later there is over redrawing and there was no entry signal, pure trend and you think, what was that? In addition, the re-drewing on history makes it impossible to analyse the trade with this indicator. I am almost ready to ask for my money back...