MACD Intraday Trend PRO
- Indikatoren
- JETINVEST
- Version: 1.20
- Aktualisiert: 6 Juni 2021
- Aktivierungen: 20
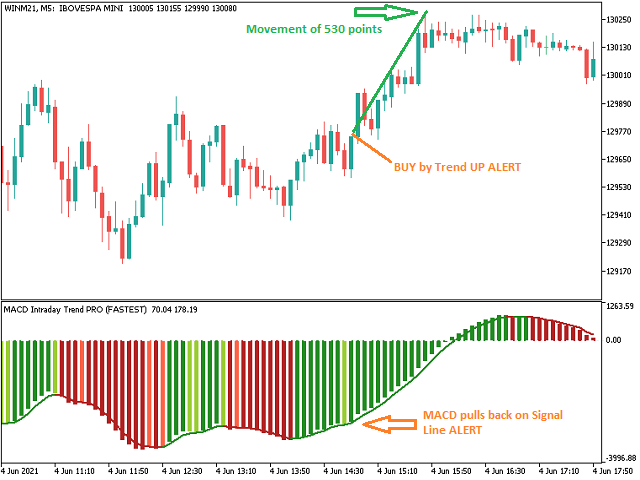
MACD Intraday Trend PRO ist ein Indikator, der durch eine Adaption des ursprünglichen MACD von Gerald Appel in den 1960er Jahren entwickelt wurde.
Im Laufe der Jahre des Handels wurde beobachtet, dass wir durch die Änderung der Parameter des MACD mit Fibonacci-Proportionen eine bessere Darstellung der Kontinuität der Trendbewegungen erreichen, wodurch es möglich ist, den Beginn und das Ende eines Preistrends effizienter zu erkennen.
Aufgrund seiner Effizienz bei der Erkennung von Kurstrends ist es auch möglich, die Divergenzen von Tops und Bottoms sehr klar zu erkennen und so Handelschancen besser zu nutzen.
Merkmale
- Der Indikator MACD Intraday Trend PRO funktioniert mit jedem Währungspaar, zu jedem Zeitrahmen und mit Renko-Charts.
- Es ist möglich, die Trenderkennungsgeschwindigkeit durch Auswahl von 5 Modi einzustellen:
- SCHNELLSTE
- SCHNELL
- NORMAL
- LANGSAM
- LANGSAMSTE
Ressourcen
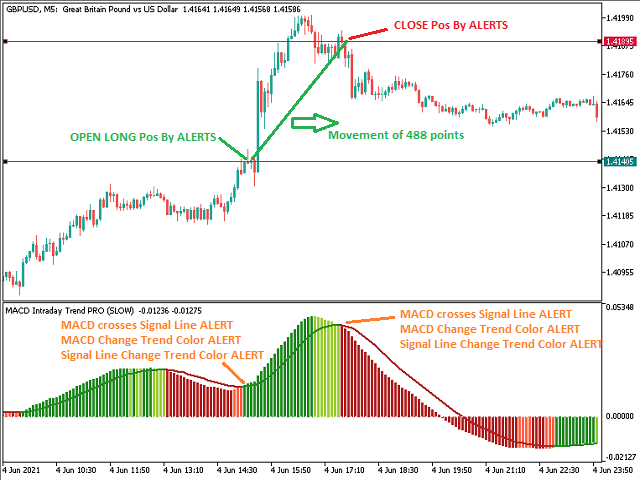
- Es verfügt über 6 konfigurierbare Warnungen:
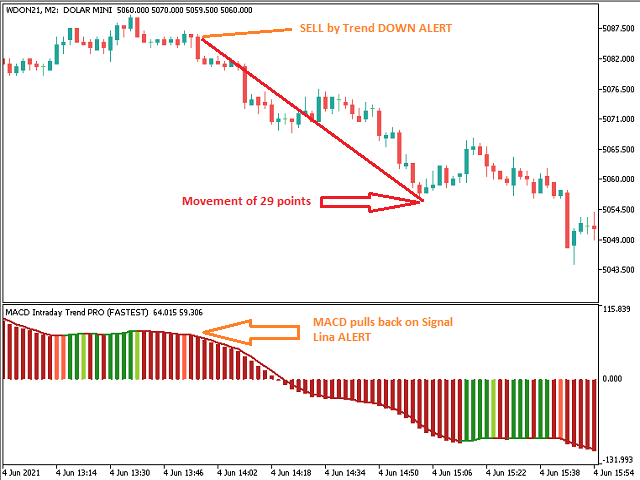
- MACD zieht sich von der Signallinie zurück
- MACD kreuzt Signallinie
- MACD kreuzt Ebene Null
- Signalleitung kreuzt Pegel Null
- MACD Trendfarbe ändern
- Signalleitung ändern TREND Farbe
- Für jede Warnung kann Folgendes konfiguriert werden:
- Pop-up
- Ton (Es stehen 13 Tonarten zur Verfügung.)
- Smartphone-Benachrichtigung
- Popup und Ton
- Popup- und Smartphone-Benachrichtigung
- Ton- und Smartphone-Benachrichtigung
- Popup-, Sound- und Smartphone-Benachrichtigung
Integration mit Expert Advisors oder anderen Indikatoren
- Es stehen 8 Puffer für den Zugriff und die Integration mit Fachberatern oder anderen Indikatoren zur Verfügung, sie werden auch bei ausgeschalteten Warnungen gefüllt, sie sind:
- Puffer-ID 5: MACD-Wert
- Puffer-ID 6: Signalleitungswert
- Puffer-ID 12: Warnung 1
- Puffer-ID 13: Warnung 2
- Puffer-ID 14: Warnung 3
- Puffer-ID 15: Warnung 4
- Puffer-ID 16: Warnung 5
- Puffer-ID 17: Warnung 6
- Die Puffer, die sich auf die 6 Alerts beziehen, können die folgenden Werte enthalten:
- Abwärtstrend: (-1)
- Undefinierter Trend: (0)
- Aufwärtstrend: (+1)
Wenn Sie noch Fragen haben, kontaktieren Sie mich bitte per Direktnachricht: https://www.mql5.com/de/users/robsjunqueira/


Great indicator