• Übersicht
  • Bewertungen
  • Diskussion
  • Neue Funktionen

Market Shaver

Markt Rasierer
 
Markt Scalper
Dieser Indikator ist Teil der Systeme von RPTrade Pro Solutions.

Market Scalper ist ein täglicher Trendindikator, der Price Action, Dynamic Support und Resistances verwendet.
Es ist so konzipiert, dass es von jedem verwendet werden kann, selbst der absolute Anfänger im Handel kann es verwenden.
NIEMALS neu lackieren.
Indikationen werden von nah zu nah gegeben.
Für den alleinigen Gebrauch konzipiert, es sind keine weiteren Indikatoren erforderlich.
Gibt Ihnen klare und einfache Hinweise


Wie funktioniert es
Market Shaver verwendet das Dual TimeFrames-System.
Der Haupttrend wird vom höheren TF übernommen, während der schnellere zum Schließen des Handels verwendet wird
Trades werden einzeln angezeigt, es gibt niemals zwei Trades gleichzeitig.

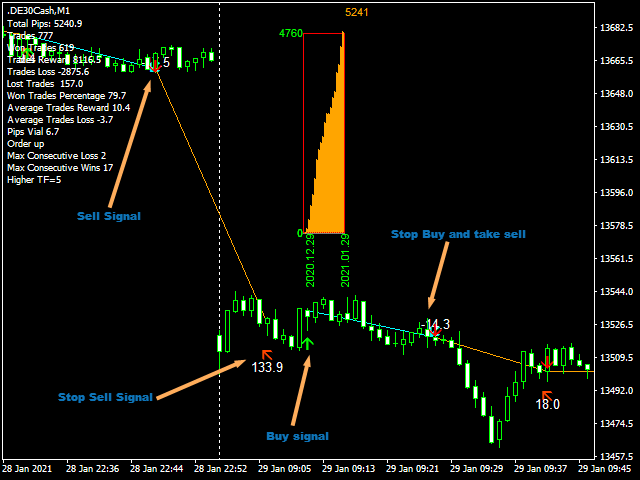
Market Shaver zeigt an:
Wann man einen Trade eingehen sollte
Wann man damit aufhört, bei Gewinn oder Verlust.
Die Handelsprämien
Viele Statistiken, die Ihnen helfen, das richtige Periodenende TF festzulegen
Market Shaver funktioniert
Mit jedem Instrument wie FX-Paaren, Indizes, Metallen, Futures oder anderen.
Von M1 bis H1.
Bei jedem Makler. (Ein niedrigerer Spread wird Ihnen mehr Pips hinterlassen)


Market Shaver-Funktionen
Zuverlässige Kauf-/Verkaufssignale.
Sehr einfache Eingaben. (Standard sollte für fast alle Instrumente funktionieren)
On Screen Alert + Push-Benachrichtigungen + E-Mail-Benachrichtigungen
Alle Benachrichtigungen sind sehr detailliert und geben auch Take Profit, es ermöglicht den Handel von einem mobilen Gerät aus.
Ein Gewinndiagramm, das Ihnen bei den richtigen Einstellungen hilft


So verwenden Sie Market Shaver
Tragen Sie es einfach in Ihre Karte(n) ein.
Folgen Sie einfach den Pfeilen.


Eingänge
Zeitraum: [Integer] Zeitraum des Indikators; von 2 bis .....
Zeitraum 2: [Integer] Zeitraum des Indikators; von 1 bis ..... Der niedrigere Wert = mehr Multi-Trades
Höherer TF: [ZEITRAHMEN] Wählen Sie den langsameren TF, der zum Eingeben von Trades verwendet wird. Geben Sie immer einen höheren TF als den des Indikators ein.
Gewinndiagramm anzeigen: [Bool] true zeigt das Gewinndiagramm an, false blendet es aus.
UsePush: [bool] true sendet Push-Benachrichtigungen
SendAlert: [bool] true sendet Warnungen
SPEZIELLE Beweisgarantie:
Market Shaver arbeitet ohne Schleife und Datenspeicherung. Bedeutet, dass keine Vorausberechnungen durchgeführt werden. Es funktioniert nur live oder im Tester, wenn Sie es auf Ihr Diagramm setzen, sehen Sie erst in dem Moment, in dem Sie es gestartet haben, einen Hinweis.
Dies ist die ultimative Beweisgarantie dafür, dass die Software keine bekannten Daten verwendet und nicht betrügen kann.
Empfohlene Produkte
Noize Absorption Index MT4
Ekaterina Saltykova
5 (1)
Noize Absorption Index - is the manual trading system that measures the difference of pressure between bears forces and bulls forces. Green line - is a noize free index that showing curent situation. Zero value of index shows totally choppy/flat market.Values above zero level shows how powerfull bullish wave is and values below zero measures bearish forces.Up arrow appears on bearish market when it's ready to reverse, dn arrow appears on weak bullish market, as a result of reverse expectation. S
Daily Candle Predictor ist ein Indikator, der den Schlusskurs einer Kerze vorhersagt. Der Indikator ist in erster Linie für die Verwendung in D1-Charts gedacht. Dieser Indikator eignet sich sowohl für den traditionellen Devisenhandel als auch für den Handel mit binären Optionen. Der Indikator kann als eigenständiges Handelssystem oder als Ergänzung zu Ihrem bestehenden Handelssystem verwendet werden. Dieser Indikator analysiert die aktuelle Kerze und berechnet bestimmte Stärkefaktoren innerhalb
Blahtech Market Profile
Blahtech Limited
4.61 (18)
Was: $249  Now: $99   Market Profile defines a number of day types that can help the trader to determine market behaviour. A key feature is the Value Area, representing the range of price action where 70% of trading took place. Understanding the Value Area can give traders valuable insight into market direction and establish the higher odds trade. It is an excellent addition to any system you may be using. Blahtech Limited presents their Market Profile indicator for the MetaTrader community. Ins
The Th3Eng PipFinite indicator is based on a very excellent analysis of the right trend direction with perfect custom algorithms. It show the true direction and the best point to start trading. With StopLoss point and Three Take Profit points. Also it show the right pivot of the price and small points to order to replace the dynamic support and resistance channel, Which surrounds the price. And Finally it draws a very helpful Box on the left side on the chart includes (take profits and Stop loss
Forex Gump
Andrey Kozak
2.83 (6)
Forex Gump is a fully finished semi-automatic trading system. In the form of arrows, signals are displayed on the screen for opening and closing deals. All you need is to follow the instructions of the indicator. When the indicator shows a blue arrow, you need to open a buy order. When the indicator shows a red arrow, you need to open a sell order. Close orders when the indicator draws a yellow cross. In order to get the most effective result, we recommend using the timeframes H1, H4, D1. There
Owl smart levels
Sergey Ermolov
4.63 (54)
MT5-Version  |  FAQ Der   Owl Smart Levels Indikator   ist ein komplettes Handelssystem innerhalb eines Indikators, der so beliebte Marktanalysetools wie die   fortschrittlichen Fraktale von Bill Williams , Valable ZigZag, das die   richtige Wellenstruktur   des Marktes aufbaut, und   Fibonacci-Levels , die die genauen Einstiegslevels markieren, enthält in den Markt und Orte, um Gewinne mitzunehmen. Detaillierte Strategiebeschreibung Anleitung zur Verwendung des Indikators Berater-Assistent im
Gold Bricks FX USES THE TREND WAVE INDICATOR AND IT CAN IDENTIFY THE BEGINNING AND THE END OF A NEW WAVE TREND MOVEMENT. AS AN OSCILLATOR, THE INDICATOR IDENTIFIES THE OVERBOUGHT AND OVERSOLD ZONES. IT WORKS GREAT TO CATCH THE SHORT TERM PRICE REVERSALS AND USES A MARTINGALE STRATEGY TO CLOSE ALL TRADES IN PROFIT. USE DEFAULT SETTINGS ON H1 OR HIGHER TIME FRAME ON ANY PAIR FOR MORE ACCURATE TRADES WHY THIS EA : Smart entries calculated by 4 great strategies The EA can be run on even a
Fibonacci-Erweiterung und Retracement-Analyse-Tool Fibonacci-Retracing- und Extended-Line-Tools für die MT4-Plattform, ideal für Trader, die die und den Golden Section-Handel nutzen Hauptmerkmale: 1. Sie können mehrere Sätze von Fibonacci-Retracements direkt zeichnen, und die Beziehung zwischen wichtigen Rückkehrpunkten ist auf einen Blick ersichtlich. 2. Kann Fibonacci-Erweiterungen zeichnen 3. Das Fibonacci-Foldback und die Verlängerung der Linie können nach links und nach rechts zu
Cosmic Diviner X Planet
Olena Kondratenko
4 (2)
This unique multi-currency strategy simultaneously determines the strength of trends and market entry points, visualizing this using histograms on the chart. The indicator is optimally adapted for trading on the timeframes М5, М15, М30, Н1. For the convenience of users, the indicator renders the entry point (in the form of an arrow), recommended take profit levels (TP1, TP2 with text labels) and the recommended Stop Loss level. The take profit levels (TP1, TP2) are automatically calculated for
Master Scalping M1 ist ein innovativer Indikator, der einen Algorithmus verwendet, um den Trend schnell und genau zu bestimmen. Der Indikator berechnet den Zeitpunkt zum Öffnen und Schließen von Positionen, die Indikatoralgorithmen ermöglichen es Ihnen, die idealen Zeitpunkte für den Einstieg in einen Handel (Kauf oder Verkauf eines Vermögenswerts) zu finden, was den Erfolg von Transaktionen für die meisten Händler erhöht. Vorteile des Indikators: Einfach zu bedienen, überladen Sie das Diagramm
Intraday Levels shows intraday levels grid for intraday trading Shows a grid for the day levels, gives you a guide to know the trend and to measure intraday trades (stop-loss and take-profit). Parameters are: Levels Mode: Basic mode: Shows highest, lowest and middle levels. Advanced mode: Shows highest, lowest, middle and intermediate levels. Fibonacci mode: Shows session Fibonacci retracements levels. Momentum mode: Shows delayed Advanced levels to identify momentum. Smooth Period (Momentum
Heiken Ashi candle chart is an improved version of The Japanese candle chart, which can effectively filter the market "noise" of the Japanese candle chart. It is favored by many traders for its simplicity and intuition. For trend traders, the HA candle chart is a magic tool. Unlike the traditional Japanese candle chart, Heikenashi does not reflect the opening price, high price, low price and closing price of the market. Instead, Heikenashi calculates the value of a single K line in the dominant
For sure, this indicator has become very popular amongst traders. Through coding this indicator will give you the most accurate levels possible for your trading analysis. We have also added in the ability for you to receive alerts when the price breaks above or below a Support or Resistance lines! HOW TO USE The red rectangles represent your resistance/supply zone. The green rectangles represent your support/demand zone.  BONUS FEATURES We coded this indicator with the ability to switch between
Point61 Indicator
Evgeniy Machok
5 (1)
The Point61 indicator is the result of many years of monitoring of price behavior of currency pairs and metals. It is not a secret, that in times of uncertainty, traders are looking for possible levels of support and resistance - the point, where price should stop its movement. There are 2 possible scenarios at these points: 1. Reverse (correction) to the opposite direction; 2. Breakthrough to continue movement. Very often these points are used to set stop orders - TakeProfit or
Title : Market Bias Indicator - Oscillator-Based Trading Tool Introduction : Discover the potential of the "Market Bias Indicator," a revolutionary oscillator-based trading tool designed for precise market analysis. If you're in search of a robust alternative to traditional bias indicators, your quest ends here. Market Bias Indicator offers unparalleled accuracy in identifying market sentiment and is your gateway to confident trading decisions. Recommended Trading Pairs : Market Bias Indicator i
VR Cub
Vladimir Pastushak
VR Cub ist ein Indikator für den Erhalt hochwertiger Einstiegspunkte. Der Indikator wurde entwickelt, um mathematische Berechnungen zu erleichtern und die Suche nach Einstiegspunkten in eine Position zu vereinfachen. Die Handelsstrategie, für die der Indikator geschrieben wurde, hat sich seit vielen Jahren bewährt. Ihr großer Vorteil liegt in der Einfachheit der Handelsstrategie, die es auch unerfahrenen Händlern ermöglicht, erfolgreich damit zu handeln. VR Cub berechnet Positionseröffnungspunkt
PZ Trend Trading
PZ TRADING SLU
4.75 (4)
Trend Trading ist ein Indikator, der so weit wie möglich von den Markttrends profitiert, indem er Pullbacks und Breakouts zeitlich festlegt. Sie findet Handelsmöglichkeiten, indem sie analysiert, was der Preis während etablierter Trends tut. [ Installationsanleitung | Update-Anleitung | Fehlerbehebung | FAQ | Alle Produkte ] Handeln Sie mit Zuversicht und Effizienz an den Finanzmärkten Profitieren Sie von etablierten Trends, ohne ins Wanken zu geraten Profitable Pullbacks, Ausbrüche und vor
Der Indikator berechnet und zeichnet automatisch Fibonacci-Unterstützungs- und Widerstandsniveaus - eines der effektivsten Werkzeuge für die Marktanalyse. Die Berechnung verwendet die gemittelten Preisdaten für den ausgewählten Zeitraum und Zeitraum. Das Minimum und das Maximum für diesen Zeitraum gelten als Beginn und Ende der Bewegung. Fibonacci-Niveaus ermöglichen es Ihnen, potenzielle Referenzpunkte zu erkennen, um die sich die Preisbewegung verlangsamen oder umkehren kann, dh sie werden ver
This is the FXTraderariel-TakeProfit - Stop Loss Indicator . It provides you 3 potential Take Profits and 1 Stop Loss. These potential targets are computed based on several methods . The indicator can be used on every time frame, but we advise to use it on H1, H4 and D1. Especially if you are a novice trader. Pro Traders can also you use it for scalping in smaller time frames (M1, M5 and M15). This indicator is not a complete trading system. It doesn't provide you a Signal nor can predict the m
Infinity Trend Pro
Yaroslav Varankin
1 (1)
This is a trend indicator without redrawing Developed instead of the binary options strategy (by the color of the Martingale candlestick) Also works well in forex trading When to open trades (binary options) A signal will appear in the place with a candle signaling the current candle It is recommended to open a deal for one candle of the current timeframe M1 and M5 When a blue dot appears, open a deal up When a red dot appears, open a trade down. How to open trades on Forex. When a signal is rec
Shark Deal Book
Philip Pankaj Suthagar
4 (3)
Term  "shark"  in the business world denotes a high volume investor who just made a good investment in a highly Potential business deal.So, sharks are the ones who make the market move. In our case, if an American shark bought a Japanese company, he/she has to convert American dollars into Japanese yen to make the deal. So, the demand for the Japanese yen will increase sharply. Thus USD/JPY will go short rapidly if the deal was from the shark. Another example, In the case of forex, if fed increa
HMA Trend Professional MT4
Pavel Zamoshnikov
4.63 (8)
Improved version of the free HMA Trend indicator (for MetaTrader 4) with statistical analysis. HMA Trend is a trend indicator based on the Hull Moving Average (HMA) with two periods. HMA with a slow period identifies the trend, while HMA with a fast period determines the short-term movements and signals in the trend direction. The main differences from the free version: Ability to predict the probability of a trend reversal using analysis of history data. Plotting statistical charts for analyz
The indicator displays the data of the Stochastic oscillator from a higher timeframe on the chart. The main and signal lines are displayed in a separate window. The stepped response is not smoothed. The indicator is useful for practicing "manual" forex trading strategies, which use the data from several screens with different timeframes of a single symbol. The indicator uses the settings that are identical to the standard ones, and a drop-down list for selecting the timeframe. Indicator Parame
Trade with Gann on your side!! MASTER CIRCLE 360 CIRCLE CHART, originally created by Gann admitted that this is “The Mother of all charts”. It is one of the last studies that this great trader left for us. The numeric tab le is apparently quite simple like all the tables and is based on square numbers, the SQUARE OF 12 and is by evolution, one of the most important square numbers. Here we can find CYCLE, PRICE AND TIME thanks to angles and grades, to show past and future support and resistance.
TWO PAIRS SQUARE HEDGE METER INDICATOR Try this brilliant 2 pairs square indicator It draws a square wave of the relation between your two inputs symbols when square wave indicates -1 then it is very great opportunity to SELL pair1 and BUY Pair2 when square wave indicates +1 then it is very great opportunity to BUY pair1 and SELL Pair2 the inputs are : 2 pairs of symbols         then index value : i use 20 for M30 charts ( you can try other values : 40/50 for M15 , : 30 for M30 , : 10 for H1 ,
How to use Pair Trading Station Pair Trading Station is recommended for H1 time frame and you can use it for any currency pairs. To generate buy and sell signal, follow few steps below to apply Pair Trading Station to your MetaTrader terminal. When you load Pair Trading Station on your chart, Pair Trading station will assess available historical data in your MetaTrader platforms for each currency pair. On your chart, the amount of historical data available will be displayed for each currency pai
What are Heiken Ashi Candles? Heiken Ashi, derived from the Japanese term 'Heikin Ashi,' translates to average price bars. It's an indicator depicting price bars on a chart. Formula for Heiken Ashi candles: - Heiken Ashi opening price: (previous candle's opening + closing price) / 2 - Closing price Heiken Ashi: (opening + high + low + closing) / 4 - Heiken Ashi peak: Max of high, opening, or closing price - Heiken Ashi bottom price: Min of low, opening, or closing price How to Read Heik
Advanced Trend Regime
Shellard Securities (Pty) Ltd
The indicator has been designed to function on any time-frame and any pair.   This regime filter will help the trader better evaluate whether the current market is trending, and in which direction. It quickly reacts to changes in market dynamics using a series of advanced calculations. The user is able to select whether the calculation remains standard, or if a further filter constraint is added to the calculation.   A Yellow moving average of the signal has been included for the trader to smoot
Atomic Analyst
Issam Kassas
5 (1)
Zunächst einmal ist es erwähnenswert, dass dieser Handelsindikator nicht neu malt, nicht neu zeichnet und keine Verzögerung aufweist, was ihn sowohl für manuellen als auch für Roboterhandel ideal macht. Der Atom-Analyst ist ein PA-Preisaktionsindikator, der die Stärke und das Momentum des Preises nutzt, um einen besseren Vorteil auf dem Markt zu finden. Ausgestattet mit fortschrittlichen Filtern, die helfen, Rauschen und falsche Signale zu entfernen, und das Handelspotenzial zu erhöhen. Durch
Price Breakout pattern Scanner is the automatic scanner for traders and investors. It can detect following patterns automatically from your chart. Head and Shoulder - Common tradable pattern. Reverse Head and Shoulder - This pattern is the reverse formation of the Head and Shoulder. Double Top - When the price hits resistance level twice and decline toward the support level, the trader can anticipate sudden bearish breakout through the support level. Double Bottom - The double bottom pattern is
Käufer dieses Produkts erwarben auch
Präsentation des Miraculous Forex Indikators: Entfesseln Sie die Kraft präzisen Tradings Sind Sie es leid, nach dem besten Forex-Indikator zu suchen, der wirklich herausragende Ergebnisse in allen Zeitebenen liefert? Suchen Sie nicht weiter! Der Miraculous Forex Indikator ist da, um Ihre Trading-Erfahrung zu revolutionieren und Ihre Gewinne auf neue Höhen zu bringen. Basierend auf modernster Technologie und jahrelanger sorgfältiger Entwicklung steht der Miraculous Forex Indikator als Höhepunkt v
TrendMaestro
Stefano Frisetti
5 (2)
note: this indicator is for METATRADER4, if you want the version for METATRADER5 this is the link: TRENDMAESTRO recognizes a new TREND in the bud, he never makes mistakes. The certainty of identifying a new TREND is priceless. DESCRIPTION TRENDMAESTRO identifies a new TREND in the bud, this indicator examines the volatility, volumes and momentum to identify the moment in which there is an explosion of one or more of these data and therefore the moment in which prices have strong probability of f
Indicator : RealValueIndicator Description : RealValueIndicator is a powerful tool designed specifically for trading on the EURUSD pair. This indicator analyzes all EUR and USD pairs, calculates their real currency strength values, and displays them as a single realistic value to give you a head start on price. This indicator will tell you moves before they happen if you use it right. RealValueIndicator allows you to get a quick and accurate overview of the EURUSD currency pair tops and bottoms,
Natürlich, hier ist die Übersetzung in Deutsch: Vorstellung des Astronomie-Indikators für MT4: Dein ultimativer himmlischer Trading-Begleiter Bist du bereit, deine Trading-Erfahrung auf himmlische Höhen zu heben? Suche nicht weiter als unseren revolutionären Astronomie-Indikator für MT4. Dieses innovative Tool übertrifft herkömmliche Trading-Indikatoren und nutzt komplexe Algorithmen, um dir unvergleichliche astronomische Einblicke und präzise Berechnungen zu bieten. Ein Universum an Information
PZ Day Trading
PZ TRADING SLU
3.67 (3)
Dieser Indikator erkennt Preisumkehrungen im Zick-Zack, wobei nur Preisaktionsanalysen und ein Donchian-Kanal verwendet werden. Es wurde speziell für den kurzfristigen Handel entwickelt, ohne dass ein Nachlackieren oder ein Backpainting erforderlich ist. Es ist ein fantastisches Werkzeug für clevere Trader, die darauf abzielen, das Timing ihrer Operationen zu verbessern. [ Installationsanleitung | Update-Anleitung | Fehlerbehebung | FAQ | Alle Produkte ] Erstaunlich einfach zu handeln Es bi
Please send me Direct message on MQL5 CHAT after purchasing the Indicator for Training and Installation Support There are some additional files that is important to use with the Indicator . So be sure to contact me after purchasing the Indicator So that I can add you for training and support . If you find any difficulty with installation then send me Direct message here So that I can connect with you via Anydesk or Teamview for the product installation. " Smart Order Block Indicator " to find
Gann Signal
Kirill Borovskii
Gann Signal is a very simple indicator at first glance, but hidden inside is many years of experience in studying W.D.Ganna methods. The indicator gives accurate BUY/SELL signals, without redrawing. The indicator is very easy to use. All you need to do is attach it to your chart and follow its recommendations. The indicator constantly analyzes the market for entry opportunities. When such an opportunity appears, the indicator gives a signal in the form of an arrow. I repeat, all signals are NOT
Candle Power Pro
Thushara Dissanayake
4.33 (6)
Nutzen Sie die Kraft echter Volumeninformationen mit dem   Candle Power Pro-   Indikator. Dieses dynamische Tool erfasst die tatsächlichen Volumendaten für jede Kerze und stellt sie als Prozentsatz des Gesamtvolumens dar. Auf diese Weise können Sie den anhaltenden Kampf zwischen Käufern und Verkäufern auf dem Markt erkennen. Candle Power Pro zeigt den Kampf zwischen Käufern und Verkäufern als Prozentsatz des Gesamtvolumens an und gibt Ihnen wertvolle Einblicke in die Marktdynamik. Sie können Aus
Market Breaker Updated version 3
Allistair Kabelo Mandow
1 (1)
Features for software Main functions: Accurate entry signals WITHOUT REPAINTING! Once a signal appears, it remains valid! This is a significant distinction from repainting indicators that might provide a signal and then alter it, potentially leading to deposit losses. Now, you can enter the market with higher probability and precision. There's also a function to colour candles after an arrow appears until the target (take profit) is reached or a reversal signal appears . Display of STOP LOSS
Weis Wave with Alert
Trade The Volume Waves Single Member P.C.
4.79 (19)
Rental/Lifetime Package Options and Privileges' * For optimum results the yearly or lifetime package is suggested due to live training and Discord  channel trading with the  creator! Rent Monthly Six Months   Yearly/Lifetime Weis Wave with Speed with Alert+Speed Index x x x Manual  x x x Quick Set up Video x x x Blog x x x Lifetime Updates x x x Setup and Training Material x x Free Rectangle Break Alert Tool      x Discord Access Channel "The SI traders" x 2-hour live methodology traini
System Trend Pro - This is the best trend trading indicator!!! The indicator no repaint!!!   The indicator has   MTF   mode, which adds confidence to trading on the trend (   no repaint   ). How to trade? Everything is very simple, we wait for the first signal (big arrow), then wait for the second signal (small arrow) and enter the market in the direction of the arrow. (See screens 1 and 2.) Exit on the opposite signal or take 20-30 pips, close half of it, and keep the rest until the oppo
Full STO
Roman Smoroda
Vollständiger STO-Indikator (enthält alle Versionen der drei STO-Indikatoren: Premium, Gold, Silver) - STABLE TRADE OPTION ist für den automatischen Handel mit binären Optionen konzipiert.  VORSICHTIG LESEN!!!!! WICHTIG Erstellen Sie in einem Terminal zwei Vorlagen mit unterschiedlichen Verfallzeiten, eine Vorlage für 18:01, 18:02 mit Verfallzeiten von 1 bis 15 Minuten und eine Vorlage für 22:00 mit Verfallzeiten von 10 bis 20 Minuten. Gewinnrate: 71% in den letzten 5 Jahren Geldverwalt
Connect Indicator
Sukunthakan Ngernbamrung
Connect Indicator is a tool used for connecting indicators between the MQL market and MT4. The connected indicators are made by our group and can be used for other applications, such as sending messages to the Line application or Telegram application. If you have any questions, please don't hesitate to ask us to receive support. Function and indicator buffer Buffer one is the high price of the previous candle. Buffer two is the high price of the previous candle. Usage To connect indicators to fu
Idea: RSI ( Relative Strength Index) and CCI ( Commodity Channel Index ) are powerfull to solved the market.  This indicator has Smoothed Algorithmic signal of RSI and CCI. So that, it separates the market into buy and sell zones, these areas are marked with arrows, red for downtrend, green for uptrend. This algorithm has the effect of predicting the next trend based on the historical trend, so users need to be cautious when the trend has gone many candles. Please visit screenshots
DESCRIPTION The CHAOS INDICATOR has been developed to be used for the TRADING STRATEGY OF CHAOS, as described in the book. The book is in italian language only and can be obtained only on my website indicated below. DATAS COLLECTED AND SHOWN ON GRAPHS The CHAOS INDICATOR apply easily to any graph and any asset, and it is a TRADING FACILITATOR, as it identify immediately the following items on any graph: - The GP (= RIGHT PRICE) i.e. the price to which the asset should be attracted within 24
Gann Swing Structure
Kirill Borovskii
5 (1)
This indicator is based on the mathematics of the great trader W.D. Ganna. With its help, you can easily find strong levels by analyzing swings to find the optimal entry point. The indicator works on all instruments and all timeframes. The indicator is fully manual and has control buttons. All you need to do is press the NEW button, a segment will appear, which you can place on any movement, swing or even 1 candle that you want to analyze. By placing the segment, press the OK button. A grid (th
Divergenzen sind schwierig zu finden und seltener anzutreffen. Sie sind eines der zuverlässigsten Handelsszenarien. Dieser Indikator sucht automatisch mit Ihrem bevorzugten Oszillator nach regelmäßigen und versteckten Abweichungen. [ Installationsanleitung | Update-Anleitung | Fehlerbehebung | FAQ | Alle Produkte ] Einfach zu handeln Findet regelmäßige und versteckte Abweichungen Unterstützt viele bekannte Oszillatoren Implementiert Handelssignale basierend auf Ausbrüchen Zeigt geeignete
PZ Swing Trading
PZ TRADING SLU
5 (4)
Swing Trading ist der erste Indikator, der Schwankungen in Trendrichtung und mögliche Umkehrschwankungen erkennt. Es wird der in der Handelsliteratur weit verbreitete Baseline-Swing-Trading-Ansatz verwendet. Der Indikator untersucht mehrere Preis- und Zeitvektoren, um die aggregierte Trendrichtung zu verfolgen und erkennt Situationen, in denen der Markt überverkauft oder überkauft ist und zur Korrektur bereit ist. [ Installationsanleitung | Update-Anleitung | Fehlerbehebung | FAQ | Alle Produkte
A. Was ist A2SR ?   * Es ist ein führender technischer Indikator (kein Repaint, kein Verzögern). -- Orientierungshilfe : -- unter  https://www.mql5.com/en/blogs/post/734748/page4#comment_16532516 -- und  https://www.mql5.com/en/users/yohana/blog A2SR verfügt über eine spezielle Technik zur Bestimmung der Unterstützungsniveaus (Nachfrage) und des Widerstands (Angebot). Im Gegensatz zu der gewöhnlichen Methode, die wir im Internet gesehen haben, hat A2SR ein originelles Konzept zur Bestimmung d
Das technische Handelssystem von BB Reverse Arrows wurde entwickelt, um umgekehrte Punkte für Einzelhandelsentscheidungen vorherzusagen. Die aktuelle Marktsituation wird durch den Indikator analysiert und für mehrere Kriterien strukturiert: die Erwartung von Umkehrmomenten, potenziellen Wendepunkten, Kauf- und Verkaufssignalen. Der Indikator enthält keine überschüssigen Informationen, verfügt über eine visuelle verständliche Schnittstelle, mit der Händler angemessene Entscheidungen treffen k
Gold Channel is a volatility-based indicator, developed with a specific timing algorithm for the XAUUSD pair, which consists of finding possible corrections in the market. This indicator shows two outer lines, an inner line (retracement line) and an arrow sign, where the theory of the channel is to help identify overbought and oversold conditions in the market. The market price will generally fall between the boundaries of the channel. If prices touch or move outside the channel it is a tra
Gann Zone Pro
Kirill Borovskii
This indicator identifies and displays zones, as it were areas of strength, where the price will unfold. The indicator can work on any chart, any instrument, at any timeframe. The indicator has two modes. The indicator is equipped with a control panel with buttons for convenience and split into two modes. Manual mode: To work with manual mode, you need to press the NEW button, a segment will appear. This segment is stretched over the movement and the LVL button is pressed. The level is displayed
Full Forex Market View Dashboard
Opengates Success International
5 (2)
VOLLSTÄNDIGE FOREX-MARKTANSICHT Dashboard-Anzeige Dies ist ein benutzerdefinierter Indikator, der erstellt wurde, um Händlern einen vollständigen Überblick darüber zu geben, was auf dem Markt vor sich geht. Es verwendet Echtzeitdaten, um auf den Markt zuzugreifen und alle Informationen anzuzeigen, die für einen erfolgreichen Handel erforderlich sind. INSTALLATION: Bevor Sie diesen Indikator an Ihren Fenster-Chart anhängen, gehen Sie zum Market Watch Panel Ihres MT4 und AUSBLENDEN Sie al
The indicator is designed to work on any trading platform. The program is based on proprietary algorithms and W.D.Ganna's mathematics, allowing you to calculate target levels of price movement based on three points with the highest degree of certainty. It is a great tool for stock trading. The indicator has three buttons: NEW - call up a triangle for calculation. DEL - delete the selected triangle. DELS - completely remove all constructions. The probability of achieving the goals is more than 80
EZT Trend
Tibor Rituper
4 (1)
Der EZT-Trendindikator zeigt Ihnen den Trend, den Rückzug und die Einstiegsmöglichkeiten. Optionale Filterung und alle Arten von Warnungen sind verfügbar. E-Mail- und Push-Benachrichtigungsbenachrichtigungen werden hinzugefügt. Wir entwickeln auch einen EA basierend auf diesem Indikator, der bald verfügbar sein wird. Es handelt sich um einen multifunktionalen Indikator, der aus zwei Farbhistogrammen und einer Linie besteht. Es handelt sich um eine visuelle Darstellung der Richtung und Stärke
IA Trendx3 PRO
Marco Aurelio Santos Costa
What if God Created a Trade System? No miracles... Just see how mathematics can be effective in the market. We managed to combine technical analysis / price action into indicators, creating the best setup for trading, be it in Forex, Indices, or stocks. It took us 2 years to create something that really works, and now it's time for you to discover it. TrendX3 is a revolution in trend analysis. Based on advanced algorithms and real-time data, it provides valuable insights so that you can make inf
This is a trend Predictor. Honestly I have to give some credit to some few developers I know personally because they helped pulled this off.  The trend indicator uses special optics to direct the flow of price . it detects where the trend is moving into  It uses price action and a few other embedded custom indicator. You can use it in all timeframes and will be available at a much cooler price.  Please test this Indicator before buying to make sure you like what you see. I can't guarantee th
The 5X target indicator is an indicator that plots the optimal entry zone and the target for the trading day. It also plots a level where the stoploss can be moved to breakeven for a risk free trade which is 2X. This indicator has time window inputs. The default settings are from 02:00 to 19:00 CET+1 time zone. This indicator is based used with a direction bias for the day. I post the direction bias for several pairs in the comments section. Added a new feature Time Zone to help trade the highes
The breakout algorithm is a technique based on price, price features, to shape a breakout strategy. The strategy in this indicator will not be redrawn (none-repaint indicator), it is suitable for short or long term traders In the screenshot is the EURUSD pair, these currency pairs, commodities or stocks, it have similar strength *Non-Repainting (not redrawn) *For Metatrader4 Only *Great For Scalping *Great For Swing Trading *Arrow Entry, Green is Long, Red is Short *Works On Any Timeframe *Work
This is the finest structure marking you will ever find in any market. indicator is coded considering the actual structure any trader would use. indicator is coded based on actual candle breaks and not coded based on any pivot or predefined values or specific number of candles high and low. please check out the screenshot. if you want me to fine tune it according to your needs then i am open for it.
Weitere Produkte dieses Autors
Netting Scalper
Remi Passanello
5 (2)
Dieser Roboter ist Teil der RPTrade Pro Solutions-Systeme. Netting Scalper ist ein schneller Handelsroboter, der Ticks-Dynamik und ein Netting-System verwendet. Es ist so konzipiert, dass es von jedem verwendet werden kann, selbst der absolute Anfänger im Handel kann es verwenden. NUR für M1 konzipiert Verwendet Takes Profit, Stop Loss und Trailing Stop. Kann auch als Switch ohne SL/TP arbeiten Funktioniert mit beliebigen Paaren Wie funktioniert es Netting Scalper ist ein schneller M1 Scalper
TrendSwift
Remi Passanello
TrendSwift Es ist so konzipiert, dass es von jedem genutzt werden kann, selbst der absolute Anfänger im Trading kann es nutzen. NIEMALS neu streichen. Die Angaben erfolgen von Schlusskurs zu Schlusskurs. Konzipiert für den alleinigen Gebrauch, es sind keine weiteren Indikatoren erforderlich. Wie funktioniert es TrensSwift verwendet einen internen Trendindikator in Kombination mit einem Preisaktions- und Fibonacci-System. Die Strategie wird strikt angewendet, ohne Nachberechnungen, Glättung
PipsMinerFast
Remi Passanello
3 (2)
PipsMinerFast is mainly a trend follower with a bit of price action. At first sight, you will think: "Oh well, one more indi showing everything I've missed today but not giving a clue about what will happen..." Okay, you can believe this when just looking at it but start a test it and you will see that PipsMinerFast: Shows you the trend immediately Is not repainting Has minimum lagging Counts pips immediately Adapts to your spread level Works from M1 to H1 Is heading in the right direction 90% o
Scalp Tool
Remi Passanello
5 (1)
Scalp Tool ist ein sehr effizienter Gegentrendindikator. Es ist so konzipiert, dass es von jedem verwendet werden kann, selbst der absolute Neuling im Handel kann es verwenden. Scalp Tool wird nicht neu gezeichnet. Indikationen werden von nahe zu nahe oder von nahe zu einem sichtbaren Niveau gegeben. Das Kopfhautwerkzeug kann allein verwendet werden, es sind keine weiteren Indikatoren erforderlich. Scalp Tool zeigt an Wo Sie Ihre Trades eröffnen können. Wann sie geschlossen werden müssen.
Trend Wave
Remi Passanello
5 (5)
Trend Wave ist ein fortschrittliches Trading-Tool; Trend- und Gegenhandelsindikator basierend auf Unterstützungen und Widerständen. Trend Wave ist so konzipiert, dass jederzeit aktiv gehandelt werden kann Trend Wave hinkt nicht hinterher Hinweise werden am Anfang einer neuen Kerze gegeben Trendwelle zeigt an Das Fenster des Indikators zeigt Ihnen die tatsächliche Anzahl von S und R, um den Gesamttrend zu erhalten Die weiße Linie zeigt den momentanen Trend. Im Hauptdiagrammfenster werden f
Trend Compound
Remi Passanello
3 (2)
Trend Compound is a trend indicator using a mix of 3 internal other indicators. Please have a look at "how to test in the tester" at the bottom of this page before to test. It's designed to be used by anyone, even the complete newbie in trading can use it. Trend Compound does not repaint . Indications are given from close to close. Trend Compound can be used alone , no other indicators are required. Trend Compound indicates Where to open your trades. When to close them. The potential quantity
NIEMALS neu lackieren. Indikationen werden von nah zu nah gegeben. Für den alleinigen Gebrauch konzipiert, es sind keine weiteren Indikatoren erforderlich. Gibt Ihnen zu Beginn des Tages den Trend und den potenziellen Take-Profit. Eine spezifische Grafik zeigt Ihnen den potenziellen Gewinn gemäß den historischen Daten. Wie funktioniert es Breakout Pro Scalper Solution verwendet eine Breakout-Strategie in Kombination mit Kursbewegungen und dynamischer Unterstützung und Widerständen. Der Nach
Waxter D1
Remi Passanello
Wie funktioniert es Der spezifische eingebettete WAX-Indikator wird verwendet, um den Trend zu bestimmen Wenn ein Trend gemäß den Parametern erkannt wird, wird ein Handel in seine Richtung gestartet Trades werden entweder durch TP/SL/TS oder durch den nächsten entgegengesetzten Trade gestoppt. Keine Absicherung, keine Durchschnittsbildung. Ein Trade muss enden, bevor der nächste beginnen kann. WAXTER kontrolliert nur die Bareröffnung, dh es arbeitet im Eröffnungspreismodus. WAXTER funktionier
BPSPanel
Remi Passanello
BPS Panel Breakout Pro Scalper Solution Panel This indicator is part of the   RPTrade Pro Solutions  systems. BPS Panel   is a daily trend indicator using Price Action, Dynamic Support and Resistances. It's designed to be used by anyone, even the absolute beginner in trading can use it. NEVER repaints . Indications are given   from close to close . Designed to   be used alone , no other indicators are required. Gives you the trend and potential Take Profit at the beginning of the day. How
DTS ist ein täglicher Trendindikator, der Price Action, Dynamic Support und Resistances verwendet. Es ist so konzipiert, dass es von jedem verwendet werden kann, selbst der absolute Anfänger im Handel kann es verwenden. NIEMALS neu lackieren. Indikationen werden von nah zu nah gegeben. Für den alleinigen Gebrauch konzipiert, es sind keine weiteren Indikatoren erforderlich. Gibt Ihnen zu Beginn des Tages den Trend und den potenziellen Take-Profit. Wie funktioniert es DTS verwendet eine Break
Der tägliche Trader   Dieser Indikator ist Teil der Systeme von RPTrade Pro Solutions. Der tägliche Trader ist ein täglicher Indikator, der nur Statistiken verwendet. Es ist so konzipiert, dass es von jedem verwendet werden kann, selbst der absolute Anfänger im Handel kann es verwenden. NIEMALS neu lackieren. Indikationen werden von nah zu nah gegeben. Für den alleinigen Gebrauch konzipiert, es sind keine weiteren Indikatoren erforderlich. Gibt Ihnen klare und einfache Hinweise Wie funktion
GannRS Trend Scalper   GannRS is an advanced trading tool based on Gann Law and Supports and Resistances. designed to have an   active trading at any time not lagging Indications are given at the beginning of a new candle Please watch the full tutorial video. How to use GannRS Very easy to set up... Put it on your chart Adjust inputs Inputs Show Resistance and support : [bool]  true = Shows R/S on chart false = does not show Show Levels :[bool]  true = Shows levels on the chart false = doe
Für den alleinigen Gebrauch konzipiert, es sind keine weiteren Indikatoren erforderlich. Ein spezifisches Diagramm zeigt Ihnen den Gewinn und den eventuellen Drawdown gemäß den historischen Daten. Wie funktioniert es Scalper Pro Line verwendet einen internen Trendindikator in Kombination mit einem Preisaktionssystem. Beim Start analysiert das System die 10000 ersten Balken der Geschichte, um die besten Einstellungen zu finden. Dann werden diese Einstellungen auf die gesamte Historie angewen
UniversalTrader
Remi Passanello
4.64 (11)
Universal Trader (UT) This EA is part of the  RPTrade Pro Solutions  systems. UT  is a trading robot using a trend and oscillator indicators.  It's designed to be used by anyone, even the absolute beginner in trading can use it. Designed for every TimeFrames Uses Takes Profit, Stop Loss and Trailing stop. Can also work as a switch without SL/TP Works with any pairs How does it work UT is a trend follower.  It's using A build in Supertrend Indicator to find trades entries and Parabolic SAR to
GannRS Trend Scalper   GannRS is an advanced trading tool based on Gann Law and Supports and Resistances. designed to have an   active trading at any time not lagging Indications are given at the beginning of a new candle Please watch the full tutorial video. How to use GannRS Very easy to set up... Put it on your chart Adjust inputs Inputs Show Resistance and support : [bool]  true = Shows R/S on chart false = does not show Show Levels :[bool]  true = Shows levels on the chart false = doe
Überblick: Straddle Scalper ist ein EA, der Straddles zu bestimmten Stunden und/oder Tagen eröffnet. Der Take Profit wird dynamisch anhand des ATR-Verhältnisses generiert. Anforderungen: Ein Hedging-Konto wird benötigt, um Straddles zu eröffnen. Eine strikte Optimierung (in offenen Preisen) ist obligatorisch. Was ist ein Straddle? Ein Straddle ist die Aktion, um gleichzeitig einen Kauf und einen Verkauf zu eröffnen. Wie funktioniert dieser EA? Nach erfolgreicher Optimierung eröffn
Auswahl:
Keine Bewertungen
Antwort auf eine Rezension
Version 3.0 2021.06.15
Bug solved.
New Multi trades feature added.
Version 2.0 2021.05.27
Arrows Bug Fixed