• Übersicht
  • Bewertungen (5)
  • Diskussion (14)
  • Neue Funktionen

Candle Counter RSJ

5
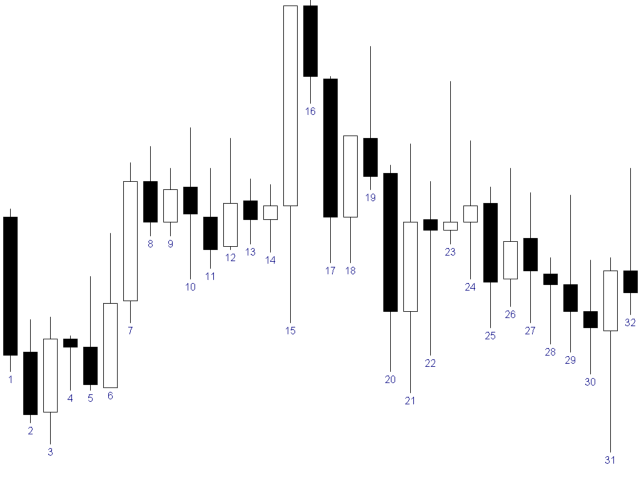
Candle Counter ist ein Indikator, der die Anzahl der Kerzen ab der ersten Kerze des Tages druckt.
Die erste Kerze des Tages ist die Nummer 1 und jede neue Kerze wird in dieser Zählung um 1 erhöht.

Eingabeparameter

  • Wählen Sie aus gerade, ungerade oder alle
  • Entfernung von Kerze zum Drucken der Zahl
  • Schriftgröße des Textes
  • Schriftfarbe des Textes


Wenn Sie noch Fragen haben, kontaktieren Sie mich bitte per Direktnachricht: https://www.mql5.com/de/users/robsjunqueira/

Bewertungen 5
gfedrigo
94
gfedrigo 2021.10.15 13:19 
 

great tool

Diogo Gomes
169
Diogo Gomes 2021.09.26 14:14 
 

obrigado

Fabio_Novaes
175
Fabio_Novaes 2021.06.30 21:41 
 

como estava sentindo falta desse contador, obrigado!

Empfohlene Produkte
Noize Absorption Index - is the manual trading system that measures the difference of pressure between bears forces and bulls forces. Green line - is a noize free index that showing curent situation. Zero value of index shows totally choppy/flat market.Values above zero level shows how powerfull bullish wave is and values below zero measures bearish forces.Up arrow appears on bearish market when it's ready to reverse, dn arrow appears on weak bullish market, as a result of reverse expectation.
199 USD
Double HMA MTF for MT5
Pavel Zamoshnikov
5 (2)
This is an advanced multi-timeframe version of the popular Hull Moving Average (HMA) Features Two lines of the Hull indicator of different timeframes on the same chart. The HMA line of the higher timeframe defines the trend, and the HMA line of the current timeframe defines the short-term price movements. A graphical panel with HMA indicator data from all timeframes at the same time . If the HMA switched its direction on any timeframe, the panel displays a question or exclamation mark with a tex
30 USD
Modified Rainbow
Rafael Alejandro Rey Alves
Modified Rainbow   The Modified Rainbow indicator is intended to work in different scenarios. The indicator uses a combination of technical indicators to detect buy or sell opportunities (different Moving Averages and other technical indicators). The indicator works with any currency pair, stocks, cryptocurrencies and synthetic indices. The indicator can be used for both traditional trading and binary options. The indicator works with any time frame, from M1 to MN. When the blue arrow
30 USD
An indicator of pattern #31 ("Long Island") from Encyclopedia of Chart Patterns by Thomas N. Bulkowski. The second gap is in the opposite direction. Parameters: Alerts - show alert when an arrow appears   Push - send a push notification when an arrow appears (requires configuration in the terminal) GapSize - minimum gap size in points ArrowType - a symbol from 1 to 17 ArrowVShift - vertical shift of arrows in points   ShowLevels - show levels ColUp - color of an upward line ColDn - color of a
30 USD
Stochastic R
Antony Augustine
Stochastic  Reversal  allows you to recognize reversals professionally. Stochastic Indicator: This technical indicator was developed by George Lane more than 50 years ago. The reason why this indicator survived for so many years is because it continues to show consistent signals even in these current times. The Stochastic indicator is a momentum indicator that shows you how strong or weak the current trend is. It helps you identify overbought and oversold market conditions within a trend.  Rules
30 USD
This indicator uses the metaquotes ZigZag indicator as base to plot fibonacci extension and fibonacci retracement based in the Elliot waves. A fibonacci retracement will be plotted on every wave draw by the ZigZag. A fibonacci extension will be plotted only after the 2nd wave. Both fibonacci will be updated over the same wave tendency. Supporting until 9 consecutive elliot waves. Parameters: Depth: How much the algorithm will iterate to find the lowest and highest candles Deviation: Amoun
30 USD
Trend Monitor MT5
Pavel Zamoshnikov
4 (4)
The indicator generates early signals basing on ADX reading data combined with elements of price patterns. Works on all symbols and timeframes. The indicator does not redraw its signals. You see the same things on history and in real time. For better visual perception signals are displayed as arrows (in order not to overload the chart). Features The best results are obtained when the indicator works on two timeframes. For example: M30 – the indicator shows the main trend; M5 – the indicator ge
30 USD
Introducing the Candle Countdown Timer for MetaTrader 5 available on MT4 , an essential indicator that helps you manage your trading time effectively by keeping you informed of market open and close times. This powerful tool displays the remaining time before the current candle closes and a new one forms, allowing you to make well-informed trading decisions. Features: - Asia Range with the option to extend the range - Broker Time, New York, London Time: This indicator shows the current broker
FREE
Alpha Binary Pro
Rafael Alejandro Rey Alves
1 (1)
The Alpha Binary Pro indicator is intended to work in different scenarios. This indicator uses a combination of technical indicators to detect buy or sell opportunities. The indicator works with any currency pair, stocks, cryptocurrencies and synthetic indices. The indicated can be used for both traditional trading and binary options. The indicator works with any time frame, from M1 to MN. When the blue arrow is pointing upwards this indicates that the signal is to buy. When the red
30 USD
Time And Sales Delta
Evgeny Shevtsov
5 (1)
The indicator displays the delta and the cumulative delta based on the "Time & Sales" deals list data. In addition to the standard timeframes, the indicator displays data regarding the seconds timeframes (S5, S10, S15, S20, S30) to choose from. Using the rectangle, user can select an arbitrary area in the indicator subwindow to view the ratio of the volumes of deals of buyers and sellers within this area. Indicator features: The indicator works correctly only on those trading symbols for whi
30 USD
Renko Gold
Ignacio Agustin Mene Franco
Renko Gold! clearly indicates the floors and ceilings where it goes from 4 lines, the line below that marks the floor in green confirming with the thinnest line clarifies the purchase entry, the same is for sale, the top line marks the ceiling and the thinnest red line marks the sale, This indicator works for all temporalities! For Forex and Synthetic Indices markets! It also works for crypto markets! Good profit! World Investor.
40 USD
Trendseite - ein technischer Indikator zur Bestimmung des Trends. Es ist eine Reihe von mehreren vollwertigen Handelsstrategien. Der Indikator verwendet ein fortschrittliches Trendfiltersystem, hat ein statistisches Panel, berechnet Einstiegs- und Ausstiegsniveaus und berechnet das dynamische Trailing-Stop-Niveau. Geeignet für jede Art von Symbolen, zeichnet seine Signale und Ergebnisse niemals neu. Ein umfassendes Tool für den professionellen Trendhandel. Das Set des Trend Side-Indikators um
50 USD
Supply and Demand Indicator + FREE Currency Strength Meter ADD-ON Looking for a powerful tool that can help you identify the most reactive zones in the forex market? Our supply and demand indicator for MetaTrader 4 and 5 is exactly what you need. With its advanced algorithms and real-time analysis, this indicator helps traders of all experience levels make informed trading decisions. The supply and demand indicator is a cutting-edge tool that helps traders identify areas where buyers and sellers
30 USD
DUCHOAN99 would like to send you the  indicator   ATR (Keltner) Channels Multi TF Real Value for MT5 . Please download the demo to see if the indicator helps you or not before deciding to buy this indicator. 1.   KEY TAKEAWAYS Keltner Channels are volatility-based bands that are placed on either side of an asset's price and can aid in determining the direction of a trend. The exponential moving average (EMA) of a Keltner Channel is typically 20 periods, although this can be adjusted if desired
30 USD
To download MT4 version please click here . This is the exact conversion from TradingView: "WaveTrend [LazyBear]" By "zeusuk3". One of the coolest indicators out there to detect overbought and oversold zones. It can be used as a part of more complicated strategy and for confirming a potential trade setup. There are buffers to use in EAs also. The indicator is loaded light and non-repaint. - You can message in private chat for further changes you need. Thanks for downloading 
40 USD
Supertrend indicator uses a combination of a moving average and average true range to detect the trend of a trading instrument. Supertrend indicator for MetaTrader 5 easily shows the trend as a line following the price. Triple SuperTrend Histo indicator  calculate  three supertrends to show the trend as a histogram. Changing the color from red to green means you can BUY , from green to red means you can SELL . Description of the method of drawing a histogram. The price is above the EMA 20
99 USD
Swing Tracer
Ely Alsedy
5 (2)
it depends on ATR period to get swing points to help make better trading decisions  blue dot and red dot is the default color scheme of course you can change it later if you'd like  you can change the following : ATR PERIOD  sending notifications number of times to send notifications  sending notifications to your smart phone that's it very simple to use just drag and drop and follow the trend 
30 USD
Rainbow EA MT5
Jamal El Alama
Description : Rainbow EA MT5 is a simple Expert advisor based on   Rainbow MT5 indicator witch is based on Moving average with period 34. The indicator is incorporated in the EA, therefore, it is not required for the EA to operate, but if you wish, you can download it from   my product page . The Expert Advisor settings are as follows : Suitable for Timeframes up to H1 The parameters below can be set according to your trading rules. StopLoss ( Stop Loss in pips) TakeProfit ( Take Profit in pi
59 USD
Dies ist ein MTF-Indikator für Unterstützungs- und Widerstandsniveaus basierend auf den   Extremwerten des Advanced ZigZag Dynamic   und/oder   Extended Fractal   Indikators mit Preisetiketten (kann deaktiviert werden). Für den MTF-Modus können höhere TFs ausgewählt werden. Standardmäßig werden die Ebenen basierend auf ZigZag-Indikatorpunkten generiert. Fraktale Indikatorpunkte können auch zusammen mit ZigZag oder stattdessen verwendet werden. Um die Verwendung zu vereinfachen und CPU-Zeit zu sp
30 USD
MetaCOT 2 is a set of indicators and specialized utilities for the analysis of the U.S. Commodity Futures Trading Commission reports. Thanks to the reports issued by the Commission, it is possible to analyze the size and direction of the positions of the major market participants, which brings the long-term price prediction accuracy to a new higher-quality level, inaccessible to most traders. These indicators, related to the fundamental analysis, can also be used as an effective long-term filter
30 USD
Das 123-Muster ist eines der beliebtesten, leistungsstärksten und flexibelsten Diagrammmuster. Das Muster besteht aus drei Preispunkten: einem Boden, einem Gipfel oder Tal und einem Fibonacci-Retracement zwischen 38,2% und 71,8%. Ein Muster gilt als gültig, wenn der Preis jenseits des letzten Gipfels oder Tals abbricht, in dem der Indikator einen Pfeil zeichnet, einen Alarm auslöst und der Handel platziert werden kann. [ Installationsanleitung | Update-Anleitung | Fehlerbehebung | FAQ | Alle Pr
75 USD
Premium-Level ist ein einzigartiger Indikator mit mehr als 80% Genauigkeit der richtigen Vorhersagen! Dieser Indikator wurde von den besten Trading-Spezialisten seit mehr als zwei Monaten getestet! Den Indikator des Autors finden Sie nirgendwo anders! Anhand der Screenshots können Sie sich von der Genauigkeit dieses Tools überzeugen! 1 ist ideal für den Handel mit binären Optionen mit einer Ablaufzeit von 1 Kerze. 2 funktioniert bei allen Währungspaaren, Aktien, Rohstoffen, Kryptowähr
1 100 USD
KT Horizontal Lines MT5
KEENBASE SOFTWARE SOLUTIONS
In MetaTrader, plotting multiple   horizontal lines   and then tracking their respective price levels can be a hassle. This indicator automatically plots multiple horizontal lines at equal intervals for setting price alerts, plotting support and resistance levels, and other manual purposes. This indicator is suitable for Forex traders who are new and looking for chances to make quick profits from buying and selling. Horizontal lines can help traders find possible areas to start trading when the
30 USD
Ichimoku Aiko MTF
Michael Jonah Randriamampionontsoa
Ichimoku Aiko MTF is a collection of technical indicators that show support and resistance levels, as well as momentum and trend direction. It is a multi-timeframe indicator so you don't need to change the chart timeframe when you want to see the ichimoku clouds on a higher timeframe.  eg. The chart timeframe is M15 and you want to see on the M15 timeframe chart the H1 ichimoku indicators (the ichimoku in Metatrader can't do that) that's why you need to use Ichimoku Aiko MTF.
31 USD
An indicator of patterns #24 and #26 ("Head and Shoulders") from Encyclopedia of Chart Patterns by Thomas N. Bulkowski. Parameters: Alerts - show alert when an arrow appears   Push - send a push notification when an arrow appears (requires configuration in the terminal) PeriodBars - indicator period K - an additional parameter that influences the accuracy of pattern shape recognition ArrowType - a symbol from 1 to 17 ArrowVShift - vertical shift of arrows in pixels   ShowLevels - show levels Col
30 USD
A professional tool for trading - the divergence indicator between the WPR and the price, which allows you to receive a signal about a trend reversal in a timely manner or catch price pullback movements (depending on the settings). The indicator settings allow you to adjust the strength of the divergence due to the angle of the WPR peaks and the percentage change in price, which makes it possible to fine-tune the signal strength. The indicator code is optimized and is tested very quickly as par
37 USD
Indikator zur Bestimmung von Flat und Trend. Wenn der Preis unter einem der beiden Histogramme und zwei Linien (rot und blau) liegt, ist dies eine Verkaufszone. Beim Kauf dieser Version des Indikators, MT4-Version für ein echtes und ein Demo-Konto - als Geschenk (zum Erhalten, schreiben Sie mir eine private Nachricht)! Wenn der Preis über einem der beiden Histogramme und zwei Linien (rot und blau) liegt, ist dies eine Kaufzone. MT4-Version: https://www.mql5.com/en/market/product/3793 Wenn der P
69 USD
Your Trend Friend
Luigi Nunes Labigalini
The trend is your friend! Look at the color of the indicator and trade on that direction. It does not  repaint. After each candle is closed, that's the color of the trend. You can focus on shorter faster trends or major trends, just test what's most suitable for the symbol and timeframe you trade. Simply change the "Length" parameter and the indicator will automatically adapt. You can also change the color, thickness and style of the lines. Download and give it a try! There are big movements
99 USD
TrendDetect
Pavel Gotkevitch
The Trend Detect indicator combines the features of both trend indicators and oscillators. This indicator is a convenient tool for detecting short-term market cycles and identifying overbought and oversold levels. A long position can be opened when the indicator starts leaving the oversold area and breaks the zero level from below. A short position can be opened when the indicator starts leaving the overbought area and breaks the zero level from above. An opposite signal of the indicator can
30 USD
This is Gekko's Cutomized Relative Strength Index (RSI), a customized version of the famous RSI indicator. Use the regular RSI and take advantage two entry signals calculations and different ways of being alerted whenever there is potential entry or exit point. Inputs Period: Period for the RSI calculation; How will the indicator calculate entry (swing) signals: 1- Produces Exit Signals for Swings based on RSI entering and leaving Upper and Lower Levels Zones; 2- Produces Entry/Exit Signals fo
50 USD
Käufer dieses Produkts erwarben auch
ICT, SMC, SMART MONEY CONCEPTS, SMART MONEY, Smart Money Concept, Support and Resistance, Trend Analysis, Price Action, Market Structure, Order Blocks, BOS/CHoCH,   Breaker Blocks ,  Momentum Shift,   Supply&Demand Zone/Order Blocks , Strong Imbalance,   HH/LL/HL/LH,    Fair Value Gap, FVG,  Premium  &   Discount   Zones, Fibonacci Retracement, OTE, Buy Side Liquidity, Sell Side Liquidity, BSL/SSL Taken, Equal Highs & Lows, MTF Dashboard, Multiple Time Frame, BigBar, HTF OB, HTF Market Structur
65 USD
Dies ist ein Indikator für MT5, der genaue Signale für den Einstieg in einen Handel ohne Repainting (Neuzeichnen) liefert. Er kann auf alle Finanzwerte angewendet werden: Forex, Kryptowährungen, Metalle, Aktien, Indizes. Er liefert ziemlich genaue Schätzungen und sagt Ihnen, wann es am besten ist, eine Position zu eröffnen und zu schließen. Sehen Sie sich das Video (6:22) mit einem Beispiel für die Verarbeitung nur eines Signals an, das sich für den Indikator gelohnt hat! Die meisten Händler ver
125 USD
Gold Stuff mt5
Vasiliy Strukov
4.97 (106)
Gold Stuff mt5-Ein Trendindikator, der speziell für Gold entwickelt wurde, kann auch auf allen Finanzinstrumenten verwendet werden. Der Indikator wird nicht neu gezeichnet und verzögert sich nicht. Empfohlener Zeitrahmen H1. WICHTIG! Kontaktieren Sie mich sofort nach dem Kauf, um Anweisungen und Bonus zu erhalten! DATEN Draw Arrow - inkl.aus. zeichnen von Pfeilen in einem Diagramm. Alerts-inkl.aus.akustische Warnungen. E - mail notification-inkl.aus. benachrichtigungen per E-Mail. Puch-
30 USD
AW Trend Predictor MT5
Alexander Nechaev
5 (33)
Die Kombination von Trend- und Aufschlüsselungsebenen in einem System. Ein fortschrittlicher Indikatoralgorithmus filtert Marktrauschen, bestimmt den Trend, Einstiegspunkte sowie mögliche Ausstiegsniveaus. Indikatorsignale werden in einem Statistikmodul aufgezeichnet, das es Ihnen ermöglicht, die am besten geeigneten Tools auszuwählen, die die Wirksamkeit der Signalhistorie zeigen. Der Indikator berechnet Take-Profit- und Stop-Loss-Marken. Handbuch und Anleitung ->   HIER   / MT4-Version ->   H
55 USD
Trend Screener Pro MT5
STE S.S.COMPANY
4.87 (38)
Trendindikator, bahnbrechende, einzigartige Lösung für Trendhandel und -filterung mit allen wichtigen Trendfunktionen in einem Tool! Es handelt sich um einen 100 % nicht neu zu malenden Multi-Timeframe- und Multi-Währungs-Indikator, der für alle Symbole/Instrumente verwendet werden kann: Forex, Rohstoffe, Kryptowährungen, Indizes und Aktien. Trend Screener ist ein effizienter Trendfolgeindikator, der Pfeiltrendsignale mit Punkten im Diagramm liefert. Die Funktionen, die im Trendanalysator-Indika
50 USD
Werden Sie Breaker Trader und profitieren Sie von Änderungen der Marktstruktur, wenn sich der Preis umkehrt. Der Order Block Breaker Indikator zeigt an, wann sich eine Trend- oder Preisbewegung der Erschöpfung nähert und bereit ist, sich umzukehren. Es weist Sie auf Änderungen in der Marktstruktur hin, die normalerweise auftreten, wenn eine Umkehrung oder ein größerer Rückzug bevorsteht. Der Indikator verwendet eine proprietäre Berechnung, die Ausbrüche und Preisdynamik identifiziert. Jedes
49 USD
Matrix Arrow Indicator MT5
Juvenille Emperor Limited
5 (11)
Matrix Arrow Indicator MT5   ist ein einzigartiger 10-in-1-Trend, der zu   100 % nicht neu gezeichnet   werden kann. Multi-Timeframe-Indikator, der für alle Symbole/Instrumente verwendet werden kann:   Forex ,   Rohstoffe ,   Kryptowährungen ,   Indizes ,   Aktien .  Der  Matrix Arrow Indicator MT5  wird den aktuellen Trend in seinen frühen Stadien bestimmen und Informationen und Daten von bis zu 10 Standardindikatoren sammeln, die sind: Durchschnittlicher Richtungsbewegungsindex (ADX) Rohstoff
75 USD
Owl Smart Levels MT5
Sergey Ermolov
5 (7)
Indikator-Leitfaden  |  Owl Smart Levels-Strategie  |   MT4-Version  |  Wie installiert man?   |   FAQ Der Owl Smart Levels Indikator ist ein komplettes Handelssystem innerhalb eines Indikators, der so beliebte Marktanalysetools wie die fortschrittlichen Fraktale von Bill Williams , Valable ZigZag, das die richtige Wellenstruktur des Marktes aufbaut, und Fibonacci-Levels , die die genauen Einstiegslevels markieren, enthält in den Markt und Orte, um Gewinne mitzunehmen. Eine detaillierte Beschre
97 USD
Der Forex TPA Indikator deckt die wahren Aktionen der Marktmacher auf, immer dann wenn sie passieren. "Kämpfe nicht gegen die Marktmacher an, sondern folge ihnen", ist wohl der beste Rat, den ein Trader bekommen kann. Der TPA Indikator zeigt jedesmal seine Signale an wenn die Bullen definitiv stärker sind als die Bären und umgekehrt. Dieser Indikator wurde VON Tradern FÜR Trader gemacht und ist 100% NICHT NACHZEICHNEND! Signale werden STRENG am Schluss einer Kerze  generiert. Das sagen unsere Ku
168 USD
Blahtech Supply Demand MT5
Blahtech Limited
4.45 (11)
Supply Demand uses previous price action to identify potential imbalances between buyers and sellers. The key is to identify the better odds zones, not just the untouched ones. Blahtech Supply Demand indicator delivers functionality previously unavailable on any trading platform. This 4-in-1 indicator not only highlights the higher probability zones using a multi-criteria strength engine, but also combines it with multi-timeframe trend analysis, previously confirmed swings and engulfing detecto
99 USD
Market Profile defines a number of day types that can help the trader to determine market behaviour. A key feature is the Value Area, representing the range of price action where 70% of trading took place. Understanding the Value Area can give traders valuable insight into market direction and establish the higher odds trade. It is an excellent addition to any system you may be using. Blahtech Limited presents their Market Profile indicator for the MetaTrader community. Inspired by Jim Dalton’s
99 USD
Blahtech VWAP - Volume Weighted Average Price (VWAP) is the ratio of price to total volume. It provides an average price over a specified time interval.  Links [  Install  |  Update  |  Documentation   ] Feature Highlights Configurable VWAP Line Sessions, intervals, anchored or continuous Previous day settlement line Standard Deviation bands Alerts at bar close or real time Automatic Broker or Tick volumes Significantly reduced CPU usage Input Parameters Max Bars   - Restrict the number of
49 USD
Market Structure Patterns
Samuel Manoel De Souza
5 (7)
The best smart money concepts indicator ever created, now available for Metatrader. The indicator displays the main market structures, including: Higher highs and lows (HH, HL) Lower highs and lowes (LH, LL) Equal highs and lows (EQH, EQL) Order blocks (OB) Fair value gaps (FVG) Break of structures (BoS) Change of character (CHoCH) Prior day, week and month highs and lowes (PDH, PDL, PWH, ...) Premium and Discount zones With a lot of parameters the users can customize the swing length and the st
30 USD
XQ Indicator MT5
Marzena Maria Szmit
5 (1)
The signal conditions are a combination of three indicators, and XQ Forex Indicators only display  medium and long-term trends . The indicator's efficacy has been improved with the addition of a filter that blocks out false signals. The XQ Forex Indicator can be used on  FX pairs, CFDs, and Cryptocurrencies . There are two type of signals:  Buy or Sell and Big Long or Big Short It is possible to enable sending emails when a major trend-change signal is detected, as well as to display the alerts
179 USD
Advanced Supply Demand MT5
Bernhard Schweigert
4.36 (11)
Derzeit 33% Rabatt! Die beste Lösung für jeden Anfänger oder erfahrenen Händler! Dieser Indikator ist ein einzigartiges, qualitativ hochwertiges und erschwingliches Trading-Tool, da wir eine Reihe von proprietären Funktionen und eine neue Formel integriert haben. Mit diesem Update werden Sie in der Lage sein, doppelte Zeitrahmenzonen anzuzeigen. Sie können nicht nur einen höheren TF (Zeitrahmen) anzeigen, sondern sowohl den Chart-TF als auch den höheren TF: SHOWING NESTED ZONES. Alle Supply Dema
199 USD
Strong Support mt5
Vasiliy Strukov
5 (6)
Unterstützungs- und Widerstandsniveaus sind seit langem ein mächtiges Werkzeug für die Marktanalyse. Der Strong Support Indikator baut Unterstützungsniveaus auf lokalen Preistiefs und Widerstandsniveaus auf lokalen Preishochs auf. Meine anderen Entwicklungen finden Sie hier Es wird empfohlen, in Verbindung mit einem Trendindikator wie Gold Stuff zu verwenden, um den Trend zu handeln und gleichzeitig Konsolidierungs- oder Umkehrzonen zu definieren sowie Stop-Loss und Take-Profit auf Unterstü
30 USD
MetaBands M5
Vahidreza Heidar Gholami
5 (2)
MetaBands verwendet leistungsstarke und einzigartige Algorithmen, um Kanäle zu zeichnen und Trends zu erkennen, sodass es Tradern potenzielle Punkte für den Einstieg und Ausstieg aus Trades bieten kann. Es ist ein Kanalindikator sowie ein leistungsstarker Trendindikator. Es umfasst verschiedene Arten von Kanälen, die einfach durch Verwendung der Eingabeparameter zusammengeführt werden können. MetaBands verwendet alle Arten von Warnmeldungen, um Benutzer über Marktereignisse zu informieren. Funkt
129 USD
Trend Line Map Pro MT5
STE S.S.COMPANY
4.8 (5)
Trend Line Map Indicator ist ein Add-On für Trend Screener Indicator. Es arbeitet als Scanner für alle Signale, die vom Trendscreener (Trendliniensignale) erzeugt werden. Es ist ein Trend Line Scanner basierend auf dem Trend Screener Indicator. Wenn Sie keinen Trend Screener Pro Indicator haben, funktioniert die Trend Line Map Pro nicht. It's a Trend Line Scanner based on Trend Screener Indicator. If you don't have Trend Screener Pro Indicator,     the Trend Line Map Pro will not work .
50 USD
Auto Order Block with break of structure Detect Break of Structure , Mark Order Block and draw Entry / Stop and Risk to Reward lines when Order block is touch by price with Alert. Trend is Manually set to filter signals in a direction by a button on the chart. Entry / Stop and Risk to Reward lines can also be switch on / off by button on chart. Futures Auto Mark Break of Structure Auto Mark Order block Auto Mark higher time frame Point Of  Interest ( POI ) Popup Alert when BoS , Order block
55 USD
Introduction to X3 Chart Pattern Scanner X3 Cherart Pattern Scanner is the non-repainting and non-lagging indicator detecting X3 chart patterns including Harmonic pattern, Elliott Wave pattern, X3 patterns, and Japanese Candlestick patterns. Historical patterns match with signal patterns. Hence, you can readily develop the solid trading strategy in your chart. More importantly, this superb pattern scanner can detect the optimal pattern of its kind. In addition, you can switch on and off individu
250 USD
Italo Volume Indicator MT5
Italo Santana Gomes
4.69 (13)
BUY INDICATOR AND GET EA FOR FREE AS A BONUS + SOME OTHER GIFTS! ITALO VOLUME INDICATOR  is the best volume indicator ever created, and why is that? The Indicator works on all time-frames and assets, indicator built after 6 years of experience on forex and many other markets. You know many volume indicators around the internet are not complete, does not help, and it's difficult to trade, but the Italo Volume Indicator is different , the Italo Volume Indicator shows the wave volume, when market
65 USD
Market Structure MT5
Reza Aghajanpour
5 (2)
**   All Symbols   x   All Timeframes   scan just by pressing scanner button ** *** Contact me immediately after the purchase to send you instructions and add you in "Market Structure group" for sharing or seeing experiences with other users. CURRENT PRICE $39..... Future Price $200 Introduction: Market structure is important for both new and professional traders since it can influence the liquidity and price action of a market. It’s also one of the most commonly used techniques to understand tr
39 USD
Introduction to EFW Analytics EFW Analytics was designed to accomplish the statement "We trade because there are regularities in the financial market". EFW Analytics is a set of tools designed to maximize your trading performance by capturing the repeating fractal geometry, known as the fifth regularity in the financial market. The functionality of EFW Analytics consists of three parts. Firstly, Equilibrium Fractal Wave Index is an exploratory tool to support your trading logic to choose which r
200 USD
Zeichnen Sie automatisch Unterstützungs- und Widerstandsniveaus PLUS Antriebskerzenlücken auf Ihrem Chart ein, so dass Sie sehen können, wohin sich der Preis wahrscheinlich als Nächstes bewegen und/oder möglicherweise umkehren wird. Dieser Indikator wurde entwickelt, um als Teil der Positionshandelsmethodik verwendet zu werden, die auf meiner Website (The Market Structure Trader) gelehrt wird, und zeigt Schlüsselinformationen für die Zielsetzung und potenzielle Einstiege an. MT4 Version:  htt
49 USD
FX Volume MT5
Daniel Stein
4.77 (13)
Dem intelligenten Geld zu folgen ist endlich möglich! FX Volume ist der ERSTE und EINZIGE Volumenindikator, der einen ECHTEN Einblick in die Marktstimmung aus Sicht eines Brokers bietet. Es bietet fantastische Einblicke in die Positionierung institutioneller Marktteilnehmer, wie z.B. Broker, auf dem Forex-Markt, viel schneller als COT-Berichte. Diese Informationen direkt auf Ihrem Chart zu sehen, ist ein echter Game-Changer und eine bahnbrechende Lösung für Ihren Handel. Bitte lesen Sie un
33 USD
Support And Resistance Screener ist ein Level-Indikator für MetaTrader, der mehrere Tools innerhalb eines Indikators bietet. Die verfügbaren Werkzeuge sind: 1. Marktstruktur-Screener. 2. Bullische Pullback-Zone. 3. Bärische Pullback-Zone. 4. Tägliche Pivot-Punkte 5. wöchentliche Pivots-Punkte 6. monatliche Pivots-Punkte 7. Starke Unterstützung und Widerstand basierend auf harmonischem Muster und Volumen. 8. Zonen auf Bankebene. ZEITLICH BEGRENZTES ANGEBOT: HV Support and Resistance Indicator ist
50 USD
Forex Master Pattern
Alberto Gauer Borrego
4.8 (10)
The Forex Master Pattern  is an alternative form of technical analysis that provides a framework which will help you to find and follow the hidden price pattern that reveals the true intentions of financial markets. This algorithm here does a good job detecting the Phase 1 of the Forex Master Pattern cycle, which is the contraction point (or Value).  On Phase 2 we get higher timeframe activation (also called Expansion), which is where price oscillates above and below the average price defined
49 USD
Setups 9 Larry Williams
Luigi Nunes Labigalini
Buy and sell signals based on Larry Williams's exponential moving average strategies 9.1, 9.2, 9.3 and 9.4 for trend reversals and continuations. To understand the logic and how to trade the signals, please check: Setup 9.1:  https://www.mql5.com/pt/market/product/50986 Setup 9.2:  https://www.mql5.com/pt/market/product/52268 Setup 9.3:  https://www.mql5.com/pt/market/product/52269 Setup 9.4:  https://www.mql5.com/pt/market/product/52273 Notices:  - This indicator displays a lot of signals.
199 USD
Stargogs Spike Catcher
Lorenzo Edward Beukes
5 (6)
Stargogs Spike Catcher V3.11 This Indicator is Developed To milk the BOOM and CRASH indices . Send me Message if you need any help with the indicator.  CHECK OUT THE STARGOGS SPIKE CATCHER EA/ROBOT V3: CLICK HERE ALSO CHECK OUT SECOND TO NONEFX SPIKE CATCHER:   CLICK HERE STARGOGS SPIKE CATCHER V3.11 WHATS NEW! Brand New Strategy. This is the Indicator you need for 2023. The Indicator Gives you an Entry at a time when conditions are met and you should use TP & SL. New Trendline that changes col
100 USD
Introduction to Fractal Pattern Scanner Fractal Indicator refers to the technical indicator that makes use of the fractal geometry found in the financial market. Fractal Pattern Scanner is the advanced Fractal Indicator that brings the latest trading technology after the extensive research and development work in the fractal geometry in the financial market. The most important feature in Fractal Pattern Scanner is the ability to measure the turning point probability as well as the trend probabil
185 USD
Weitere Produkte dieses Autors
Der Kerzen-Timer-Countdown zeigt die verbleibende Zeit an, bevor der aktuelle Balken geschlossen wird und sich ein neuer Balken bildet. Es kann für das Zeitmanagement verwendet werden. MT4-Version hier ! Feature-Highlights Verfolgt die Serverzeit, nicht die lokale Zeit Konfigurierbare Textfarbe und Schriftgröße Optionale Visualisierung der täglichen Variation des Symbols Optimiert, um die CPU-Auslastung zu reduzieren Eingabeparameter Tagesvariation anzeigen: wahr/falsch Schriftgröße des
FREE
MACD Intraday Trend ist ein Indikator, der durch eine Adaption des ursprünglichen MACD von Gerald Appel in den 1960er Jahren entwickelt wurde. Im Laufe der Jahre des Handels wurde beobachtet, dass wir durch die Änderung der Parameter des MACD mit Fibonacci-Proportionen eine bessere Darstellung der Kontinuität der Trendbewegungen erreichen, wodurch es möglich ist, den Beginn und das Ende eines Preistrends effizienter zu erkennen. Aufgrund seiner Effizienz bei der Erkennung von Kurstrends ist
FREE
MACD Intraday Trend PRO ist ein Indikator, der durch eine Adaption des ursprünglichen MACD von Gerald Appel in den 1960er Jahren entwickelt wurde. Im Laufe der Jahre des Handels wurde beobachtet, dass wir durch die Änderung der Parameter des MACD mit Fibonacci-Proportionen eine bessere Darstellung der Kontinuität der Trendbewegungen erreichen, wodurch es möglich ist, den Beginn und das Ende eines Preistrends effizienter zu erkennen. Aufgrund seiner Effizienz bei der Erkennung von Kurstrends
77 USD
Der Kerzen-Timer-Countdown zeigt die verbleibende Zeit an, bevor der aktuelle Balken geschlossen wird und sich ein neuer Balken bildet. Es kann für das Zeitmanagement verwendet werden. MT5-Version hier ! Feature-Highlights Verfolgt die Serverzeit, nicht die lokale Zeit Konfigurierbare Textfarbe und Schriftgröße Optionale Visualisierung der täglichen Variation des Symbols Optimiert, um die CPU-Auslastung zu reduzieren Eingabeparameter Tagesvariation anzeigen: wahr/falsch Schriftgröße des
FREE
Pivot Point Fibo RSJ ist ein Indikator, der die Unterstützungs- und Widerstandslinien des Tages mithilfe von Fibonacci-Kursen verfolgt. Dieser spektakuläre Indikator erzeugt bis zu 7 Unterstützungs- und Widerstandsebenen durch Pivot Point unter Verwendung von Fibonacci-Kursen. Es ist fantastisch, wie die Preise jedes Niveau dieser Unterstützung und dieses Widerstands respektieren, wo es möglich ist, mögliche Einstiegs- / Ausstiegspunkte einer Operation zu erkennen. Merkmale Bis zu 7 Unter
FREE
MACD Intraday Trend PRO ist ein Indikator, der durch eine Adaption des ursprünglichen MACD von Gerald Appel in den 1960er Jahren entwickelt wurde. Im Laufe der Jahre des Handels wurde beobachtet, dass wir durch die Änderung der Parameter des MACD mit Fibonacci-Proportionen eine bessere Darstellung der Kontinuität der Trendbewegungen erreichen, wodurch es möglich ist, den Beginn und das Ende eines Preistrends effizienter zu erkennen. Aufgrund seiner Effizienz bei der Erkennung von Kurstrends
77 USD
Setup Tabajara wurde von einem brasilianischen Händler namens "The OGRO of Wall Street" erstellt. Die Idee dieses Setups besteht darin, dem Händler den aktuellen Trend der Preise und die Art der Operation anzuzeigen, nach der in der Grafik gesucht werden sollte. Betrieb Dies geschieht durch die Positionierung des Schließens der Kerzen und des VWAP bis 10:40 Uhr und danach durch das arithmetische Mittel von 20 Perioden, die die Kerzen in 4 möglichen Farben bemalen: Grün -> Preis steigt im Au
FREE
MACD Intraday Trend ist ein Indikator, der durch eine Adaption des ursprünglichen MACD von Gerald Appel in den 1960er Jahren entwickelt wurde. Im Laufe der Jahre des Handels wurde beobachtet, dass wir durch die Änderung der Parameter des MACD mit Fibonacci-Proportionen eine bessere Darstellung der Kontinuität der Trendbewegungen erreichen, wodurch es möglich ist, den Beginn und das Ende eines Preistrends effizienter zu erkennen. Aufgrund seiner Effizienz bei der Erkennung von Kurstrends ist
FREE
Trend WDO B3
JETINVEST
5 (2)
Trend WDO B3 ist ein professionelles Handelssystem, das für die MT5-Plattform entwickelt und für die Arbeit mit MINI DOLAR INDEX (WDO) auf B3 in BRASILIEN optimiert wurde. Das System verwendet Fuzzy Logic in mehreren Zeitrahmen (1M, 5M, 15M, 30M, H1, H4, D1), um den Preistrend zu identifizieren, wobei in jedem Zeitrahmen Gewichtungen gemäß den durchgeführten Berechnungen angewendet werden. Nachdem der Trend erkannt wurde, platziert das System eine STOP-Order (KAUF oder VERKAUF) entsprechend der
347 USD
Pivot Point Fibo RSJ ist ein Indikator, der die Unterstützungs- und Widerstandslinien des Tages mithilfe von Fibonacci-Kursen verfolgt. Dieser spektakuläre Indikator erzeugt bis zu 7 Unterstützungs- und Widerstandsebenen durch Pivot Point unter Verwendung von Fibonacci-Kursen. Es ist fantastisch, wie die Preise jedes Niveau dieser Unterstützung und dieses Widerstands respektieren, wo es möglich ist, mögliche Einstiegs- / Ausstiegspunkte einer Operation zu erkennen. Merkmale Bis zu 7 Unter
FREE
VWAP Fibo Bands RSJ is an indicator that traces the lines of the daily VWAP and from it creates bands using Fibonacci proportions. This spectacular indicator creates 10 band levels through the selected VWAP period using Fibonacci ratios. It is fantastic how the prices respect each level of the bands, where it is possible to realize that almost every time the price closes above / below a level of the bands he will seek the next one. If close above will seek to reach the level above and if close
FREE
Weis Waves RSJ
JETINVEST
4.57 (7)
The Weis Waves RSJ Indicator sums up volumes in each wave. This is how we receive a bar chart of cumulative volumes of alternating waves. Namely the cumulative volume makes the Weis wave charts unique. It allows comparing the relation of the wave sequence characteristics, such as correspondence of the applied force (expressed in the volume) and received result (the price progress). If you still have questions, please contact me by direct message:  https://www.mql5.com/en/users/robsjunqueira/
FREE
Tabajara Ogro
JETINVEST
4.82 (11)
Setup Tabajara was created by a Brazilian trader known as  "The OGRO of Wall Street" . The idea of this setup is to indicate to the trader the current trend of prices and  the type of operation should be looked for in the graph. Operation It does this through the relation of the closing price position and the     of 20 periods, by painting the candles in 4 possible colors : Green -> Price rising in upward trend (Search entry points for PURCHASE) Black -> Price correcting in Bullish Trend
FREE
This simple indicator paints with a darker color on the volume bar when the quantity traded is above the average of select number of periods of the volume itself, highlighting the moments when there was a large volume of deals above the average. It is also possible to use a configuration of four colors where the color tone shows a candle volume strength. The indicator defaults to the simple average of 20 periods, but it is possible to change to other types of averages and periods. If you like
FREE
Netting Panel RSJ
JETINVEST
4.5 (4)
Funcionamento: O Painel  Netting Panel RSJ  funciona com   qualquer ativo   e em   qualquer tempo gráfico . Ele funciona em contas do tipo " Netting " e " Hedge ", mas gerencia apenas uma posição por ativo, por isso o nome   Netting.   Se ele for executado em contas do tipo " Hedge ", ele fará o gerenciamento e proteção   apenas da posição mais antiga , ou seja, da primeira posição que foi aberta por ele. Em contas " Netting " quando os botões " SELL " ou " BUY " forem pressionados,   ocorrer
FREE
This simple indicator paints with a darker color on the volume bar when the quantity traded is above the average of select number of periods of the volume itself, highlighting the moments when there was a large volume of deals above the average. It is also possible to use a configuration of four colors where the color tone shows a candle volume strength. The indicator defaults to the simple average of 20 periods, but it is possible to change to other types of averages and periods. If you like
FREE
This indicator calculates the difference between the SELL aggression and the BUY aggression that occurred in each Candle, plotting the balance of each one graphically. Note: This indicator DOES NOT WORK for Brokers and/or Markets WITHOUT the type of aggression (BUY or SELL). Be sure to try our   Professional   version with configurable features and alerts:   Delta Agression Volume PRO Settings Aggression by volume (Real Volume) or by number of trades (Tick Volume) Start of the Aggression De
FREE
Sniper Major
JETINVEST
5 (1)
Der EA verwendet Volatilität, Spread, Häufigkeit und Timing, um zu entscheiden, wann er tradet. Der EA verwendet die Limit-Orders-Methode, um Positionen zu eröffnen. In diesem Fall wird die Slippage beim Ausführen der Eingaben allenfalls positiv sein. Der EA verwendet die Trailing Take Profit-Logik, da der Fokus des Systems darauf liegt, Geld zu verdienen und gleichzeitig Ihr Kapital zu schützen. Die meisten Trades werden schnell geschlossen, also wie ein Scharfschützen-Kopfschuss. Haupteigen
247 USD
Vwap RSJ
JETINVEST
4.92 (13)
VWAP RSJ is an indicator that plots the Hourly, Daily, Weekly and Monthly  VWAP Lines. Large institutional buyers and   mutual funds   use the VWAP ratio to help move into or out of stocks with as small of a market impact as possible. Therefore, when possible, institutions will try to buy below the VWAP, or sell above it. This way their actions push the price back toward the average, instead of away from it. Based on this information I developed this indicator that combines 4 types of VWAP T
FREE
This indicator sums up the difference between the sells aggression and the buys aggression that occurred in each Candle, graphically plotting the waves of accumulation of the aggression volumes.   Through these waves an exponential average is calculated that indicates the direction of the business flow. Note: This indicator DOES NOT WORK for Brokers and/or Markets WITHOUT the type of aggression (BUY or SELL).   Be sure to try our Professional version with configurable features and alerts:  Agr
FREE
RENKO PRICE ACTION ATR ist ein "Expert Advisor", der durch die Konstruktion des Renko-Charts entwickelt wurde, wobei jeder BRICK die Größe hat, die durch die ATR des vom Benutzer ausgewählten Zeitraums berechnet wird. Renko-Charts wurden entwickelt, um kleinere Preisbewegungen herauszufiltern und es Händlern so zu erleichtern, sich auf wichtige Trends zu konzentrieren. Aufgrund seiner Effizienz bei der Erkennung von Kurstrends ist es auch möglich, Unterstützungen und Widerstände sowie Top- und
47 USD
Der Indikator Angebotsnachfrage RSJ PRO berechnet und zeichnet die Zonen "Angebot" und "Nachfrage" auf dem Diagramm, identifiziert den Zonentyp (schwach, stark, verifiziert, nachgewiesen) und zeigt im Falle von erneuten Tests der Zone an, wie oft es ist wurde erneut getestet. "Angebots"-Zonen sind die Preiszonen, in denen mehr Angebot als Nachfrage aufgetreten ist, was die Preise nach unten treibt. "Nachfrage"-Zonen sind die Preiszonen, in denen mehr Nachfrage als Angebot aufgetreten ist, was d
47 USD
Aggression Wave PRO is an indicator developed to monitor the divergence, strength, and continuity of the aggression volume of sell and buy negotiations.  The  Agrression Wave PRO   has features that allow you to view beyond the accumulated delta volume of the day. Note: This indicator DOES NOT WORK for Brokers and/or Markets WITHOUT the type of aggression (BUY or SELL). Cryptocurrencies and Forex do not provide this type of information, that is, it does not work with it. Operation It is pos
77 USD
Delta Aggression Volume PRO is an indicator developed to monitor the strength and continuity of the aggression volume of sell and buy negotiations. Note: This indicator DOES NOT WORK for Brokers and/or Markets WITHOUT the type of aggression (BUY or SELL). Cryptocurrencies and Forex do not provide this type of data, that is, it does not work with them. O Delta Agrression Volume PRO has features that allow you to view beyond the delta volume of the day. Operation Multi symbols  (those who pro
77 USD
Der Indikator Angebotsnachfrage RSJ PRO berechnet und zeichnet die Zonen "Angebot" und "Nachfrage" auf dem Diagramm, identifiziert den Zonentyp (schwach, stark, verifiziert, nachgewiesen) und zeigt im Falle von erneuten Tests der Zone an, wie oft es ist wurde erneut getestet. "Angebots"-Zonen sind die Preiszonen, in denen mehr Angebot als Nachfrage aufgetreten ist, was die Preise nach unten treibt. "Nachfrage"-Zonen sind die Preiszonen, in denen mehr Nachfrage als Angebot aufgetreten ist, was di
77 USD
Trend WIN B3
JETINVEST
5 (4)
Trend WIN B3 ist ein professionelles Handelssystem, das für die MT5-Plattform entwickelt und für die Arbeit mit MINI FUTURE INDEX (WIN) auf B3 in BRASILIEN optimiert wurde. Das System verwendet Fuzzy Logic in mehreren Zeitrahmen (1M, 5M, 15M, 30M, H1, H4, D1), um den Preistrend zu identifizieren, wobei in jedem Zeitrahmen Gewichtungen gemäß den durchgeführten Berechnungen angewendet werden. Nachdem der Trend erkannt wurde, platziert das System eine STOP-Order (KAUF oder VERKAUF) entsprechend de
347 USD
Der EA verwendet Volatilität, Spread, Häufigkeit und Timing, um zu entscheiden, wann er tradet. Der EA verwendet die Limit-Orders-Methode, um Positionen zu eröffnen. In diesem Fall wird die Slippage beim Ausführen der Eingaben allenfalls positiv sein. Der EA verwendet die Trailing Take Profit-Logik, da der Fokus des Systems darauf liegt, Geld zu verdienen und gleichzeitig Ihr Kapital zu schützen. Die meisten Trades werden schnell geschlossen, also wie ein Scharfschützen-Kopfschuss. Haupteigen
137 USD
Auswahl:
gfedrigo
94
gfedrigo 2021.10.15 13:19 
 

great tool

JETINVEST
192824
Antwort vom Entwickler Roberto Sant Ana Junqueira 2023.02.07 23:33
tks
Diogo Gomes
169
Diogo Gomes 2021.09.26 14:14 
 

obrigado

JETINVEST
192824
Antwort vom Entwickler Roberto Sant Ana Junqueira 2021.09.26 16:27
Obrigado pelo review
Fabio_Novaes
175
Fabio_Novaes 2021.06.30 21:41 
 

como estava sentindo falta desse contador, obrigado!

JETINVEST
192824
Antwort vom Entwickler Roberto Sant Ana Junqueira 2021.06.30 23:09
tks
Robson Souza
122
Robson Souza 2021.06.30 14:56 
 

Der Benutzer hat keinen Kommentar hinterlassen

JETINVEST
192824
Antwort vom Entwickler Roberto Sant Ana Junqueira 2021.06.30 15:08
Hi Robson, tks for your review.
Marilise Ravaglio Da Cunha Junqueira
386
 

Der Benutzer hat keinen Kommentar hinterlassen

JETINVEST
192824
Antwort vom Entwickler Roberto Sant Ana Junqueira 2021.06.30 15:09
Obrigado pelo review Marilise.
Antwort auf eine Rezension
Version 2.0 2021.09.21
Add some input parameters:
- Plot Numbers Config
- Distance from Candle
- Font Size