Candle Timer Countdown
- Indikatoren
- JETINVEST
- Version: 4.0
- Aktualisiert: 25 Januar 2022
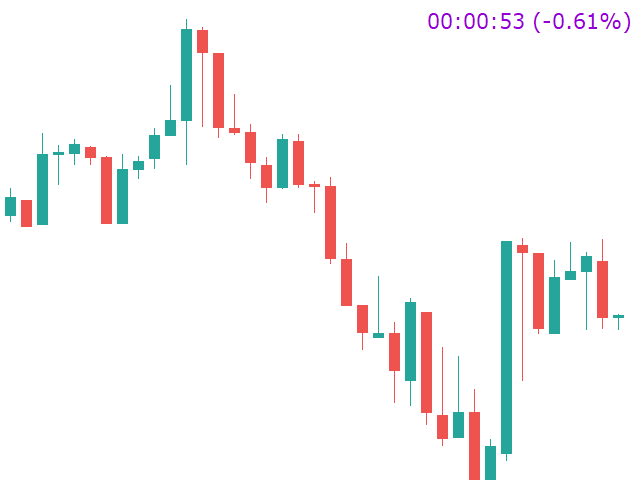
Der Kerzen-Timer-Countdown zeigt die verbleibende Zeit an, bevor der aktuelle Balken geschlossen wird und sich ein neuer Balken bildet. Es kann für das Zeitmanagement verwendet werden.
Feature-Highlights
- Verfolgt die Serverzeit, nicht die lokale Zeit
- Konfigurierbare Textfarbe und Schriftgröße
- Optionale Visualisierung der täglichen Variation des Symbols
- Optimiert, um die CPU-Auslastung zu reduzieren
Eingabeparameter
- Tagesvariation anzeigen: wahr/falsch
- Schriftgröße des Textes
- Textfarbe
Wenn Sie noch Fragen haben, kontaktieren Sie mich bitte per Direktnachricht: https://www.mql5.com/de/users/robsjunqueira/


Simply superb and very useful tool.