Winshots ADX Trend Scanner
- Indikatoren
- Pawel Michalowski
- Version: 1.5
- Aktualisiert: 18 März 2024
- Aktivierungen: 5
Der Handel in Richtung eines starken Trends reduziert das Risiko und erhöht das Gewinnpotenzial. Im Allgemeinen wird der durchschnittliche Richtungsindex (ADX) verwendet, um zu bestimmen, wann der Preis stark im Trend liegt. In vielen Fällen ist es der ultimative Trendindikator! Der Trend mag zwar Ihr Freund sein, aber es hilft sicher zu wissen, wer Ihre Freunde sind.
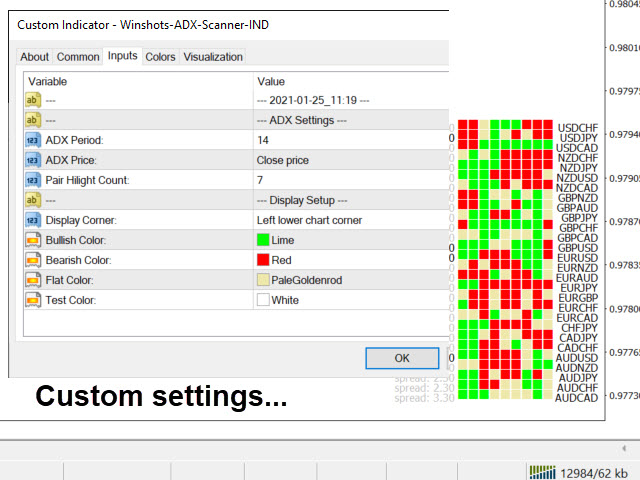
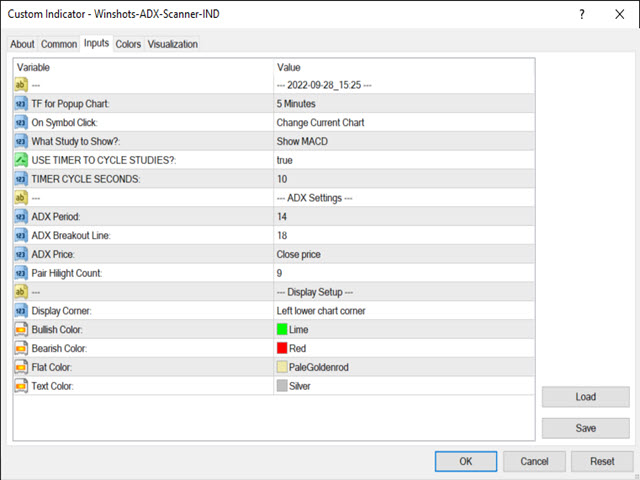
ADX wird verwendet, um die Trendstärke zu quantifizieren. ADX-Berechnungen basieren auf einem gleitenden Durchschnitt der Erweiterung der Preisspanne über einen bestimmten Zeitraum. Die Standardeinstellung ist 14 Balken, obwohl andere Zeiträume verwendet werden können. ADX kann für jedes Handelsinstrument wie Forex-Paare, Aktien, Investmentfonds, börsengehandelte Fonds, Futures und Krypto verwendet werden.
ADX wird als einzelne Linie mit Werten zwischen einem Tief von Null und einem Hoch von 100 dargestellt. ADX ist nicht gerichtet; Es registriert die Trendstärke, unabhängig davon, ob der Preis im Auf- oder Abwärtstrend liegt. Der Standard-ADX-Indikator wird normalerweise im selben Fenster wie die beiden DMI-Linien (Directional Movement Indicator) dargestellt, von denen ADX abgeleitet ist.
Wenn Sie jedoch den Standard-ADX-Indikator verwenden, kann es zu Verwirrung bei allen Linien kommen, die sich im Zickzack bewegen und kreuzen. Nicht nur das, wenn Sie zwischen verschiedenen Instrumenten und verschiedenen Zeitrahmen wechseln, können sich die ADX-Linien in die entgegengesetzten Richtungen kreuzen, was Sie noch mehr verwirrt!
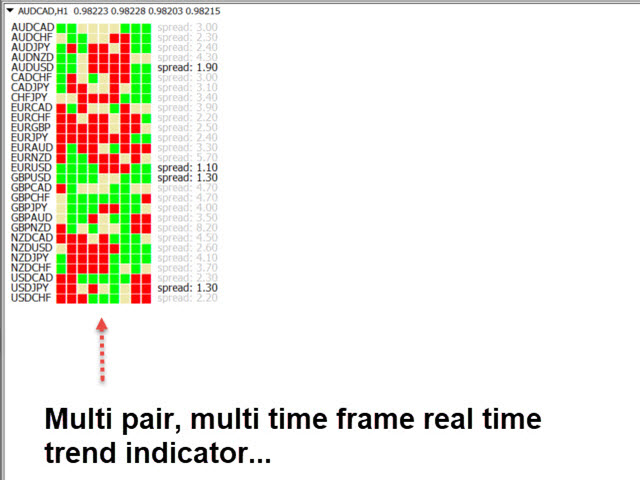
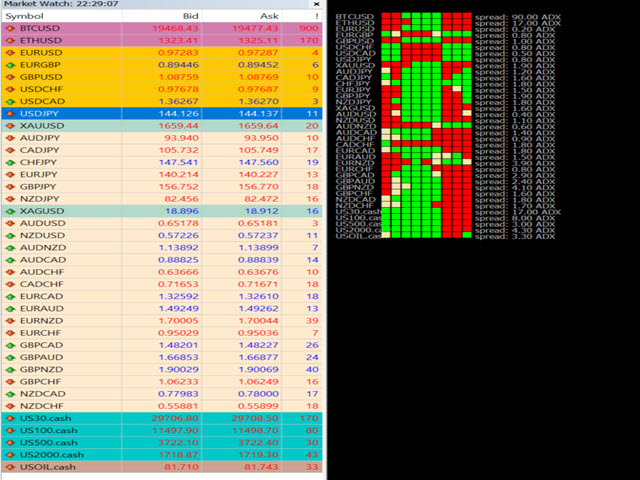
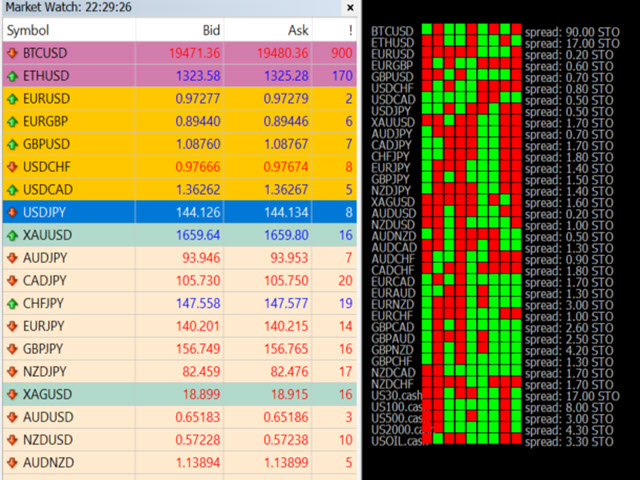
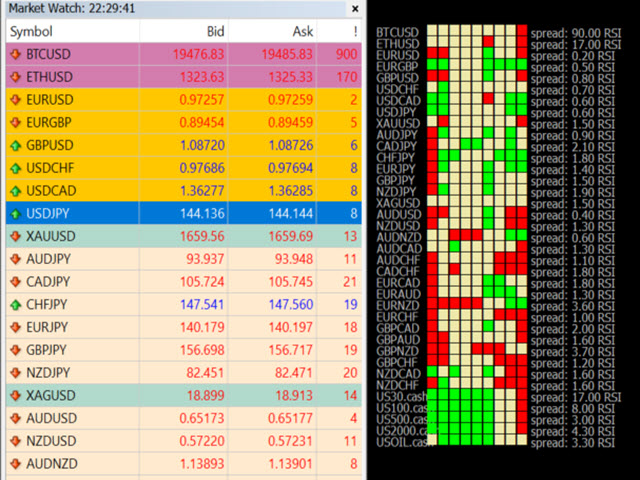
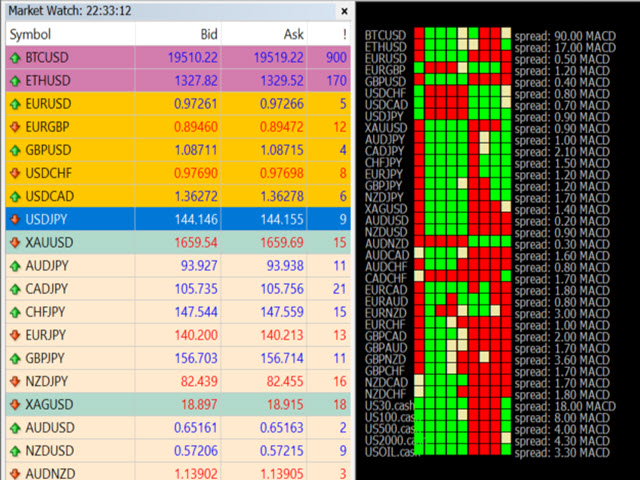
Die Winshots ADX Trend Scanner-Anzeige behebt dieses Problem. In einer einfachen Ansicht können Sie schnell den Status des ADX-Trends in allen Zeitrahmen und auf vielen verschiedenen FX-Währungspaaren bestimmen !!! Ja, das hast du richtig gelesen. Kein Klicken mehr durch verschiedene Zeitrahmen verschiedener Forex-Paare, die ADX-Linien wie heiße Spaghetti kreuzen. Der Winshots ADX-Trendscanner zeigt Ihnen nicht nur genau, was der Trend für jedes FX-Paar und jeden Zeitrahmen ist, sondern hebt auch das FX-Paar hervor, das in ALLEN Zeitrahmen stark im Trend liegt. Mit dieser zusätzlichen Funktion können Sie schnell feststellen, ob der Markt eine starke Dynamik aufweist und ob es sich lohnt, während der von Ihnen gewählten Zeit zu handeln.

Purchased both adx trend indicators five stars