Winshots ADX Trend Scanner
- インディケータ
- Pawel Michalowski
- バージョン: 1.5
- アップデート済み: 18 3月 2024
- アクティベーション: 5
強いトレンドの方向に取引することは、リスクを減らし、潜在的な利益を増やします。一般に、平均方向性指数(ADX)は、価格が強くトレンドになっている時期を判断するために使用されます。多くの場合、それは究極のトレンド指標です!結局のところ、トレンドはあなたの友達かもしれませんが、それはあなたの友達が誰であるかを知るのに確かに役立ちます。
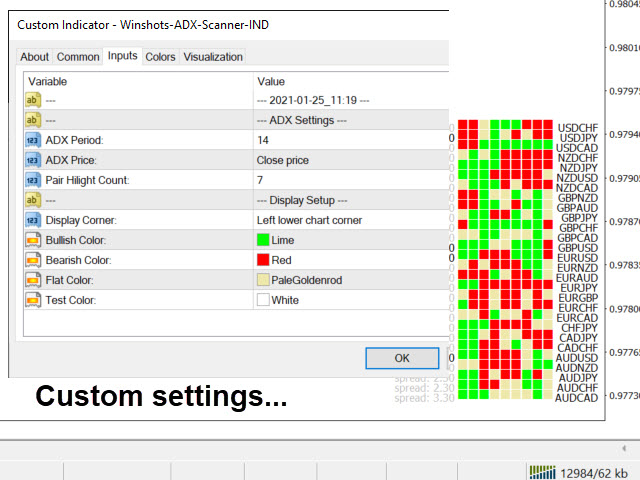
ADXは、トレンドの強さを定量化するために使用されます。 ADXの計算は、特定の期間における価格範囲の拡大の移動平均に基づいています。デフォルト設定は14バーですが、他の期間を使用することもできます。 ADXは、外国為替ペア、株式、投資信託、上場投資信託、先物、暗号通貨など、あらゆる取引手段で使用できます。
ADXは、ゼロの最低値から100の最高値までの範囲の値を持つ単一の線としてプロットされます。ADXは無指向性です。価格が上昇傾向にあるか下降傾向にあるかにかかわらず、トレンドの強さを記録します。標準のADXインジケーターは通常、ADXの派生元である2つの方向移動インジケーター(DMI)ラインと同じウィンドウにプロットされます。
ただし、標準のADXインジケーターを使用すると、すべての線がジグザグに交差していると少し混乱する可能性があります。それだけでなく、異なる楽器と異なる時間枠を切り替えると、ADXラインが反対方向に交差する可能性があり、さらに混乱する可能性があります。
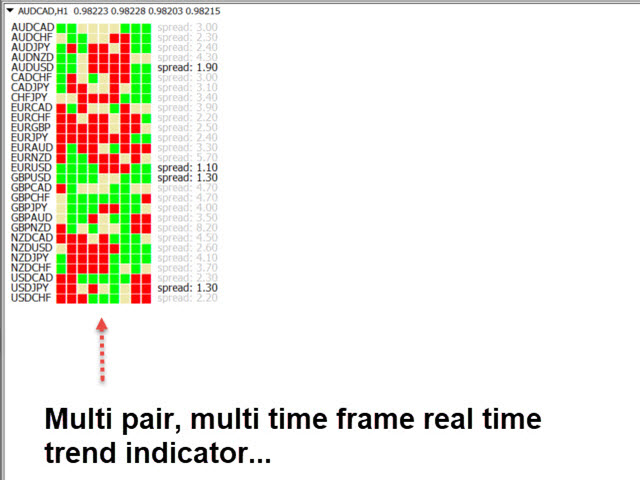
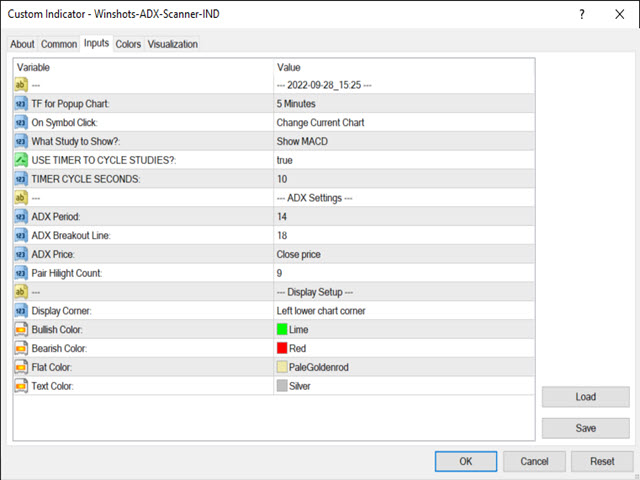
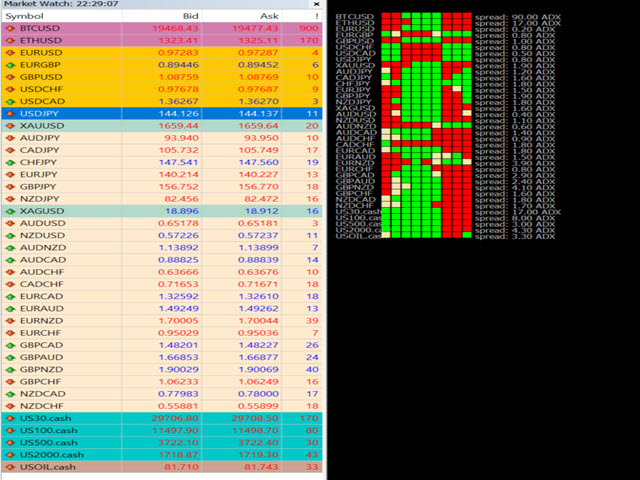
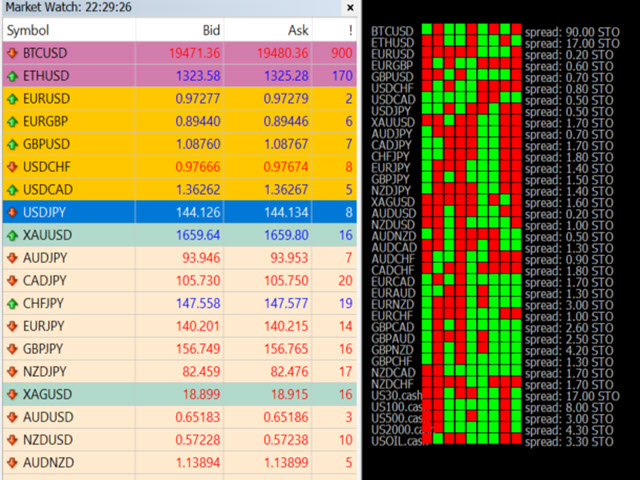
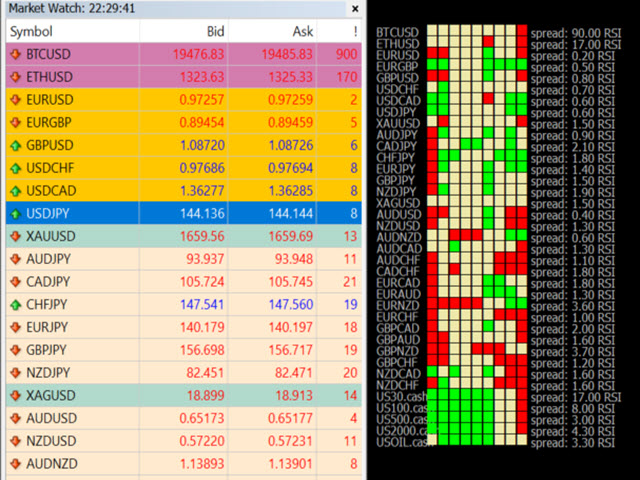
WinshotsADXトレンドスキャナーインジケーターがこの問題を処理します。 1つの簡単なビューで、多くの異なるFX通貨ペアで、すべての時間枠でのADXトレンドの状態をすばやく判断できます!!!はい、あなたはそれを正しく読んだ。ホットスパゲッティのようにあらゆる方法で交差するADXラインを見ているさまざまな外国為替ペアのさまざまな時間枠をクリックする必要はもうありません。 Winshots ADXトレンドスキャナーインジケーターは、すべてのFXペアとすべての時間枠でトレンドが正確に表示されることに加えて、すべての時間枠で強くトレンドになっているFXペアも強調表示します。この追加機能により、市場に強い勢いがあるかどうか、選択した時間内に取引する価値があるかどうかをすばやく判断できます。

Purchased both adx trend indicators five stars