• Übersicht
  • Bewertungen
  • Diskussion
  • Neue Funktionen

TDI Signals

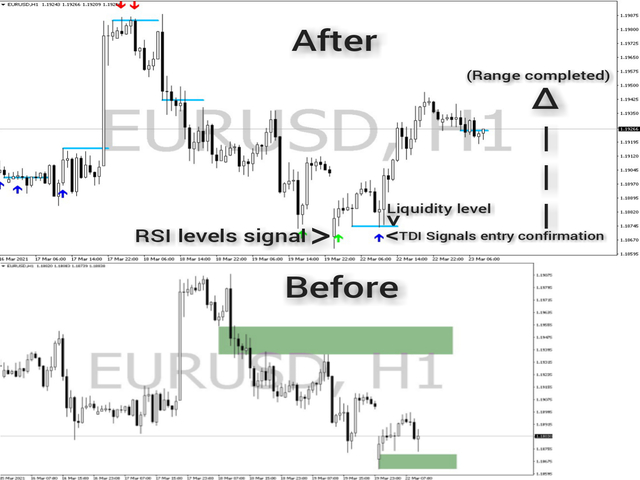
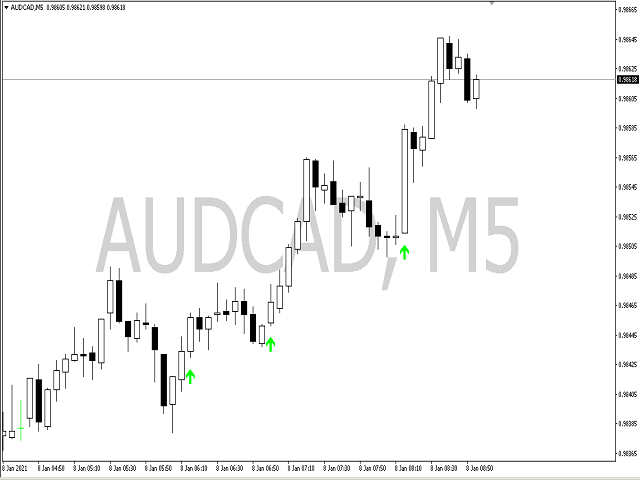
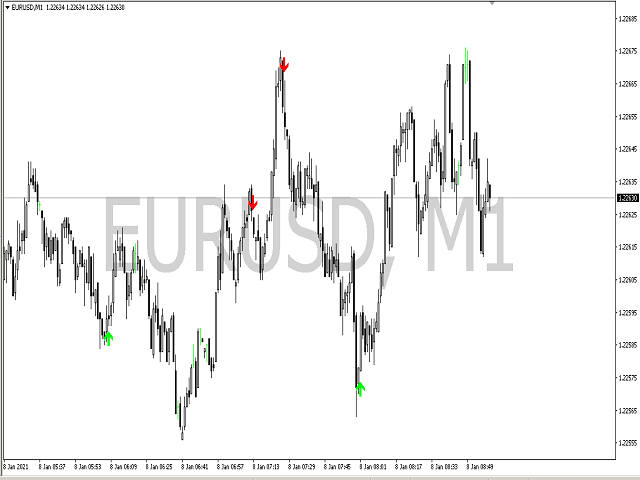
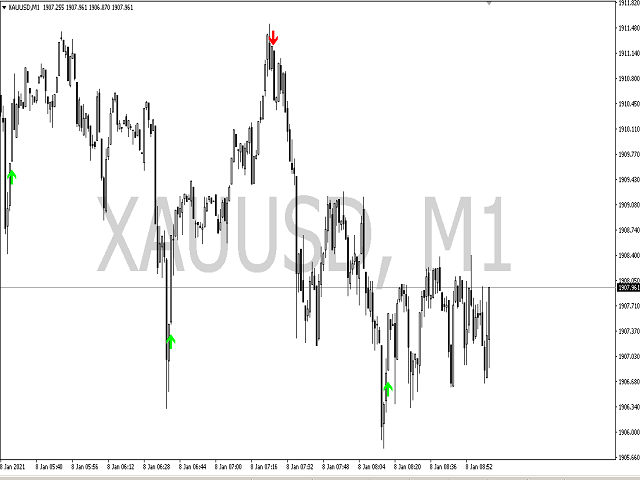
TDI Signals generates buy and sell arrows based on a TDI(Traders Dynamic Index) algorithm. It looks for price breakouts, continuations and reversals. By default it runs in the trend mode but user is provided with the option to change that to reversal mode. Trader can use the mode which compliments his/her trading style. 


Usage:- 

TDI Signals can be used as a stand alone indicator with context or even be added to strategies to make confirmations more strong. Volatility based stop loss, take profit & position sizing can be very helpful while using this algorithm.

An example of using the indicator in technical analysis is shown in the screenshot below.

Empfohlene Produkte
Niubility Trend  Niubility Trend displays the trend direction for all time frames in real time. You'll see at a glance at which direction the trends are running, how long they last and how powerful they are. All this makes it an easy-to-use trend trading system for beginners, advanced and professional traders. Features Easy to trade Customizable colors and sizes It is non-repainting and non-backpainting It is fantastic as a trailing stop method It implements alerts of all kinds
30 USD
Wir stellen Ihnen den Donchian Channels Indikator für MQL4 vor, ein leistungsstarkes technisches Analysewerkzeug, das darauf abzielt, Ihren Handelserfolg zu steigern. Dieser Indikator besteht aus vier Linien, die die oberen und unteren Grenzen der Preisbewegung über einen bestimmten Zeitraum darstellen. Mit dem Donchian Channels Indikator können Sie potenzielle Ausbrüche und Umkehrungen auf dem Markt leicht identifizieren. Die obere Linie zeigt das höchste Hoch des festgelegten Zeitraums an, wäh
30 USD
This is a simple arrow system based on Engulfing Candlestick Pattern. It gives you alerts on your smartphone when there is an engulfing candlestick pattern happens. Which type of alerts available? 1. It paints on chart Up/Down Arrows. 2. Popup message and sound alert in trading terminal window. 3. Push notification or Alert on your Android and IOS mobile phones (requires MT4 or MT5 app installed!) *Note: Use it on higher timeframes like H4 (4 hours), D1 (1 Day) then find trade opportunities on s
30 USD
Forex Indicator SCALPING SNIPER for MT4 , No Repaint Trading System Scalping Sniper - is advanced system (indicator) showing accurate price momentum! Upgrade your trading methods with the professional   Scalping Sniper   Indicator for MT4. This system provide very accurate but rare sniping signals, with win rate up to 90% System suppose to use many pairs to search for signals to compensate low number of signals per one pair. Scalping Sniper  consist of:  Top & Bottom Volatility lines (Blue colo
39.99 USD
Dieser einzigartige Indikator für das automatische Zeichnen von Trendlinien funktioniert in allen Zeitrahmen und kann Ihnen dabei helfen, kurzfristige Trendumkehrungen sowie kurzfristige Trendausbrüche, die auf das stärkere Kapital auf dem Markt hinweisen, problemlos zu handeln. Es ermöglicht Ihnen auf einzigartige Weise, für schwere Schaukeln FRÜH einzusteigen. Eingaben umfassen: - Max Candles blicken zurück auf Trendlinien - Linientyp und Farbe - Maximaler Abstand zum Außenband und Bandpe
1 000 USD
EMA Dashboard
Chantal Sala
1 (1)
Ema Dashboard is an innovative dashboard that allows you to monitor Moving Average on multiples symbols and different timeframes. This dashboard allows you to analyze information on 28 pairs on an unique chart. Its functionality includes analysis of All Time Frames. This configuration allows you to identify the Long Term Trend with extreme ease. This panel allows you to take very important directional movements. A click on button opens a new chart (symbol and timeframe). Graphic Object Symbol
100 USD
Please contact me at telegram  https://t.me/smartforex7 After purchasing SmartForex Indicator then Use This Indicator...................... SMART EXIT PROFIT LINE Indicator is very Helpful with SmartForex Indicator ........................................ SMART EXIT PROFIT LINE Indicator Attach with SmartForex Indicator after then Red Line Show Exit buy Profit , Green Line show Exit Sell Profit................
FREE
Specify the range (in pips) of control and easily visualize the moment when it is exceeded. Visit my other bots and indicators This indicator helps to visualize the distance between the moving average of your preference and the price of the asset. You can specify the period of the moving average, as well as the mode of media. Indicator parameters Period: Period of the moving average. Mode: Type of moving average. Simple moving average (SMA). Exponential moving average (EMA) Linear weighted mov
FREE
Dieser Indikator verwendet mehrere Indikatoren, um hochgewinnende Signaltrades zu generieren Der R-Signals-Indikator ist ein komplettes FX-Handelssystem, das genaue Kauf- und Verkaufspfeile auf dem Chart druckt. Der Indikator erscheint im Hauptfenster des MT4-Charts als farbige grüne und rote Pfeile. Die Verwendung von Signalen, die von einem einzelnen Indikator generiert werden, kann beim Handel riskant sein. Dies liegt daran, dass die Verwendung von nur einem Indikator für den Handel mehr
40 USD
Calculated
Vitalii Zakharuk
Calculated trend indicator, can be used with an optimal risk to profit ratio, shows successful signals. Uses two options for settings. Shows favorable moments for entering the market with arrows. The probability of a successful trend is not very bad! The indicator can be used both for pipsing on small periods, and for long-term trading. The indicator does not redraw and does not lag. It works on all currency pairs and on all timeframes.
57 USD
The Average True Range (ATR) is a tool to measure volatility. ATR MTF (Multi Time Frame) indicator provides all timeframe trends helps to identify in which kind of volatility environment the market .This indicator can be used with any Trading Systems for additional confirmation of trading entries or exits. It is a very helpful tool to calculate Targets and Stops according the current market conditions.
35 USD
Inside Bars Breakouts Multi time frame with Targets Inside bars Trading is always good concept for day trader but lots of problem with entry and exit trades ..here is my indicator which will give you entry and exits with 4 targets. If you are using big time frame like H4/Daily/Weekly always exit on first target or trailing activate for longer targets on 15min/30min by using H1 inside bar there is works like breakouts book partial profit booking on first target then entry point stop loss wait for
FREE
Smart Channel is a non-redrawing channel indicator based on moving averages. The indicator is used to identify trends in financial markets and indicates the direction of price movement. Smart Channel, in fact, is a miniature trading strategy, since, regardless of the construction methods, it uses the tactics of rebounding from the boundaries of the built channel, and the boundaries themselves are used as guidelines for the correct placement of stop loss and take profit orders. The key diffe
88 USD
The Icarus Reversals(TM) Indicator is a powerful tool to identify high-probability reversal points, across all instruments.  The Reversals Indicator provides traders and investors with a simple-to-use and highly dynamic insight into points of likely price-action reversals.  Generated by a unique proprietary code-set, the Reversals Indicator generates long and short trade signals, which can be customised for all inputs, allowing for the complete optimisation fitted to any trader or investor style
89 USD
Fibonacci CSM
Emir Revolledo
5 (1)
Fibonacci Currency Strength Meter (FCSM) Early Access Sale!! This new product is still in the process of adding new features and settings. For early bird buyers. The Price will be 50% Sale. In a few weeks, the product will be done. Go Grab your copy while it's still cheap. More details will be added soon. Things to be added. Alert Levels Mobile and Email Alert From it's name, Fibonacci Currency Strength Meter is a combination of Fibonacci levels and Currency Strength Meter. The plot of Fib
60 USD
Fundamental Signals Indicator is a Non-Repaint Indicator with a powerful calculation engine that can predict market movement over 3000 pips (30000 points). The indicator does not analyze the market fundamentally, it is named fundamental because it can predict trends with large movements, no complicated inputs and low risk. Also Indicator can alert on market trend changes. Using Indicator : The Indicator is very simple and without complicated input parameters. (No need to optimize anythin
90 USD
Market Momentum Alerter for MT4
Renaud Herve Francois Candel
Market Momentum Alerter Market Momentum Alerter will inform you about danger to operate in the market. Imagine you see a very nice setup (Forex, Stocks, Indices) and you decide to place your trade... And you finally lose your trade and don't understand what happened. This can happen due to big operations in the market carried out by banks and big institutions. These operations are invisible for most people. Now with the Market Momentum Alerter you will be able to detect those operation
97 USD
CSM 8 in 1
ADELYN CASTILLO
4 (4)
8 in 1 Währungsmesser Dieser Indikator ist ein einzigartiger Indikator auf dem Markt mit verschiedenen Funktionen, um die Markttrends aller 28 Paare in verschiedenen Zeiträumen darzustellen. 8in1 CSM ist für alle Zeitrahmen verfügbar, um zu sehen, welche Währung für Ihre Strategie am besten geeignet ist. Es hat die Fähigkeit, Trend- und Ranging-Paare zu verfolgen, was gut für Scalping, Day-Trading oder Swing-Trading-Strategien funktioniert. Alles, was Sie tun müssen, ist diesen Indikator in
39 USD
KT Absolute Strength MT4
KEENBASE SOFTWARE SOLUTIONS
KT Absolute Strength measures and plots the absolute strength of the instrument's price action in a histogram form. It combines the moving average and histogram for a meaningful illustration. It supports two modes for the histogram calculation, i.e., it can be calculated using RSI and Stochastic both. However, for more dynamic analysis, RSI mode is always preferred. Buy Entry When the Absolute Strength histogram turns green and also it's higher than the previous red column. Sell Entry W
30 USD
KT Candlestick Patterns Scanner is a Multi-Symbol and Multi-Timeframe scanner that fetches and shows various candlestick patterns on 28 currency pairs and 9 time-frames concurrently . The scanner finds the candlestick patterns by loading the KT Candlestick Patterns indicator as a resource in the background. Features The scanner can find the candlestick patterns on 252* combinations of symbols and time-frames from a single chart. Open the signal's chart loaded with a predefined template with
75 USD
Quality signal indicator for trend and reversal trading contains: 1- early signals 2- trends 3- trend strength recommended time frames: H4 & h1 ============== you can have it as the only indicator or u use it as addition to your favorite trading tools ================== pink and blue: trend strength ........... pink and green lines: TRENDS .............. RED & BLUE Signals trend
600 USD
MACD Scanner With Alerts
Niravkumar Maganbhai Patel
4 (1)
MACD Dashboard Panel   This indicator helps you to scan symbols which are in the Market Watch window and filter out a trend according to MACD. Moving Average Convergence Divergence (MACD) is a trend-following momentum indicator that shows the relationship between two moving averages of a security’s price. The MACD is calculated by subtracting the 26-period Exponential Moving Average (EMA) from the 12-period EMA. The result of that calculation is the MACD line. A nine-day EMA of the MACD call
FREE
Der Indikator ist wie eine Schwiegermutter, die oft redet, viel und oft unangemessen. Der Indikator gibt uns nicht nur ein Einstiegssignal für Parameter, die ich dann auflisten werde, sondern überwacht auch den Trend des stündlichen Zeitrahmens, OSMA, um die Einstiegsrichtung zu verstehen, RSI, um überkaufte oder überverkaufte Bedingungen zu erkennen, von denen wir absehen sollten, ATR für Volatilität und ADX für den Trend. Indikator nicht für Neulinge empfohlen. Erst die menschliche Beurtei
80 USD
Currency StrengtT
Hafis Mohamed Yacine
What Is Currency StrengtT Indicator? A currency strengthT indicator is a graphical tool that shows the strength of a currency. Common indicators usually show the strength of a currency in relation to another currency, however, with some calculations it is possible to find the absolute strength of each individual currency. Therefore, a currency strength matrix indicator (or meter) is a tool that tries to express the absolute strength of a currency, so that you can compare this strength with
30 USD
Dark Breakout
Venus Labs S.R.L.
4.78 (9)
Dark Breakout   is an Indicator for intraday trading. This Indicator is based on Trend Following  strategy, providing an entry signal on the breakout. The signal is provided by the arrow, which confirms the breaking of the level. We can enter in good price with this Indicator, in order to follow the main trend on the current instrument. It is advised to use low spread ECN brokers. This Indicator does Not repaint and N ot lag . Recommended timeframes are M5, M15 and H1. Recommended working pairs
50 USD
The Pairs Cross indicator is a unique tool for negatively correlated trading instruments, such as EURUSD and USDCHF currency pairs. It is based on a concept called pairs trading (or spread trading). Our indicator compares the strength of two currency pairs that are inversely correlated and quickly tells you when it’s time to buy the first pair and short a second pair, and vice versa. This is a straightforward approach to trading currency pairs that works very well. How to you use the Pairs Cr
99 USD
Arrows appear after Reversal-Pattern and when the confirmation-candle reaches its value, it won't disappear (no repaint). but with fix settings no additional settings necessary Entry : immediately after arrow Stop loss : a few pips above the high of the arrow - candle / below the low of the arrow - candle Take Profit : at least the next candle / move to break even after candle closed / trail the SL works on : Major Forex-pairs / M15 and higher time-frames The Value of the  confirmation-candle =>
69 USD
Description The Quantum Awesome Oscillator indicator is based on the standard Bill Williams Awesome Oscillator (AO) indicator. It has two parts. The lower part is a colored histogram of the oscillator (divided into two sides - above zero and below zero and, accordingly, colored in two colors - blue for buying and red for selling) and a trend curve line (shows the direction of the global trend). The upper part - arrows showing market entry points, as well as dashed lines showing Stop-Loss and T
70 USD
Currency Strength Gauge incicator The currency strength gauge is an indicator to measure of the strength or weakness of currencies in the Forex market. Comparing the strength of currencies in a graphic representation will lead to a good overview of the market and its future trends. You will see in a graphic chart both the strength of the currencies and their correlation, and this will help you in your decisions to get better trades.   -To easy detection of over Overbought and Oversold point
30 USD
Special Agent
Vitalii Zakharuk
The advantage of working on the Special Agent signal indicator is that the trader does not need to independently conduct a technical analysis of the chart. Determining the market trend is an important task for traders, and the tool gives ready-made signals in the form of directional arrows. This tool is an arrow (signal). Special Agent is a trend indicator, a technical analysis tool that helps to determine the exact direction of the trend: either up or down price movement for a trading pair o
77 USD
Käufer dieses Produkts erwarben auch
RelicusRoad Pro
Relicus LLC
4.91 (118)
JETZT 147 $ (602 $ RABATT) - UNBEGRENZTE KONTEN - PREISERHÖHUNGEN BEIM NÄCHSTEN UPDATE - VERGESSEN SIE NICHT, EINE 5-STERNE-BEWERTUNG ZU VERLASSEN RelicusRoad Benutzerhandbuch + Schulungsvideos + Zugang zur privaten Discord-Gruppe + VIP-Status EINE NEUE ART, DEN MARKT ZU BETRACHTEN RelicusRoad ist der weltweit leistungsstärkste Handelsindikator für Forex, Futures, Kryptowährungen, Aktien und Indizes und gibt Händlern alle Informationen und Tools, die sie benötigen, um profitabel zu bleib
147 USD
Gold Stuff
Vasiliy Strukov
4.89 (205)
Gold Stuff-Ein Trendindikator, der speziell für Gold entwickelt wurde, kann auch auf allen Finanzinstrumenten verwendet werden. Der Indikator wird nicht neu gezeichnet und verzögert sich nicht. Empfohlener Zeitrahmen H1. Nach diesem Indikator geschrieben EA Gold Stuff Berater, können Sie es in meinem Profil finden. WICHTIG! Kontaktieren Sie mich sofort nach dem Kauf, um Anweisungen und Bonus zu erhalten! DATEN Draw Arrow - inkl.aus. zeichnen von Pfeilen in einem Diagramm. Alerts-inkl.aus.
149 USD
DERZEIT 26% RABATT Die beste Lösung für jeden Newbie oder Expert Trader! Dieser Indikator ist ein einzigartiges, qualitativ hochwertiges und erschwingliches Trading-Tool, da wir eine Reihe von proprietären Funktionen und eine neue Formel integriert haben. Mit nur EINEM Chart können Sie die Währungsstärke für 28 Forex-Paare ablesen! Stellen Sie sich vor, wie sich Ihr Handel verbessern wird, weil Sie in der Lage sind, den genauen Auslösungspunkt eines neuen Trends oder einer Scalping-Gelegenh
148 USD
Owl smart levels
Sergey Ermolov
4.74 (38)
MT5-Version  |  Wie installiert man?   |   FAQ Der   Owl Smart Levels Indikator   ist ein komplettes Handelssystem innerhalb eines Indikators, der so beliebte Marktanalysetools wie die   fortschrittlichen Fraktale von Bill Williams , Valable ZigZag, das die   richtige Wellenstruktur   des Marktes aufbaut, und   Fibonacci-Levels , die die genauen Einstiegslevels markieren, enthält in den Markt und Orte, um Gewinne mitzunehmen. Detaillierte Strategiebeschreibung Anleitung zur Verwendung des Indik
97 USD
Advanced Supply Demand
Bernhard Schweigert
4.93 (302)
Derzeit 33% Rabatt! Die beste Lösung für jeden Anfänger oder erfahrenen Händler! Dieser Indikator ist ein einzigartiges, qualitativ hochwertiges und erschwingliches Trading-Tool, da wir eine Reihe von proprietären Funktionen und eine neue Formel integriert haben. Mit diesem Update werden Sie in der Lage sein, doppelte Zeitrahmenzonen anzuzeigen. Sie können nicht nur einen höheren TF (Zeitrahmen) anzeigen, sondern sowohl den Chart-TF als auch den höheren TF: SHOWING NESTED ZONES. Alle Supply Dema
148 USD
Wir stellen vor       Quantum Breakout PRO   , der bahnbrechende MQL5-Indikator, der die Art und Weise, wie Sie mit Breakout-Zonen handeln, verändert!   Quantum Breakout PRO   wurde von einem Team erfahrener Händler mit über 13 Jahren Handelserfahrung entwickelt und soll Ihre Handelsreise mit seiner innovativen und dynamischen Breakout-Zonen-Strategie auf ein neues Niveau bringen. Der Quantum Breakout Indicator zeigt Ihnen Signalpfeile auf Breakout-Zonen mit 5 Gewinnzielzonen und Stop-Loss
99.99 USD
Propsense
Fahim Miah
5 (2)
Welcome to Propsense, the best solution for new and veteran traders with a simple FREE strategy! This indicator is a unique and affordable trading tool built on the teachings of a former bank trader. With this tool, you will be able to see inefficient points with ease. As well as this, traders will have an interactive display panel which will show your running and closed P/L in pips AND currency units. It also allows you to set your desired daily target/loss limit!  IMPORTANT INFORMATION Maxim
50 USD
Shepherd Harmonic Pattern
Abdullah Alrai
4.45 (33)
Dieser Indikator erkennt harmonische Muster, die manuell oder automatisch auf dem Chart gezeichnet wurden. Sie können das Benutzerhandbuch unter diesem Link einsehen: Fügen Sie Ihre Bewertung hinzu und kontaktieren Sie uns, um es zu erhalten. Es gibt eine kostenlose Version, um dieses Produkt auf MT4 auszuprobieren. Sie können es verwenden, um Gartley- und Nenstar-Muster zu erkennen: https://www.mql5.com/en/market/product/30181 Sie können die vollständige MT4-Version von kaufen: https://www.mql5
1 250 USD
FX Volume
Daniel Stein
4.59 (34)
Erhalten Sie Ihr tägliches Marktupdate mit Details und Screenshots über unser Morning Briefing hier auf mql5 und auf Telegram ! FX Volume ist der ERSTE und EINZIGE Volumenindikator, der einen ECHTEN Einblick in die Marktstimmung aus Sicht eines Brokers bietet. Es bietet fantastische Einblicke in die Positionierung von institutionellen Marktteilnehmern, wie z.B. Brokern, auf dem Forex-Markt, viel schneller als COT-Berichte. Diese Informationen direkt auf Ihrem Chart zu sehen, ist der wahre Game
99 USD
Price Action Entry Alerts
Stephen Sanjeeve Sahayam
5 (2)
Dieser Indikator überprüft jeden Balken auf Kauf- oder Verkaufsdruck und identifiziert 4 Arten von Kerzenmustern mit dem höchsten Volumen. Diese Kerzen werden dann mithilfe mehrerer linearer Filter gefiltert, um Kauf- oder Verkaufssignale anzuzeigen. Signale funktionieren am besten in Verbindung mit einer höheren Zeitrahmenrichtung und wenn sie während der Stunden mit hohem Handelsvolumen gehandelt werden. Alle Filter sind anpassbar und funktionieren unabhängig voneinander. Kann Signale einer e
225 USD
Derzeit 20% Rabatt! Die beste Lösung für jeden Neueinsteiger oder Expert Händler! Dieses Dashboard arbeitet mit 28 Währungspaaren. Es basiert auf 2 unserer Hauptindikatoren (Advanced Currency Strength 28 und Advanced Currency Impulse). Es bietet einen hervorragenden Überblick über den gesamten Forex-Markt. Es zeigt die Werte der Advanced Currency Strength, die Veränderungsrate der Währungen und die Signale für 28 Devisenpaare in allen (9) Zeitrahmen. Stellen Sie sich vor, wie sich Ihr Hande
199 USD
Werden Sie Breaker Trader und profitieren Sie von Änderungen der Marktstruktur, wenn sich der Preis umkehrt. Der Order Block Breaker Indikator zeigt an, wann sich eine Trend- oder Preisbewegung der Erschöpfung nähert und bereit ist, sich umzukehren. Es weist Sie auf Änderungen in der Marktstruktur hin, die normalerweise auftreten, wenn eine Umkehrung oder ein größerer Rückzug bevorsteht. Der Indikator verwendet eine proprietäre Berechnung, die Ausbrüche und Preisdynamik identifiziert. Jedes
49 USD
Entry Points Pro
Yury Orlov
4.7 (222)
Dies ist ein Indikator für MT4, der genaue Signale für den Einstieg in einen Handel ohne Repainting (Neuzeichnen) liefert. Er kann auf alle Finanzwerte angewendet werden: Forex, Kryptowährungen, Metalle, Aktien, Indizes. Er liefert ziemlich genaue Schätzungen und sagt Ihnen, wann es am besten ist, eine Position zu eröffnen und zu schließen. Sehen Sie sich das Video (6:22) mit einem Beispiel für die Verarbeitung nur eines Signals an, das sich für den Indikator gelohnt hat! Die meisten Händler ver
125 USD
Currency Strength Wizard ist ein sehr leistungsstarker Indikator, der Ihnen eine Komplettlösung für erfolgreichen Handel bietet. Der Indikator berechnet die Stärke dieses oder jenes Forex-Paares anhand der Daten aller Währungen in mehreren Zeitrahmen. Diese Daten werden in Form von benutzerfreundlichen Währungsindizes und Währungsstärkelinien dargestellt, anhand derer Sie die Stärke dieser oder jener Währung erkennen können. Sie müssen lediglich den Indikator an das Diagramm anhängen, mit dem Si
65 USD
DERZEIT 31% RABATT! Die beste Lösung für jeden Newbie oder Expert Trader! Dieser Indikator ist ein einzigartiges, qualitativ hochwertiges und erschwingliches Handelsinstrument, da wir eine Reihe von proprietären Funktionen und eine geheime Formel eingebaut haben. Mit nur EINEM Chart liefert er Alerts für alle 28 Währungspaare. Stellen Sie sich vor, wie sich Ihr Handel verbessern wird, weil Sie in der Lage sind, den genauen Auslösepunkt eines neuen Trends oder einer Scalping-Gelegenheit zu e
88 USD
PRO Renko System ist ein hochpräzises Handelssystem, das speziell für den Handel mit RENKO-Charts entwickelt wurde. Dies ist ein universelles System, das auf verschiedene Handelsinstrumente angewendet werden kann. Das System neutralisiert effektiv so genannte Marktgeräusche, die Ihnen Zugang zu genauen Umkehrsignalen geben. Der Indikator ist sehr einfach zu bedienen und hat nur einen Parameter, der für die Signalerzeugung verantwortlich ist. Sie können das Tool einfach an jedes Handelsinstr
75 USD
Der ADR-Umkehrindikator zeigt Ihnen auf einen Blick, wo der Preis derzeit im Verhältnis zu seiner normalen durchschnittlichen Tagesspanne gehandelt wird. Sie erhalten sofortige Benachrichtigungen per Pop-up, E-Mail oder Push, wenn der Preis seine durchschnittliche Spanne und darüber liegende Niveaus Ihrer Wahl überschreitet, sodass Sie schnell in Pullbacks und Umkehrungen einsteigen können. Der Indikator zeichnet horizontale Linien auf dem Chart an den durchschnittlichen täglichen Range-Extreme
49 USD
Trend Screener
STE S.S.COMPANY
4.78 (63)
Trendindikator, bahnbrechende, einzigartige Lösung für Trendhandel und -filterung mit allen wichtigen Trendfunktionen in einem Tool! Es handelt sich um einen 100 % nicht neu zu malenden Multi-Timeframe- und Multi-Währungs-Indikator, der für alle Symbole/Instrumente verwendet werden kann: Forex, Rohstoffe, Kryptowährungen, Indizes und Aktien. Trend Screener ist ein effizienter Trendfolgeindikator, der Pfeiltrendsignale mit Punkten im Diagramm liefert. Die Funktionen, die im Trendanalysator-Indika
50 USD
Gann Made Easy
Oleg Rodin
5 (9)
Gann Made Easy ist ein professionelles und einfach zu bedienendes Forex-Handelssystem, das auf den besten Handelsprinzipien unter Verwendung der Theorie von Mr. basiert. W.D. Gann. Der Indikator liefert genaue KAUF- und VERKAUFSsignale, einschließlich Stop-Loss- und Take-Profit-Levels. Mit PUSH-Benachrichtigungen können Sie auch unterwegs handeln. Bitte kontaktieren Sie mich nach dem Kauf! Ich werde meine Handelstipps und tolle Bonusindikatoren kostenlos mit Ihnen teilen! Wahrscheinlich haben Si
55 USD
ICT Template MT4
David Perk
4.94 (16)
ICT Template Indicator visualizes and automatically updates all important ICT elements for Scalpers, Day and Swing traders. It allows you too keep your chart clean and bring any elements by just one click to the buttons. Thanks to mobile notifications on external liquidity levels, you will not miss any opportunity and you don't have to sit behind the screens whole day. Each element has fully customizable colours, width, line types, max timeframe to be shown etc... so you can really tweak your c
50 USD
ICT, SMC, SMART MONEY CONCEPTS, SMART MONEY, Smart Money Concept, Support and Resistance, Trend Analysis, Price Action, Market Structure, Order Blocks, BOS/CHoCH,   Breaker Blocks ,  Momentum Shift,   Supply&Demand Zone/Order Blocks , Strong Imbalance, HH/LL/HL/LH,    Fair Value Gap, FVG,  Premium  &   Discount   Zones, Fibonacci Retracement, OTE, Buy Side Liquidity, Sell Side Liquidity, BSL/SSL Taken, Equal Highs & Lows, MTF Dashboard, Multiple Time Frame, BigBar, HTF OB, HTF Market Structure, 
75 USD
Currency Strength Exotics
Bernhard Schweigert
4.86 (29)
Stärke von 8 Währungen plus EIN EXOTISCHES Paar oder Rohstoffe oder Indexe! Jedes Produkt kann als 9. Linie hinzugefügt werden. Fügen Sie Rohstoffe, Indexes oder exotische Währungen hinzu (Gold, Silber, Öl, DAX, US30, MXN, TRY, CNH ...). Eine neue noch nie dagewesene TRADING STRATEGIE  !!! Dieser Indikator ist einzigartig, weil wir eine Reihe von proprietäre Funktionen und neue Formeln eingebaut haben. Es funktioniert für alle Zeitrahmen. Basierend auf neuen zugrunde liegenden Algorithmen ist
128 USD
Trend Scanner GS
Vasiliy Strukov
5 (23)
Trend Scanner scannt Markttrends aus Multi-Symbolen und Multi-Time-Frames und zeigt sie auf einem beweglichen Panel auf dem Chart an, den er zur Analyse verwendet. Der Händler kann mehrere Paare seiner Wahl zur Anzeige auswählen. Trend Scanner ist ein großartiges Tool, um die Richtung des Trends zu sehen, und kann für den manuellen Handel oder den EA-Handel verwendet werden, indem nur Kauf- oder Verkaufsaufträge gemäß dem Trend zugelassen werden. Echtzeit-Ergebnisse können hier eingesehen wer
149 USD
ICT, SMC, Smart Money Concept, Support and Resistance, Trend Analysis, Price Action, Market Structure, Order Blocks, Breaker Blocks, Momentum Shift, Strong Imbalance, HH/LL/HL/LH, Fair Value Gap, FVG, Premium & Discount Zones, Fibonacci Retracement, OTE, Buyside Liquidity, Sellside Liquidity, Liquidity Voids, Market Sessions, NDOG, NWOG,Silver Bullet,ict template Auf dem Finanzmarkt ist eine genaue Marktanalyse für Investoren von entscheidender Bedeutung. Um Investoren dabei zu helfen, Markttre
39 USD
Please send me Direct message on MQL5 CHAT after purchasing the Indicator for Training and Installation Support There are some additional files that is important to use with the Indicator . So be sure to contact me after purchasing the Indicator So that I can add you for training and support . If you find any difficulty with installation then send me Direct message here So that I can connect with you via Anydesk or Teamview for the product installation. " Smart Order Block Indicator " to find
249 USD
Ultimate Sniper Dashboard
Hispraise Chinedum Abraham
4.67 (24)
Ermäßigt auf $299! Die Preise können in Zukunft steigen! Lesen Sie die Beschreibung unten! Bestes Einstiegssystem für Ultimate Sniper Dashboard: ULTIMATIVE DYNAMISCHE EBENEN. (Bitte überprüfen Sie meine Produkte) Das Ultimate Sniper Dashboard funktioniert NUR auf Live-Märkten aufgrund der MT4 Multicurrency Testlimits. Wir stellen Ihnen das Ultimate-Sniper Dashboard vor! Unser bestes, das sowohl HA-Sniper, MA-Sniper und viele spezielle Modi enthält. Das Ultimate Sniper Dashboard ist ein
349 USD
Scalper Vault
Oleg Rodin
5 (20)
Scalper Vault ist ein professionelles Scalping-System, das Ihnen alles bietet, was Sie für erfolgreiches Scalping benötigen. Dieser Indikator ist ein komplettes Handelssystem, das von Forex- und Binäroptionshändlern verwendet werden kann. Der empfohlene Zeitrahmen ist M5. Das System liefert Ihnen genaue Pfeilsignale in Richtung des Trends. Es liefert Ihnen auch Top- und Bottom-Signale und Gann-Marktniveaus. Die Indikatoren bieten alle Arten von Warnungen, einschließlich PUSH-Benachrichtigungen.
65 USD
ADR Alert Dashboard
LEE SAMSON
3.73 (11)
Das ADR Alert Dashboard zeigt Ihnen auf einen Blick, wo der Preis aktuell im Verhältnis zu seiner normalen durchschnittlichen Tagesspanne gehandelt wird. Sie erhalten sofortige Benachrichtigungen per Pop-up, E-Mail oder Push, wenn der Preis seine durchschnittliche Spanne und darüber liegende Niveaus Ihrer Wahl überschreitet, sodass Sie schnell in Pullbacks und Umkehrungen einsteigen können. Das Dash ist so konzipiert, dass es auf einem leeren Diagramm platziert werden kann und einfach im Hinter
49 USD
Das Forex Breath System ist ein trendbasiertes Handelssystem, das auf jedem Markt eingesetzt werden kann. Sie können dieses System mit Währungen, Metallen, Rohstoffen, Indizes, Krypto und sogar Aktien verwenden. Es kann auch mit jedem Zeitrahmen verwendet werden. Das System ist universell. Es zeigt den Trend an und liefert Pfeilsignale mit dem Trend. Der Indikator kann Ihnen auch eine spezielle Art von Warnungen liefern, wenn die Signale in Trendrichtung erscheinen, was den Trendhandel zu einer
45 USD
Das RSI / TDI-Warnungs-Dashboard ermöglicht es Ihnen, RSIs (von Ihnen wählbar) für jedes wichtige Paar, das Sie handeln, sofort zu überwachen. Sie können es auf zwei Arten verwenden: 1. Wählen Sie mehrere Zeitrahmen aus und der Strich zeigt Ihnen, wenn es mehrere Zeitrahmen gibt, die über die normalen Handelsbedingungen hinausgehen. Ein großartiger Indikator dafür, dass der Preis in letzter Zeit stark nach oben gedrückt hat, da er über mehrere Zeiträume hinweg ein überkauftes oder überver
49 USD
Weitere Produkte dieses Autors
Horizontal volume bars, Cluster analysis, Volume profile Volume in Range gets information about the accumulated volume in a specified vertical range and period in bars. The received data is then plotted on the chart as rectangular boxes with the volume quantity inside. Usage:- The tool acts as a support resistance levels but most importantly it should be used to check in which direction the price breaks out of the significant levels formed by this indicator and then actions to be taken on correc
30 USD
The indicator helps the trader in identifying potential liquidity levels. The algorithm used in this indicator checks the behavior of the asset taking into account the price levels, momentum and volume analysis. Features:- Parameters for signal optimization and alerts. Usage:- The levels formed by the indicator can be helpful to traders in identifying potential entries, breakouts or reversals. it can assist traders of technical trading background or even pure price action trading.
30 USD
Renko bars builder
Navdeep Singh
5 (4)
The indicator builds a Renko chart in the sub window for the current symbol. The bars are formed from live data and the desired bar size can be set in the inputs tab. Most importantly, because the Renko chart only uses price to construct bars and ignores time, the indicator can be applied to any time frame and same results can be achieved. Recommended usage As Renko charts are famous for eliminating noise so traders can use this tool to see clear picture of the trend to help their analysis, ent
FREE
ZigZag New
Navdeep Singh
5 (3)
Informative & optimized Zigzag, Accumulated volume, Price change   A rewrite of the traditional zigzag tool with new additions. Features:- Optimized code Displays accumulated volume between peaks Displays price change between peaks Usage:- Identify trend swings Identify high volume swings Compare price changes between swings Drawing Fibonacci tool on strong price change or high volume swings
FREE
Renko Signals, Renko Bars Automated Trading This expert is based on the Renko Bar Builder  indicator. Features:-   Open & Close position on Renko Reversal Bar Fix or Managed Lot(spread included) Stop Loss & Take Profit as multiple of Bar size(spread included) Note:- As this is a Renko expert which works on Renko Bars which are build on live data, it is recommended to not change Chart Time-frame or Symbol after the expert has been loaded. Use Bar Size appropriate(not too low) to Symbol Range. 
FREE
RSI Scanner, Multiple Symbols and Timeframes, Graphical User Interface An indicator that scans multiple symbols added from the market watch and timeframes and displays result in a graphical panel. Features: Multi symbol Multi timeframe Alerts and Notifications Live Monitoring Sorting modes One click to change symbol and timeframe Inputs for RSI and scanner settings
FREE
ADR Bands
Navdeep Singh
4 (2)
Average daily range, Projection levels, Multi time-frame ADR bands shows levels based on the selected time-frame. Levels can be used as projections for potential targets, breakouts or reversals depending on the context in which the tool is used. Features:- Multi time-frame(default = daily) Two coloring modes(trend based or zone based) Color transparency  
FREE
Market structures, Market balance, Range breakouts This tools helps to identify areas of market ranges, structures and plots colored boxes on breakout of those areas. User is given the option to receive alerts and notifications on the formation of the blocks. The tool has the ability to become an essential part of a technical trading system or even pure price action trading. Usage:- An essential tool for price action or technical traders.  More information in the blog
30 USD
This is the new version of the Algorithmic signals featuring a new algorithm. It is a blend of technical and candlestick analysis. Candlestick analysis are often ignored while creating technical strategies but this version has a feature to include that and make confirmations more strong.  Usage:- Traders can use the signals for buying and selling assets or even blend their own favorite indicators with it.
30 USD
RSI Levels generates buy and sell arrows based on RSI analysis. Signals are based on extreme levels breakouts and can be further filtered by a volatility metric. Trader can use the mode which compliments his/her trading style.  Features:- Parameters for signal optimization and alerts. Usage:-   RSI Levels can be used as a stand alone indicator with context or even be added to strategies to make confirmations more strong. Volatility based stop loss, take profit & position sizing can be very helpf
30 USD
50+ Candlestick Patterns, Simulated Trading Results, Top Five Performers Candle Analysis extends Candlesticks Pattern Analysis by not only identifying Patterns but also recording the Past Performance of the Patterns. What it Does:- Identifies and plots results on chart Displays Top Patterns for both Bullish and Bearish type.  Log can be printed in experts tab to see Simulated Trading results Displays All or Selected Patterns Alerts on Pattern formation More detailed information in Blog
30 USD
Algorithmic Signals indicator   is not an indicator but a strategy that generates entry/exit signals. The entry arrows are formed after multiple conditions are met. The indicator is using an   Adaptive Algorithm   which automatically adjust to the symbol and time frame (see the screenshots below) . Signals can be used for scalping or even trend trading. Main features:- Non repainting signals Entry signals Exit signals Alert for price reaching 1 x ATR(14) (could be utilized for initial take prof
44 USD
Stochastic force is an advanced version of the stochastic oscillator. Instead of using the regular price a more efficient price data is provided as an input for the oscillator which takes into account the price efficiency, volume and market noise. Also price is pre-filtered with the selected average type and then post-filtered by a hull moving average which provides a smooth transition of the oscillator. It eliminates maximum false signals and has the potential to become an integral part of any
30 USD
The indicator helps the trader in identifying potential liquidity levels. The algorithm used in this indicator checks the behavior of the asset taking into account the price levels, momentum and volume analysis. Features:- Parameters for signal optimization and alerts. Usage:- The levels formed by the indicator can be helpful to traders in identifying potential entries, breakouts or reversals. it can assist traders of technical trading background or even pure price action trading. Examples o
30 USD
Step force index is a modified version of the famous force index indicator. As the name suggests it incorporates a step feature to filter the force index values thus eliminating small fluctuations in the indicator. It also utilizes the smooth algorithm library thereby providing multiple smoothing options for the index values. This personal implementation makes it a more easy to use and a reliable tool. Main features A wide range of parameters for signals optimization Alerts, emails and push noti
30 USD
CMA dashboard is designed to help traders in identifying trend on multiple timeframes and symbols. It displays a clear state of the overall trend at one place without the need to navigate between different charts and timeframes. This saves time and makes decision making process fast so that potential opportunities are not missed. It is based on Corrected moving averages available here Features Parameters for signal optimization Inputs for multiple timeframes and symbols  Usage Higher timeframe
30 USD
IBB Candles is a tool that is based on the concept of Inverse Bollinger Bands. It compares price relative to state of the bands and plots candles with different colors defining the current state of the market i.e range | trend | strong trend. As the name suggests IBB(Inverse Bollinger Bands) is a technique which is completely different from the traditional Bollinger Bands and proves to be much more effective in analyzing market. This personal implementation makes this tool a more reliable option
30 USD
Horizontal volume bars, Cluster analysis, Volume profile Volume in Range gets information about the accumulated volume in a specified vertical range and period in bars. The received data is then plotted on the chart as rectangular boxes with the volume quantity inside. Usage:- The tool acts as a support resistance levels but most importantly it should be used to check in which direction the price breaks out of the significant levels formed by this indicator and then actions to be taken on correc
30 USD
This utility is specifically designed for No Nonsense Forex traders. What it does:- Let traders add or remove symbols to trade Editable boxes in panel for updating inputs Automatically applies money management to the trades Places all orders with a single click  How it calculates:- Two trades are opened per symbol By default max risk per trade is 1% By default total risk is 6% which can changed in inputs tab(recommended to keep it 6 or below)  On addition of symbols the total risk will be divide
30 USD
Price breakouts, Levels, Multi-time frame Inside bars checks for price failure to break from the previous high/low and on breakout draws a breakout box on the chart. The choice of breakout price is given to the user i.e. close or high/low of bar. Alerts can be received on breakouts. Features:- Multi-time frame Alerts, notifications & emails Usage:- Breakout signals Check how price action is evolving with the help of boxes Get multi-time frame bias
30 USD
Market Fractal Analysis, Fractal Swing, Market Flow Fractal Cycles looks for Similar Patterns in the Market that repeat themselves because of the Market Fractal Nature. These patterns are displayed with help of Graphical Objects and Alerts can be received on their arrival. Read the Blog for full information. Features:- Auto Detection of Patterns Customization for Color and Line Styles Alerts, Emails & Push Notifications 
30 USD
Stochastic force is an advanced version of the stochastic oscillator. Instead of using the regular price a more efficient price data is provided as an input for the oscillator which takes into account the price efficiency, volume and market noise. Also price is pre-filtered with the selected average type and then post-filtered by a hull moving average which provides a smooth transition of the oscillator. It eliminates maximum false signals and has the potential to become an integral part of any
30 USD
IBB Candles is a tool that is based on the concept of Inverse Bollinger Bands. It compares price relative to state of the bands and plots candles with different colors defining the current state of the market i.e range | trend | strong trend. As the name suggests IBB(Inverse Bollinger Bands) is a technique which is completely different from the traditional Bollinger Bands and proves to be much more effective in analyzing market. This personal implementation makes this tool a more reliable optio
30 USD
Market structures, Market balance, Range breakouts This tools helps to identify areas of market ranges, structures and plots colored boxes on breakout of those areas. User is given the option to receive alerts and notifications on the formation of the blocks. The tool has the ability to become an essential part of a technical trading system or even pure price action trading. Usage:- An essential tool for price action or technical traders.  More information in the blog
30 USD
Market Fractal Analysis, Fractal Swing, Market Flow Fractal Cycles looks for Similar Patterns in the Market that repeat themselves because of the Market Fractal Nature. These patterns are displayed with help of Graphical Objects and Alerts can be received on their arrival. Read the   Blog   for full information. Features:- Auto Detection of Patterns Customization for Color and Line Styles Alerts, Emails & Push Notifications
30 USD
50+ Candlestick Patterns, Simulated Trading Results, Top Five Performers Candle Analysis extends Candlesticks Pattern Analysis by not only identifying Patterns but also recording the Past Performance of the Patterns. What it Does:- Identifies and plots results on chart Displays Top Patterns for both Bullish and Bearish type.  Log can be printed in experts tab to see Simulated Trading results Displays All or Selected Patterns Alerts on Pattern formation More detailed information in   Blog
30 USD
Auswahl:
Keine Bewertungen
Antwort auf eine Rezension
Version 1.1 2021.02.12
Optimized code for faster execution.

Parameters options added for signals optimization.