MACD Intraday Trend
- Indikatoren
- JETINVEST
- Version: 3.0
- Aktualisiert: 5 Juni 2021
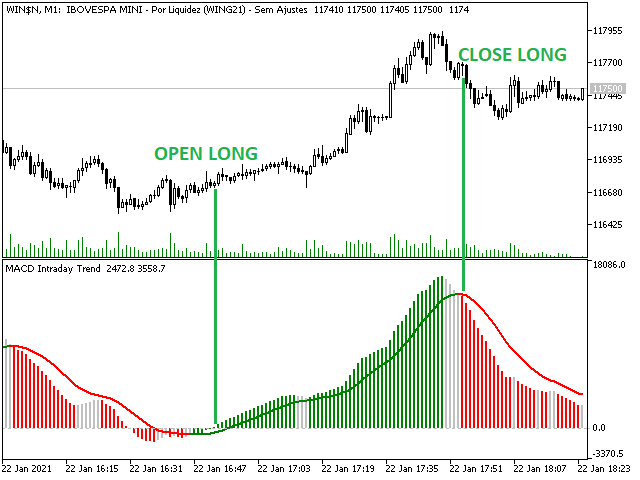
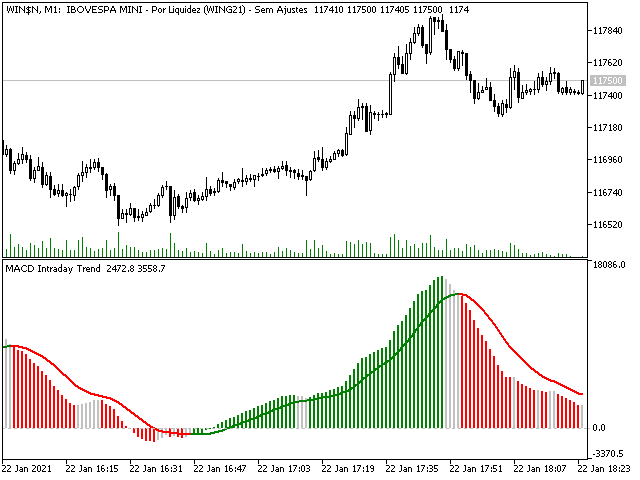
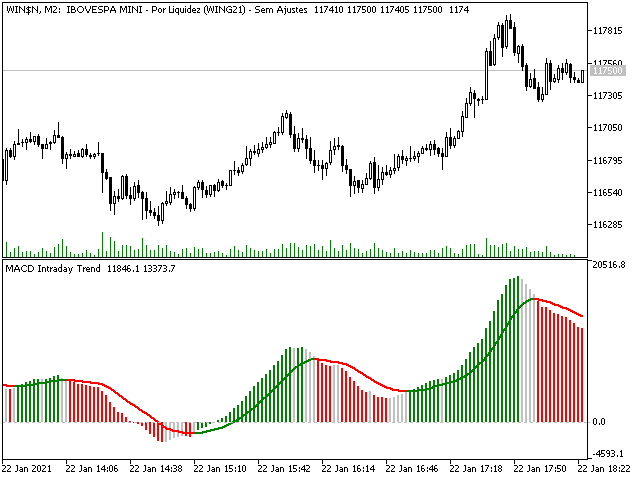
MACD Intraday Trend ist ein Indikator, der durch eine Adaption des ursprünglichen MACD von Gerald Appel in den 1960er Jahren entwickelt wurde.
Im Laufe der Jahre des Handels wurde beobachtet, dass wir durch die Änderung der Parameter des MACD mit Fibonacci-Proportionen eine bessere Darstellung der Kontinuität der Trendbewegungen erreichen, wodurch es möglich ist, den Beginn und das Ende eines Preistrends effizienter zu erkennen.
Aufgrund seiner Effizienz bei der Erkennung von Kurstrends ist es auch möglich, die Divergenzen von Tops und Bottoms sehr klar zu erkennen und so Handelschancen besser zu nutzen.
Probieren Sie unbedingt unsere professionelle Version mit konfigurierbaren Funktionen und Warnungen aus: MACD Intraday Trend PRO
Merkmale
- Funktioniert mit jedem Währungspaar
- Funktioniert zu jedem Zeitpunkt
- Funktioniert mit Renko-Charts
Wenn Sie noch Fragen haben, kontaktieren Sie mich bitte per Direktnachricht: https://www.mql5.com/de/users/robsjunqueira/


great