Least Square MA
- Indikatoren
- Illia Zhavarankau
- Version: 1.0
- Aktivierungen: 5
Least Square MA
Description:
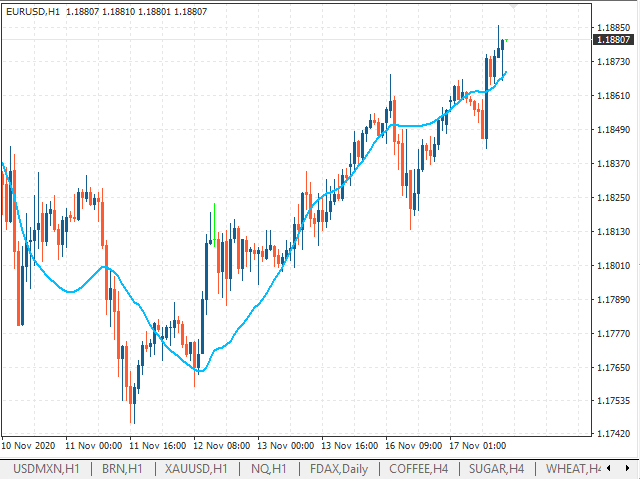
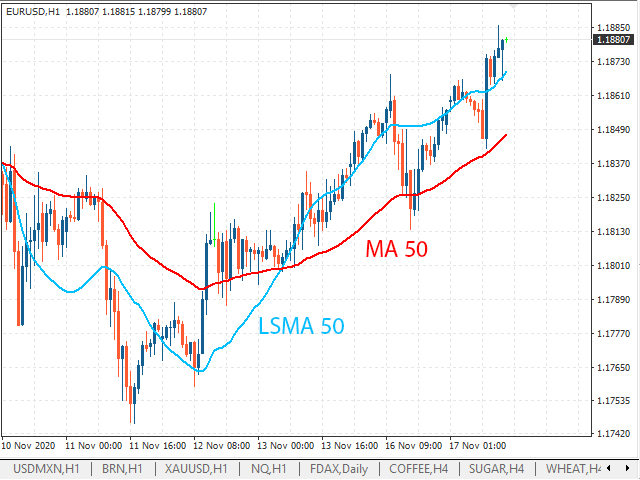
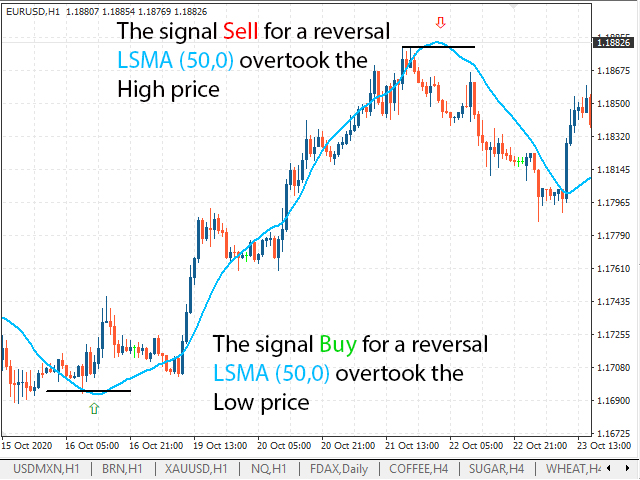
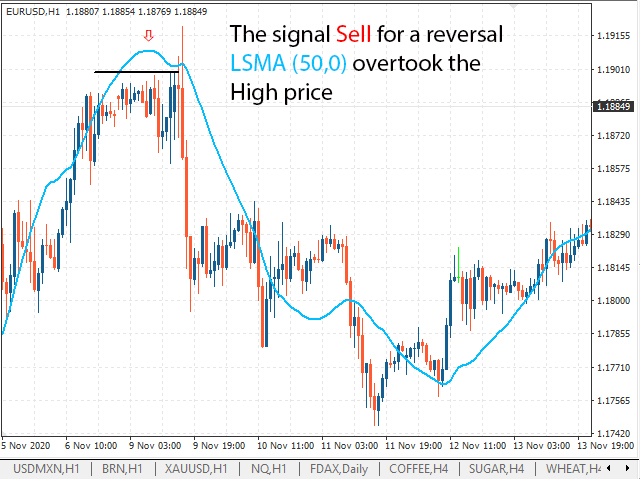
The Least Square Moving Average indicator allows you to assess the direction of the market movement and its possible reversals. The indicator is a line that is displayed in the price window.
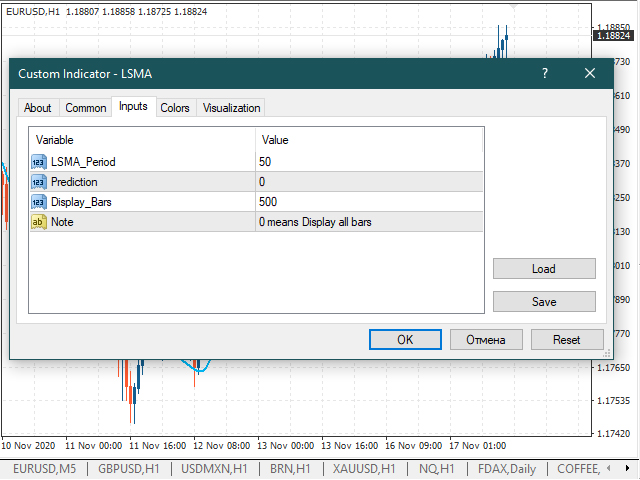
Input parameters:
LSMA_Period - the period for calculating the moving average using the least squares method;
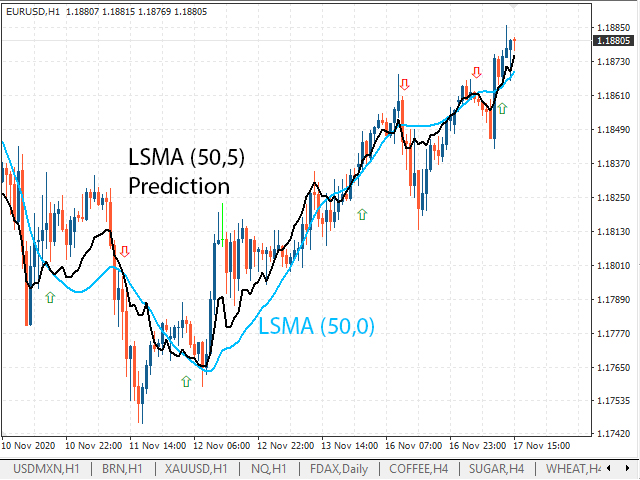
Prediction - the number of candles used to construct the predicted moving average using the least squares method, provided that its rate (falling or growing remains);
Display_Bars - the number of displayed bars (if 0, all are displayed).
Can be used to determine:
- trend direction;
- identification of potential reversal points;
- placing Stop Losses or Take Profits.