• Übersicht
  • Bewertungen
  • Diskussion
  • Neue Funktionen

Angulation

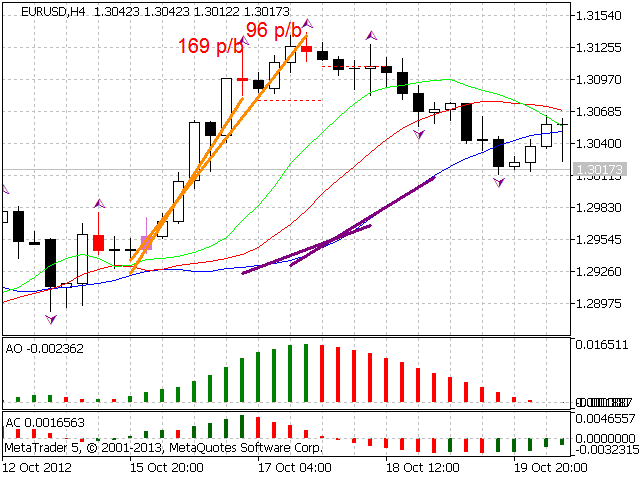
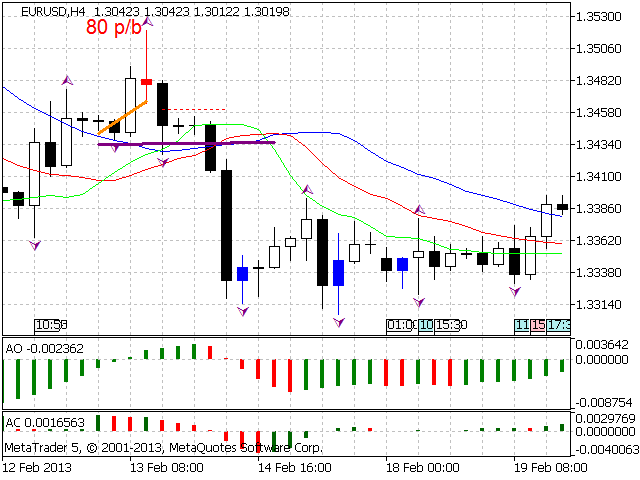
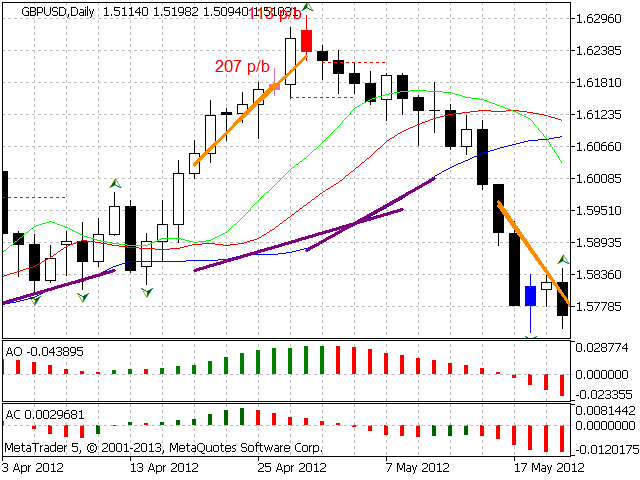
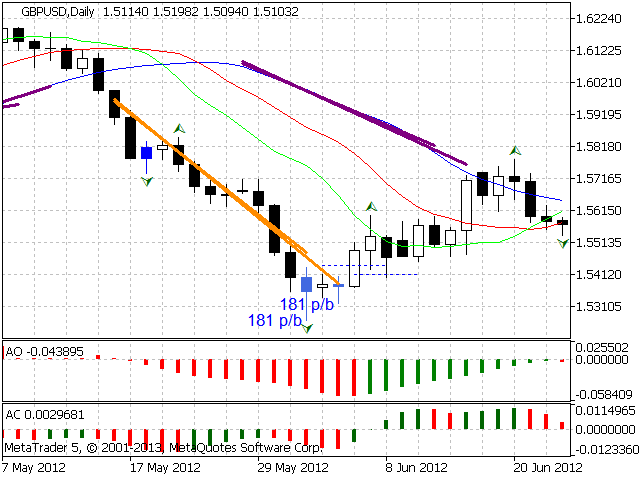
According to Bill Williams' trading strategy described in the book "Trading Chaos: Maximize Profits with Proven Technical Techniques" the indicator displays the following items in a price chart:

1.Bearish and bullish divergent bars:

  • Bearish divergent bar is colored in red or pink (red is a stronger signal).
  • Bullish divergent bar is colored in blue or light blue color (blue is a stronger signal).

2. "Angulation" formation with deviation speed evaluation.

3. The level for placing a pending order (displayed as a dashed line).

Angulation is formed by divergence of two lines:

  • price line that passes through the borders of bars. Lower borders of bars are used during upward motion upper borders are used during downward motion
  • balance line that passes through the Alligator jaw (blue line).

Angulation is formed after forming a divergent bar outside the Alligator jaws.

The higher the price deviation angle and balance lines, the better is Angulation. In this version instead of measuring the angle, calculation of deviation speed is performed. The higher the price deviation line and balance lines, the better is the Angulation. Deviation speed is measured in points per 1 bar or in points per one hour.

Deviation speed is displayed next to the divergent bar. There is a filter in the settings on the minimum deviation speed as well as an option to select the displayed measurement unit.

You can select one of two algorithms of drawing the balance lines:

Simple - the line is drawn from the crossing bar to the point of the corresponding divergent bar (moved 8 bars ahead);

Advanced - the algorithm considers the duration of formed Angulation. When a boundary value is reached it draws the balance line so that the probability of a false angulation is minimal when the price price moves parallel.

Settings:

  • Max Bars – number of bars calculated on the chart;
  • Set Divergent Bar – settings for divergent bars;
  • Show Divergent Bar – display divergent bars for which the Angulation hasn't been formed;
  • Divergent Bar Alert – use alerts for divergent bars;
  • Set Angulation – settings for Angulation;
  • Angulation Aler – use alerts for Angulation;
  • Comments for missed Divergent Bars – comment the reason why the Angulation to the divergent bar wasn't formed;
  • Check Awesome Oscillator – check the values of the Awesome Oscillator histogram according to Bill Williams's trading strategy;
  • Min duration of Angulation – minimum formation duration (possible minimum=2);
  • Max duration of Angulation – maximum formation duration;
  • Type of Algorithm – type of the algorithm used to draw the balance line;
  • Start checking parallel motion – boundary value of formation duration, only for the Advanced algorithm (see description);
  • Show Speed Differences – display deviation speed;
  • Show Speed in – selection of the deviation speed unit in pips/bar or pips/h;
  • Min Speed – minimum deviation speed filter;
  • Font Size – font size to display deviation speed;
  • Set Line Color – price and balance line color and style settings;
  • Price Line Color – price line color;
  • Balance Line Color – balance line color;
  • Style Line – line style;
  • Width Line – line width;
  • Set Alligator – the Alligator indicator parameters;
  • Jaw Period – jaw period;
  • Jaw Shift – jaw shift;
  • Teeth Period – teeth period;
  • Teeth Shift – teeth shift;
  • Lips Period – lips period;
  • Lips Shift – lips shift;
  • MA Method – method of averaging;
  • Applied Price – price type;
  • Set Order Level – display settings of pending order level;
  • Show Order Lever – display the level for placing a pending order (the level is set  without considering spread);
  • Indent Level – order level offset from the divergent bar (in points);
  • Buy Stop Order Level – color of "Buy Stop Order" level line;
  • Sell Stop Order Level – color of "Sell Stop Order" order line;
  • Style Line – line style;
  • Width Line – line width.

It is recommended to use the indicator on H4 and higher timeframes.

Empfohlene Produkte
Point Black
Ignacio Agustin Mene Franco
Black Card Pack indicator 5/1 point black It has the strategy of professional bollingers where each arrow gives you a different entry signal. It is used to operate in m1 and in d1 It is used for scalping and intraday, modified for forex markets ! suitable for all pairs modified for synthetic index markets suitable for all pairs! Ideal for volatility and jumps!
Dieser Indikator zeigt Ihnen die TP- und SL-Werte (in dieser Währung), die Sie bereits für jede Order in den Charts (geschlossen zur Transaktions-/Orderzeile) festgelegt haben, was Ihnen sehr dabei helfen wird, Ihren Gewinn und Verlust für jede Order zu schätzen. Und es zeigt Ihnen auch die PIPs-Werte. das angezeigte Format ist „Währungswerte unserer Gewinn- oder Verlust-/PIPs-Werte“. Der TP-Wert wird in grüner Farbe und der SL-Wert in roter Farbe angezeigt. Bei Fragen oder weiteren Informati
"2nd To NoneFX Scalper" is one powerful indicator which you can use on any timeframe. The accuracy is in between 90% - 95% can be more. The indicator is 100% non repaint so it doesn't repaint at all. When the arrow comes out wait for the candlestick to close the arrow won't repaint/recalculate or move. The indicator works with all volatility indices,step index, Boom & Crash(500 & 1000) and all currency pairs. You can change settings of the indicator. For great results find the trend of the pair,
Owl Smart Levels MT5
Sergey Ermolov
4.07 (28)
MT4-Version  |  FAQ Der Owl Smart Levels Indikator ist ein komplettes Handelssystem innerhalb eines Indikators, der so beliebte Marktanalysetools wie die fortschrittlichen Fraktale von Bill Williams , Valable ZigZag, das die richtige Wellenstruktur des Marktes aufbaut, und Fibonacci-Levels , die die genauen Einstiegslevels markieren, enthält in den Markt und Orte, um Gewinne mitzunehmen. Detaillierte Strategiebeschreibung Anleitung zur Verwendung des Indikators Berater-Assistent im Handel Owl H
Was: $249  Now: $99   Market Profile defines a number of day types that can help the trader to determine market behaviour. A key feature is the Value Area, representing the range of price action where 70% of trading took place. Understanding the Value Area can give traders valuable insight into market direction and establish the higher odds trade. It is an excellent addition to any system you may be using. Inspired by Jim Dalton’s book “Mind Over Markets”, this indicator is designed to suit the
Your Trend Friend
Luigi Nunes Labigalini
5 (1)
The trend is your friend! Look at the color of the indicator and trade on that direction. It does not  repaint. After each candle is closed, that's the color of the trend. You can focus on shorter faster trends or major trends, just test what's most suitable for the symbol and timeframe you trade. Simply change the "Length" parameter and the indicator will automatically adapt. You can also change the color, thickness and style of the lines. Download and give it a try! There are big movements
Gecko EA MT5
Profalgo Limited
5 (1)
NEW PROMO: Only a few copies copies available at 349$ Next price: 449$ Make sure to check out our " Ultimate EA combo package " in our   promo blog ! Gecko runs a simple, yet very effective, proven strategy.  It looks for important recent support and resistance levels and will trade the breakouts.  This is a "real" trading system, which means it will use a SL to protect the account.  It also means it will not use any dangerous techniques like martingale, grid or averaging down. The EA shows its
Fibonacci and RSI. Demo versión only works with GBPUSD. For full version, please, visit visit https://www.mql5.com/en/market/product/52101 The indicator is a combination of the Fibonacci and RSI indicators. Every time the price touches one of the fibonacci levels and the rsi condition is met, an audible alert and a text alert are generated. Parameters number_of_candles : It is the number of candles that will be calculated. If you put 100, the indicator will give you the maximum and min
FREE
True Day
Aurthur Musendame
5 (1)
True Days is a tool designed specifically for the trader who wants to catch intraday volatility in price charts.  True day makes it easier for the trader to avoid trading in the dead zone - a period in time where markets are considered dead or non volatile. The trader can concentrate on finding opportunities only during periods of profound market movements. By default the indicator gives you a true day starting at 02:00 to 19:00 hours GMT+2. You can adjust according to your Time Zone. By deafult
FREE
Pullback Hunter
Anton Polkovnikov
PULLBACK HUNTER What is every trader's cherished dream? To see without delay the places where the reversal will happen. This, of course, is from the category of magic, though... nothing is impossible. But for now I've prepared for you an indicator that marks in real time the end of corrections to the current movement or in short - catches pullbacks.What is the main point? Many people practice rebounds when the price moves in the direction of the open position. And they do them on the formation o
Der Trendfänger: Die Strategie des Trendfängers mit Alarmindikator ist ein vielseitiges technisches Analysewerkzeug, das Händlern hilft, Markttrends und potenzielle Ein- und Ausstiegspunkte zu identifizieren. Sie verfügt über eine dynamische Trendfängerstrategie, die sich den Marktbedingungen anpasst, um eine klare visuelle Darstellung der Trendrichtung zu ermöglichen. Händler können die Parameter an ihre Vorlieben und Risikotoleranz anpassen. Der Indikator hilft bei der Trendidentifikation,
FREE
Half ma
Artem Svistunov
The Half ma arrow indicator for the MetaTrader 5 trading terminal is a simple but effective tool that gives a signal about a change in the current trend. The Half ma indicator looks like a solid dynamic line that changes color at the points where the trend changes. At these points, the indicator draws arrows of the corresponding color and direction.The Half ma arrow indicator for the MT5 terminal is not an independent source of input signals. It will be most effective to use it as a trend filte
Adjustable Consecutive Fractals  looks for 2 or more fractals in one direction and sends out a on screen alert, sound alert and push notification, for strong reversal points . Adjustable Consecutive Fractals, shows the fractals on chart along with a color changing text for buy and sell signals when one or more fractals appear on one side of price. Adjustable Consecutive Fractals is based Bill Williams Fractals . The standard Bill Williams fractals are set at a non adjustable 5 bars, BUT withe
Premium-Level ist ein einzigartiger Indikator mit mehr als 80% Genauigkeit der richtigen Vorhersagen! Dieser Indikator wurde von den besten Trading-Spezialisten seit mehr als zwei Monaten getestet! Den Indikator des Autors finden Sie nirgendwo anders! Anhand der Screenshots können Sie sich von der Genauigkeit dieses Tools überzeugen! 1 ist ideal für den Handel mit binären Optionen mit einer Ablaufzeit von 1 Kerze. 2 funktioniert bei allen Währungspaaren, Aktien, Rohstoffen, Kryptowähr
Follow The Line MT5
Oliver Gideon Amofa Appiah
4.5 (28)
This indicator obeys the popular maxim that: "THE TREND IS YOUR FRIEND" It paints a GREEN line for BUY and also paints a RED line for SELL. (you can change the colors). It gives alarms and alerts of all kinds. IT DOES NOT REPAINT and can be used for all currency pairs and timeframes. Yes, as easy and simple as that. Even a newbie can use it to make great and reliable trades. NB: For best results, get my other premium indicators for more powerful and reliable signals. Get them here: https://www.m
FREE
Renko System
Marco Montemari
This indicator can be considered as a trading system. It offers a different view to see the currency pair: full timeless indicator, can be used for manual trading or for automatized trading with some expert advisor. When the price reaches a threshold a new block is created according to the set mode. The indicator beside the Renko bars, shows also 3 moving averages. Features renko mode median renko custom median renko 3 moving averages wicks datetime indicator for each block custom notificatio
How to use Pair Trading Station Pair Trading Station is recommended for H1 time frame and you can use it for any currency pairs. To generate buy and sell signal, follow few steps below to apply Pair Trading Station to your MetaTrader terminal. When you load Pair Trading Station on your chart, Pair Trading station will assess available historical data in your MetaTrader platforms for each currency pair. On your chart, the amount of historical data available will be displayed for each currency pai
The Antique Trend Indicator is a revolutionary trend trading and filtering solution with all the important features of a trend tool built into one tool! The Antique Trend indicator is good for any trader, suitable for any trader both for Forex and binary options. There is no need to configure anything, everything has been perfected by time and experience, it works great during flats and trends. The Antique Trend indicator is a tool for technical analysis of financial markets, reflecting curre
Atomic Analyst MT5
Issam Kassas
4.56 (18)
Zunächst einmal ist es erwähnenswert, dass dieser Handelsindikator nicht neu malt, nicht neu zeichnet und keine Verzögerung aufweist, was ihn sowohl für manuellen als auch für Roboterhandel ideal macht. Benutzerhandbuch: Einstellungen, Eingaben und Strategie. Der Atom-Analyst ist ein PA-Preisaktionsindikator, der die Stärke und das Momentum des Preises nutzt, um einen besseren Vorteil auf dem Markt zu finden. Ausgestattet mit fortschrittlichen Filtern, die helfen, Rauschen und falsche Signale z
Noize Absorption Index - is the manual trading system that measures the difference of pressure between bears forces and bulls forces. Green line - is a noize free index that showing curent situation. Zero value of index shows totally choppy/flat market.Values above zero level shows how powerfull bullish wave is and values below zero measures bearish forces.Up arrow appears on bearish market when it's ready to reverse, dn arrow appears on weak bullish market, as a result of reverse expectation.
Tops and Bottoms Indicator
Josue De Matos Silva
4.67 (6)
Tops & Bottoms Indicator FREE   Tops abd Bottoms:   An effective indicator for your trades The tops and bottoms indicator helps you to find  ascending and descending channel formations with indications of ascending and/or descending tops and bottoms. In addition, it  show possibles  opportunities with a small yellow circle when the indicator encounters an impulse formation. This indicator provide to you  more security and speed in making entry decisions. Also test our FREE advisor indicator:
FREE
TrendDetect
Pavel Gotkevitch
The Trend Detect indicator combines the features of both trend indicators and oscillators. This indicator is a convenient tool for detecting short-term market cycles and identifying overbought and oversold levels. A long position can be opened when the indicator starts leaving the oversold area and breaks the zero level from below. A short position can be opened when the indicator starts leaving the overbought area and breaks the zero level from above. An opposite signal of the indicator can
The Penta-O is a 6-point retracement harmonacci pattern which usually precedes big market movements. Penta-O patterns can expand and repaint quite a bit. To make things easier this indicator implements a twist: it waits for a donchian breakout in the right direction before signaling the trade. The end result is an otherwise repainting indicator with a very reliable trading signal. The donchian breakout period is entered as an input. [ Installation Guide | Update Guide | Troubleshooting | FAQ | A
Green Power
Ignacio Agustin Mene Franco
Black Card Pack indicator 5/3 Green power It has the high and low breakout strategy giving the signal with the red or green dot the red dot for short and the green dot for long , perfect for forex markets and synthetic index markets, works for all seasons It is used for scalping and intraday! Ideal for Crash and boom markets!! Volatilitys y jumps !! Micro y macro en forex !
Donchian Channel DC is the indicator of Donchian Channels, that plots maximum and minimum values of a specific period, besides mean value line. It´s possible to configure simple period for analysis and the indicator will plot all three values. You can trade with this indicator as trend or reversal, according to each strategy. Do not let to test others indicators as soon as others expert advisors.
Free automatic Fibonacci is an indicator that automatically plots a Fibonacci retracement based on the number of bars you select on the BarsToScan setting in the indicator. The Fibonacci is automatically updated in real time as new highest and lowest values appears amongst the selected bars. You can select which level values to be displayed in the indicator settings. You can also select the color of the levels thus enabling the trader to be able to attach the indicator several times with differe
FREE
Urgently mt5
Tatiana Savkevych
The Urgently indicator is designed to quickly determine the situation in the market, reflect the state of the market and signal profitable levels for opening trades. Market conditions change quickly enough, requiring constant calibration of trading strategies. Recommended for use in conjunction with any of the oscillators. The Urgently forex market trend indicator shows the trend direction and entry points. It smooths out price fluctuations when generating a signal by averaging the data and the
The Riko Trend indicator is a revolutionary trend trading and filtering solution with all the important features of a trend tool built into one tool! The Riko Trend indicator is good for any trader, suitable for any trader for both forex and binary options. You don’t need to configure anything, everything is perfected by time and experience, it works great during a flat and in a trend. The Riko Trend indicator is a technical analysis tool for financial markets that reflects the current price
Renko Gold
Ignacio Agustin Mene Franco
Renko Gold! clearly indicates the floors and ceilings where it goes from 4 lines, the line below that marks the floor in green confirming with the thinnest line clarifies the purchase entry, the same is for sale, the top line marks the ceiling and the thinnest red line marks the sale, This indicator works for all temporalities! For Forex and Synthetic Indices markets! It also works for crypto markets! Good profit! World Investor.
Provided Trend is a complex signal formation indicator. As a result of the work of internal algorithms, you can see only three types of signals on your chart. The first is a buy signal, the second is a sell signal, and the third is a market exit signal. Options: CalcFlatSlow - The first parameter that controls the main function of splitting the price chart into waves. CalcFlatFast - The second parameter that controls the main function of splitting the price chart into waves. CalcFlatAvg - Par
Käufer dieses Produkts erwarben auch
TPSproTREND PrO MT5
Roman Podpora
4.89 (9)
TPSpro TREND PRO   ist ein Trendindikator, der den Markt automatisch analysiert und Informationen über den Trend und jede seiner Änderungen liefert sowie Signale für den Einstieg in Geschäfte ohne Neuzeichnung gibt! Der Indikator verwendet jede Kerze und analysiert sie separat. bezieht sich auf verschiedene Impulse – Aufwärts- oder Abwärtsimpuls. Exakte Einstiegspunkte in Transaktionen für Währungen, Krypto, Metalle, Aktien, Indizes! Version MT5                   VOLLSTÄNDIGE BESCHREIBUNG DES I
TPSpro RFI Levels MT5
Roman Podpora
4.73 (11)
Umkehr der ersten Impulsniveaus (RFI)       ANWEISUNGEN       Russland       -        ENG    Die Empfehlung basiert auf dem Indikator -   TPSpro   TREND PRO -   Version MT5 Die wichtigsten Elemente in der Branche sind entweder in Zonen oder in der Fabrik enthalten, oder sie führen zu einer Lösung bei einem Kauf oder dem Verkauf eines anderen Instruments. Wenn viele Menschen ihre Rechte nicht auf dem Händlerkonto verschlüsseln, werden die Folgen nicht schnell genug sein. Ich habe es damit abgesch
Zunächst einmal ist es wichtig zu betonen, dass dieses Handelssystem ein Nicht-Repainting-, Nicht-Redrawing- und Nicht-Verzögerungsindikator ist, was es sowohl für manuelles als auch für automatisches Trading ideal macht. Online-Kurs, Handbuch und Vorlagen herunterladen. Das "Smart Trend Trading System MT5" ist eine umfassende Handelslösung, die für neue und erfahrene Trader maßgeschneidert ist. Es kombiniert über 10 Premium-Indikatoren und bietet mehr als 7 robuste Handelsstrategien, was es zu
Quantum Trend Sniper
Bogdan Ion Puscasu
4.78 (49)
Wir stellen vor       Quantum Trend Sniper Indicator   , der bahnbrechende MQL5-Indikator, der die Art und Weise, wie Sie Trendumkehrungen erkennen und handeln, verändert! Entwickelt von einem Team erfahrener Händler mit über 13 Jahren Handelserfahrung,       Quantum Trend Sniper-Indikator       wurde entwickelt, um Ihre Trading-Reise mit seiner innovativen Methode zur Identifizierung von Trendumkehrungen mit extrem hoher Genauigkeit auf ein neues Niveau zu heben. ***Kaufe Quantum Trend Snipe
FX Power MT5 NG
Daniel Stein
5 (5)
Erhalten Sie Ihr tägliches Marktupdate mit Details und Screenshots über unser Morning Briefing hier auf mql5 und auf Telegram ! FX Power MT5 NG ist die nächste Generation unseres langjährig sehr beliebten Währungsstärkemessers FX Power. Und was bietet dieser Stärkezähler der nächsten Generation? Alles, was Sie am ursprünglichen FX Power geliebt haben PLUS GOLD/XAU-Stärkeanalyse Noch präzisere Berechnungsergebnisse Individuell konfigurierbare Analysezeiträume Anpassbares Berechnungslimit für noc
Dies ist ein Indikator für MT5, der genaue Signale für den Einstieg in einen Handel ohne Repainting (Neuzeichnen) liefert. Er kann auf alle Finanzwerte angewendet werden: Forex, Kryptowährungen, Metalle, Aktien, Indizes. Er liefert ziemlich genaue Schätzungen und sagt Ihnen, wann es am besten ist, eine Position zu eröffnen und zu schließen. Sehen Sie sich das Video (6:22) mit einem Beispiel für die Verarbeitung nur eines Signals an, das sich für den Indikator gelohnt hat! Die meisten Händler ver
FX Volume MT5
Daniel Stein
4.93 (14)
Erhalten Sie Ihr tägliches Marktupdate mit Details und Screenshots über unser Morning Briefing hier auf mql5 und auf Telegram ! FX Volume ist der ERSTE und EINZIGE Volumenindikator, der einen ECHTEN Einblick in die Marktstimmung aus Sicht eines Brokers bietet. Es bietet fantastische Einblicke in die Positionierung von institutionellen Marktteilnehmern, wie z.B. Brokern, auf dem Forex-Markt, viel schneller als COT-Berichte. Diese Informationen direkt auf Ihrem Chart zu sehen, ist der wahre Game
FxaccurateLS
Shiv Raj Kumawat
WHY IS OUR FXACCCURATE LS MT5 THE PROFITABLE ? PROTECT YOUR CAPITAL WITH RISK MANAGEMENT Gives entry, stop and target levels from time to time. It finds Trading opportunities by analyzing what the price is doing during established trends. POWERFUL INDICATOR FOR A RELIABLE STRATEGIES We have made these indicators with a lot of years of hard work. It is made at a very advanced level. Established trends provide dozens of trading opportunities, but most trend indicators completely ignore them!
Advanced Supply Demand MT5
Bernhard Schweigert
4.5 (14)
Derzeit 33% Rabatt! Die beste Lösung für jeden Anfänger oder erfahrenen Händler! Dieser Indikator ist ein einzigartiges, qualitativ hochwertiges und erschwingliches Trading-Tool, da wir eine Reihe von proprietären Funktionen und eine neue Formel integriert haben. Mit diesem Update werden Sie in der Lage sein, doppelte Zeitrahmenzonen anzuzeigen. Sie können nicht nur einen höheren TF (Zeitrahmen) anzeigen, sondern sowohl den Chart-TF als auch den höheren TF: SHOWING NESTED ZONES. Alle Supply Dema
Jetzt 147 US -Dollar (nach ein paar Aktualisierungen auf 499 US -Dollar) - Unbegrenzte Konten (PCs oder MACs) RelicusRoad Benutzerhandbuch + Schulungsvideos + Zugang zur privaten Discord-Gruppe + VIP-Status EINE NEUE ART, DEN MARKT ZU BETRACHTEN RelicusRoad ist der weltweit leistungsstärkste Handelsindikator für Forex, Futures, Kryptowährungen, Aktien und Indizes und gibt Händlern alle Informationen und Tools, die sie benötigen, um profitabel zu bleiben. Wir bieten technische Analysen un
Dieses Dashboard zeigt die   neuesten verfügbaren harmonischen   Muster für die ausgewählten Symbole, so dass Sie Zeit sparen und effizienter sein werden /   MT4-Version . Kostenloser Indikator:   Basic Harmonic Pattern Spalten des Indikators Symbol:   die ausgewählten Symbole werden angezeigt Trend:   bullish oder bearish Pattern :   Art des Musters (Gartley, Schmetterling, Fledermaus, Krabbe, Hai, Cypher oder ABCD) Entry :   Einstiegskurs SL:   Stop-Loss-Kurs TP1:   1. Take-Profit-Kurs
Der Forex TPA Indikator deckt die wahren Aktionen der Marktmacher auf, immer dann wenn sie passieren. "Kämpfe nicht gegen die Marktmacher an, sondern folge ihnen", ist wohl der beste Rat, den ein Trader bekommen kann. Der TPA Indikator zeigt jedesmal seine Signale an wenn die Bullen definitiv stärker sind als die Bären und umgekehrt. Dieser Indikator wurde VON Tradern FÜR Trader gemacht und ist 100% NICHT NACHZEICHNEND! Signale werden STRENG am Schluss einer Kerze  generiert. Das sagen unsere Ku
Divergenzen sind schwierig zu finden und seltener anzutreffen. Sie sind eines der zuverlässigsten Handelsszenarien. Dieser Indikator sucht automatisch mit Ihrem bevorzugten Oszillator nach regelmäßigen und versteckten Abweichungen. [ Installationsanleitung | Update-Anleitung | Fehlerbehebung | FAQ | Alle Produkte ] Einfach zu handeln Findet regelmäßige und versteckte Abweichungen Unterstützt viele bekannte Oszillatoren Implementiert Handelssignale basierend auf Ausbrüchen Zeigt geeignete
MetaForecast M5
Vahidreza Heidar Gholami
5 (2)
MetaForecast prognostiziert und visualisiert die Zukunft eines beliebigen Marktes basierend auf den Harmonien in den Preisdaten. Obwohl der Markt nicht immer vorhersehbar ist, kann MetaForecast, wenn es ein Muster im Preis gibt, die Zukunft so genau wie möglich voraussagen. Im Vergleich zu ähnlichen Produkten kann MetaForecast durch die Analyse von Markttrends genauere Ergebnisse erzeugen. Eingabeparameter Past size (Vergangene Größe) Gibt an, wie viele Balken MetaForecast verwendet, um ein Mo
Trend Hunter MT5
Andrey Tatarinov
4 (2)
Trend Hunter ist ein Trendindikator für die Arbeit auf den Forex-, Kryptowährungs- und CFD-Märkten. Eine Besonderheit des Indikators besteht darin, dass er dem Trend souverän folgt, ohne das Signal zu ändern, wenn der Preis die Trendlinie leicht durchbricht. Der Indikator wird nicht neu gezeichnet; nach dem Schließen des Balkens erscheint ein Signal zum Markteintritt. Bei der Bewegung entlang eines Trends zeigt der Indikator zusätzliche Einstiegspunkte in Richtung des Trends an. Basierend auf
PZ Swing Trading MT5
PZ TRADING SLU
5 (4)
Swing Trading ist der erste Indikator, der Schwankungen in Trendrichtung und mögliche Umkehrschwankungen erkennt. Es wird der in der Handelsliteratur weit verbreitete Baseline-Swing-Trading-Ansatz verwendet. Der Indikator untersucht mehrere Preis- und Zeitvektoren, um die aggregierte Trendrichtung zu verfolgen und erkennt Situationen, in denen der Markt überverkauft oder überkauft ist und zur Korrektur bereit ist. [ Installationsanleitung | Update-Anleitung | Fehlerbehebung | FAQ | Alle Produkte
Golden Spikes Premium
Kwaku Bondzie Ghartey
Golden Spikes Detector Acknowledgement and Dedications:  The name of this indicator was Inspired by an Original; Mr Grant Koopman; a Knowledgeable and experienced Synthetics trader. I dedicate this indicator to Mr Grant.  Overview: The Golden Spikes Premium is a groundbreaking trading indicator meticulously crafted for the Boom and Crash indices on the Deriv market. Tailored to meet the needs of discerning traders, this powerful tool operates exclusively on the one-minute timeframe, providin
The Price Action Finder Multi indicator is an indicator of entry points that searches for and displays Price Action system patterns on dozens of trading instruments and on all standard time frames: (m1, m5, m15, m30, H1, H4, D1, Wk, Mn). The indicator places the found patterns in a table at the bottom of the screen. By clicking on the pattern names in the table, you can move to the chart where this pattern is located. Manual (Be sure to read before purchasing) | Version for MT4 Advantages 1. Pa
Blahtech Supply Demand MT5
Blahtech Limited
4.54 (13)
Was: $299  Now: $99   Supply Demand uses previous price action to identify potential imbalances between buyers and sellers. The key is to identify the better odds zones, not just the untouched ones. Blahtech Supply Demand indicator delivers functionality previously unavailable on any trading platform. This 4-in-1 indicator not only highlights the higher probability zones using a multi-criteria strength engine, but also combines it with multi-timeframe trend analysis, previously confirmed swings
Royal Scalping Indicator M5
Vahidreza Heidar Gholami
5 (6)
Royal Scalping Indicator is an advanced price adaptive indicator designed to generate high-quality trading signals. Built-in multi-timeframe and multi-currency capabilities make it even more powerful to have configurations based on different symbols and timeframes. This indicator is perfect for scalp trades as well as swing trades. Royal Scalping is not just an indicator, but a trading strategy itself. Features Price Adaptive Trend Detector Algorithm Multi-Timeframe and Multi-Currency Trend Low
Dieser Indikator erkennt über 30 japanische Candlestick-Muster und hebt sie wunderschön auf der Karte hervor. Es ist einfach einer dieser Indikatoren, auf die Preisaktionshändler nicht verzichten können. Steigern Sie Ihre technische Analyse über Nacht Erkennen Sie leicht japanische Kerzenmuster Handeln Sie zuverlässig und mit universellen Umkehrmustern Springen Sie mithilfe von Fortsetzungsmustern sicher auf etablierte Trends Der Indikator ist nicht neu lackiert und implementiert Warnungen Der
SwingVolumePro
Thalles Nascimento De Carvalho
Überblick SwingVolumePro ist ein fortschrittlicher und vielseitiger Indikator, der für eine breite Palette von Finanzinstrumenten entwickelt wurde und verschiedene Handelsstile unterstützt. Basierend auf strengen Analysen von Volumen und Preis bietet er klare und präzise Signale, die es Händlern aller Erfahrungsstufen ermöglichen, informierte Entscheidungen auf Grundlage hochwertiger Daten zu treffen. SwingVolumePro.PDF Hauptmerkmale Vielseitigkeit: SwingVolumePro kann auf verschied
PipFinite Exit EDGE MT5
Karlo Wilson Vendiola
4.86 (29)
Did You Have A Profitable Trade But Suddenly Reversed? In a solid strategy, exiting a trade is equally important as entering. Exit EDGE helps maximize your current trade profit and avoid turning winning trades to losers. Never Miss An Exit Signal Again Monitor all pairs and timeframes in just 1 chart www.mql5.com/en/blogs/post/726558 How To Trade You can close your open trades as soon as you receive a signal Close your Buy orders if you receive an Exit Buy Signal. Close your Sell orde
PipFinite Exit Scope MT5
Karlo Wilson Vendiola
4.33 (3)
Did You Have A Profitable Trade But Suddenly Reversed? Exiting a trade is equally important as entering! Exit Scope helps maximize your current trade profit and avoid turning winning trades to losers. Attention Exit Signals are NOT to be used in entering a trade! Exit means closing your trades to avoid correction/reversal which can wipe out existing profit or haunt break-even orders. Please watch presentation (Click Here) Features Generates instant exit signals based on price action, volat
Gartley Hunter Multi
Siarhei Vashchylka
5 (8)
Gartley Hunter Multi - An indicator for searching for harmonic patterns simultaneously on dozens of trading instruments and on all possible timeframes. Manual (Be sure to read before purchasing) | Version for MT4 Advantages 1. Patterns: Gartley, Butterfly, Shark, Crab. Bat, Alternate Bat, Deep Crab, Cypher 2. Simultaneous search for patterns on dozens of trading instruments and on all possible timeframes 3. Search for patterns of all possible sizes. From the smallest to the largest 4. A
The   Currency Index indicator   enables traders to display any index of eight major currencies. It uses a special calculation that considers specific currency pairs and their weights. The default weights are based on the BIS Triennial Central Bank Survey results. Because of this advantage, the trader can see each currency's true strength and weakness. Note:  If the indicator is used in Strategy Tester (demo version), please keep in mind that all currency pairs' data must be downloaded in H
PZ Day Trading MT5
PZ TRADING SLU
2.83 (6)
Dieser Indikator erkennt Preisumkehrungen im Zick-Zack, wobei nur Preisaktionsanalysen und ein Donchian-Kanal verwendet werden. Es wurde speziell für den kurzfristigen Handel entwickelt, ohne dass ein Nachlackieren oder ein Backpainting erforderlich ist. Es ist ein fantastisches Werkzeug für clevere Trader, die darauf abzielen, das Timing ihrer Operationen zu verbessern. [ Installationsanleitung | Update-Anleitung | Fehlerbehebung | FAQ | Alle Produkte ] Erstaunlich einfach zu handeln Es bi
Native Channels
BeeXXI Corporation
5 (1)
This indicator recognizes all support and resistance levels. A number of unique high-performance techniques have been applied, which made the existence of this indicator possible. All formed channels are naturally visible: horizontal linear linear parabolic cubic (Polynomial 3 degrees - Wave) This is due to a bundle of approximating channels. The formed channels form "standing waves" in a hierarchical sequence. Thus, all support and resistance levels are visible. All parameter management is
Bill Williams Advanced
Siarhei Vashchylka
5 (8)
Bill Williams Advanced is designed for automatic chart analysis using Bill Williams' "Profitunity" system. The indicator analyzes four timeframes at once. Manual (Be sure to read before purchasing) Advantages 1. Automatically analyzes the chart using the "Profitunity" system of Bill Williams. The found signals are placed in a table in the corner of the screen. 2. Equipped with a trend filter based on the Alligator indicator. Most of the system signals are recommended to be used only accordi
Sind Sie es leid, Unterstützungs- und Widerstandslinien zu zeichnen? Der Unterstützungswiderstand ist ein Multi-Zeitrahmen-Indikator, der Unterstützungs- und Widerstandslinien mit einer sehr interessanten Wendung automatisch erkennt und zeichnet: Wenn das Preisniveau im Laufe der Zeit getestet wird und seine Bedeutung zunimmt, werden die Linien dicker und dunkler. [ Installationsanleitung | Update-Anleitung | Fehlerbehebung | FAQ | Alle Produkte ] Steigern Sie Ihre technische Analyse über Nacht
Weitere Produkte dieses Autors
Pin Bar
Alexey Topounov
5 (1)
This indicator shows Pin Bar candlestick pattern on the chart. The bearish pin bars have red color, the bullish pin bars have blue color. The indicator shows alert when Pin Bar candlestick pattern is formed. It's recommended to use it at timeframes H1 and higher. The best moment (strong signal) is when Pin Bar is formed close to the support/resistance level.
Synthetic Reverse Bar
Alexey Topounov
5 (1)
Synthetic Reverse Bar is an evolution of Reverse Bar indicator. It is well-known that candlestick patterns work best at higher timeframes (H1, H4). However, candlesticks at such timeframes may form differently at different brokers due to dissimilarities in the terminal time on the single symbol, while the history of quotes on M1 and M5 remains the same! As a result, successful patterns are often not formed at higher timeframes! Synthetic Reverse Bar solves that problem! The indicator works on M5
Soldiers Crows
Alexey Topounov
5 (1)
The indicator displays the "Three white soldiers and Three black crows" candlestick model on a chart. Three white soldiers are color in blue. Three black crows are colored in red. Input parameters: Max Bars - maximum number of bars calculated on the chart. Make Signal Alert - use alert. Type of pattern rules - use a strict model of determining the pattern (short lower shadows for the three soldiers, short upper shadows for the three crows), or a simplified model. Max Shadow Ratio - coefficient o
Reverse Bar
Alexey Topounov
The Reverse Bar indicator paints the reversal bars according to trade strategy, described by Bill Williams in "Trading Chaos. Maximize Profits with Proven Technical Techniques" book. The bearish reversal bar has red or pink color (red-stronger signal) The bullish reversal bar has blue or light blue color(blue - stronger signal) It is recommended to use it on hourly timeframe (H1) and higher.
The indicator displays the "Morning star" and "Evening star" patterns on a chart. The Evening star is displayed in red or rose. The Morning star is displayed in blue or light blue. Input Parameters: Max Bars – number of bars calculated on the chart. Make Signal Alert – use alerts. Send Push Notification - send notification to a mobile terminal Type of rules pattern – type of the model of pattern determination (Hard – with the control of length of shadows of the second bar). If Soft is select
HL D1 Move
Alexey Topounov
The indicator displays the dynamics of forming the daily range in the form of a histogram, and the average daily range for a specified period. The indicator is a useful auxiliary tool for intraday trades. Settings N Day - period for calculation of the daily range value. Level Indefinite - level of indefiniteness. Level Confidence - level of confidence. Level Alert - alert level. When it is crossed, the alert appears.
Bullish Bearish Volume is an indicator that divides the volume into the bearish and the bullish part according to VSA: Bullish volume is a volume growing during upward motion and a volume falling during downward motion. Bearish volume is a volume growing during downward motion and a volume falling during upward motion. For a higher obviousness it uses smoothing using MA of a small period. Settings: MaxBars – number of bars calculated on the chart; Method – smoothing mode (Simple is most preferab
Trading Sessions Pro is a trading session indicator with extended settings + the ability to install and display the custom period. Main Advantages: The indicator allows you to conveniently manage display of trading sessions on the chart. There is no need to enter the settings each time. Just click the necessary trading session in the lower window and it is highlighted by the rectangle on the chart! The indicator has two modes of defining the trading terminal's time offset relative to UTC (GMT)
VWAP is Volume Weighted Average Price. It is calculated as addition of products of volume and price divided by the total volume. This version of the indicator is universal as it has three modes of operation: Moving - in this mode the indicator works as a moving average. But unlike ordinary SMA it has smaller lags during big movements! Bands of square deviation can be used in the same way as Bollinger Bands. Period - in this mode the calculations are performed from the start to the end of period
Divergence MACD indicator shows price and MACD indicator divergence. The indicator is not redrawn! The algorithm for detection of price and MACD extremums has been balanced for the earliest entry allowing you to use the smallest SL order possible. The indicator displays all types of divergences including the hidden one, while having the minimum number of settings. Find out more about the divergence types in Comments tab. Launch settings: Max Bars - number of bars calculated on the chart. Indent
Вертикальная гистограмма объема -  отображает распределение объема по уровням. Гистограмма рассчитывается от объема ( реального или тикового), при этом объем соответствующий бару переносится на уровень H-L бара. Таким образом, при распределении объема за сутки по вертикали - формируются максимумы гистограммы показывающие области проторговки. Настройки индикатора: Timeframe Set -  период в пределах которого производится расчет. (рекомендуется D1) Step's - количество отображаемых периодов. Amplit
Hurst Fractal Index Фрактальный Индекс Херста -  показатель персистентности временного ряда При значении индикатора >0.5 временной ряд считается персистентным (тенденция сохраняется) При значениях индикатора явно < 0.5 временной ряд считается антиперсистентным (возможна смена направления движения) Для наглядности значения индекса усредняются периодом 2-3. Настройки индикатора: Max Bars -  глубина истории расчета (кол-во баров на графике для которых произведён расчет) Data from Timeframe - исполь
Auswahl:
Keine Bewertungen
Antwort auf eine Rezension
Version 2.3 2021.11.30
- исправлены ошибки
- перекомпиляция в новой версии терминала