Candle Zones PRO
- Indikatoren
- Flavio Javier Jarabeck
- Version: 1.1
- Aktivierungen: 20
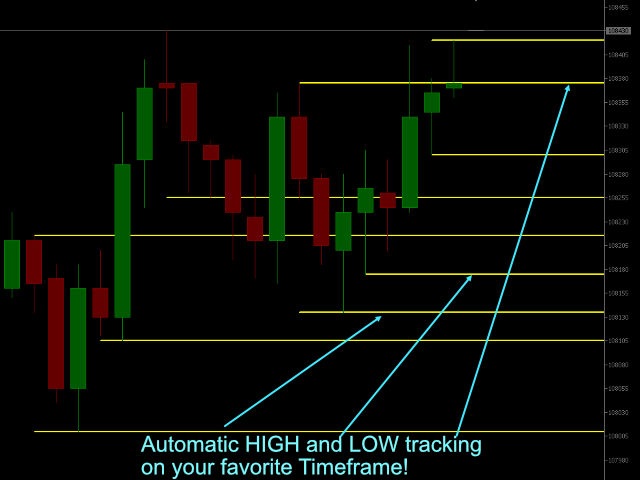
You probably heard about Candlesticks behaviors, which in most of the times could denote and trace Volume behaviors even if you are not watching Volume itself... Well, this indicator will do this. Naked traders love to rely solely on candlesticks patterns and with Candle Zones you can trap special patterns and DRAW THEM on your chart.
As simple as that. There are several filters you can tweak in order to achieve the analysis you want. Just give it a try.
After several months of testing, we think we created a very reliable indicator that you can use in your Day Trading sessions, with the limitation of the M15 Timeframe, and over unlimited past days of analysis.
WHAT YOU WILL GET?
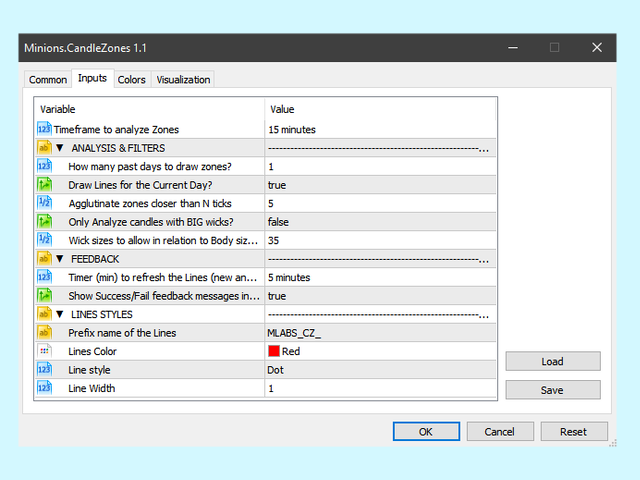
- Timeframe to Analyze Zones - 5, 10, 15, 30 minutes, H1, H4, Daily, Weekly and Monthly. It independs of the Chart Timeframe. That's the beauty of this indicator.
- How many past days to use in the analysis?
- Draw lines for the current Day? (ON/OFF)
- Timer to update/refresh the lines.
- Hability to name the lines draw to your liking, this way you can read them from your EA.
- In order to avoid too much lines and signals, Let's agglutinate lines that are within a range.
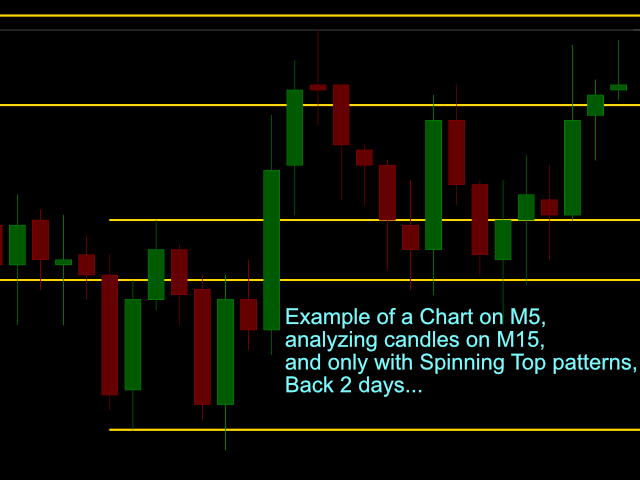
- Would you like to analyze every candle in the timeframe or just those with BIG WICKS? (as Spinning Tops and/or Dojis)?
- What would be the Wick Size in relation to the Candle Body in order to consider a Spinning Top/Doji candle?
ADDITIONAL SETTINGS
- Show all indicator feedback messages in order to have it running smoothly.
- Line Color
- Line Style
- Line Width
If you want to try a Lighter and fully functional version of this indicator (only limited by the Timeframes offered), please visit this link:
Didn't Find a Feature You Need?
No product is perfect for everyone. If you think you need a missing feature from our product just send us a message. We love feedback!
Live Long and Prosper!
;)