AutoSignals Trend Panel
- Indikatoren
- Danilo Maia Siqueira
- Version: 1.0
- Aktivierungen: 9
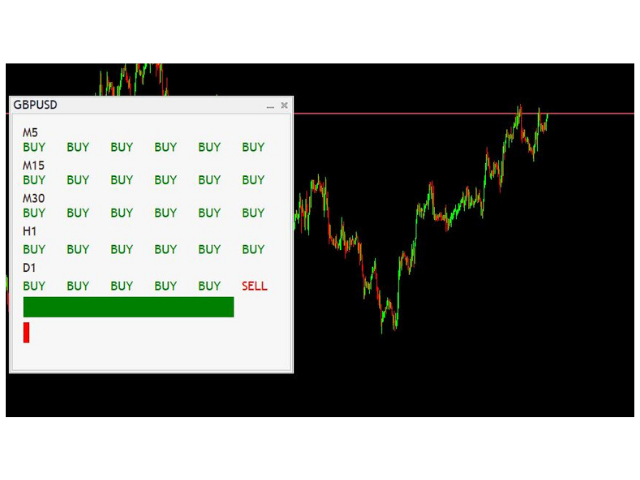
Der Indikator verfolgt den Trend in 5 verschiedenen Chartzeiten für dasselbe Asset, basierend auf 6 Signalen für jede Chartzeit.
Das Hauptziel des Indikators besteht darin, uns den Mehrheitstrend des finanziellen Vermögenswerts zu zeigen, in den er platziert wurde. Das System überträgt die Informationen der Trends in mehreren grafischen Zeiten. Auf diese Weise hat der Benutzer einen umfassenden Überblick über die Bewegung des Assets. Diese Art von Tool ermöglicht dem Benutzer eine höhere Trefferquote, indem er dem Bediener bei der Ausführung von Aufträgen hilft zugunsten des Trends.
Das Hauptziel des Indikators besteht darin, uns den Mehrheitstrend des finanziellen Vermögenswerts zu zeigen, in den er platziert wurde. Das System überträgt die Informationen der Trends in mehreren grafischen Zeiten. Auf diese Weise hat der Benutzer einen umfassenden Überblick über die Bewegung des Assets. Diese Art von Tool ermöglicht dem Benutzer eine höhere Trefferquote, indem er dem Bediener bei der Ausführung von Aufträgen hilft zugunsten des Trends.